


AGNs can be identified by a variety of methods. Most AGN surveys rely on some aspect of the distinctive AGN spectrum, such as the presence of strong or broad emission lines, an unusually blue continuum, or strong radio or X-ray emission. All of these techniques are effective, but none is free from selection effects. To search for AGNs in nearby galaxies, where the nonstellar signal of the nucleus is expected to be weak relative to the host galaxy, the most effective and least biased method is to conduct a spectroscopic survey of a complete, optical-flux limited sample of galaxies. To be sensitive to weak emission lines, the survey must be deep and of sufficient spectral resolution. To obtain reliable line intensity ratios on which the principal nuclear classifications are based, the data must have accurate relative flux calibration, and one must devise a robust scheme to correct for the starlight contamination.
The most widely used system of spectral classification of emission-line
nuclei follows the method promoted by
Baldwin, Phillips &
Terlevich (1981),
and later modified by
Veilleux & Osterbrock
(1987).
The basic idea is that the relative strengths of certain prominent emission
lines can be used to probe the nebular conditions of a source. In the
context of the present discussion, the most important diagnostic is the
source of excitation, which broadly falls into two categories: stellar
photoionization or photoionization by a centrally located, spectrally
hard radiation field, such as that produced by the accretion disk of a
massive BH. How does one distinguish between the two? The forbidden
lines of the doublet
[O I]  6300, 6364
arise from collisional excitation of O0 by hot
electrons. Since the ionization potential of O0 (13.6 eV) is
nearly identical to that of hydrogen, in an ionization-bounded nebula
[O I] is produced
predominantly in the "partially ionized zone," wherein both neutral
oxygen and free electrons coexist. In addition to O0, the
conditions of the partially ionized zone are also favorable for
S+ and N+, whose ionization potentials are 23.3 eV
and 29.6 eV, respectively. Hence, in the absence of abundance anomalies,
[N II] 6548, 6583 and
[S II] 6716, 6731
are strong (relative to, say,
H
6300, 6364
arise from collisional excitation of O0 by hot
electrons. Since the ionization potential of O0 (13.6 eV) is
nearly identical to that of hydrogen, in an ionization-bounded nebula
[O I] is produced
predominantly in the "partially ionized zone," wherein both neutral
oxygen and free electrons coexist. In addition to O0, the
conditions of the partially ionized zone are also favorable for
S+ and N+, whose ionization potentials are 23.3 eV
and 29.6 eV, respectively. Hence, in the absence of abundance anomalies,
[N II] 6548, 6583 and
[S II] 6716, 6731
are strong (relative to, say,
H ) whenever [O I] is
strong, and vice versa.
) whenever [O I] is
strong, and vice versa.
In a nebula photoionized by young, massive stars, the partially ionized zone is very thin because the ionizing spectrum of OB stars contains few photons with energies greater than 13.6 eV. Hence, in the optical spectra of H II regions and starburst nuclei (hereinafter H II nuclei 1) the low-ionization transitions [N II], [S II], and especially [O I] are very weak. By contrast, a harder radiation field, such as that of an AGN power-law continuum that extends into the extreme-ultraviolet (UV) and X-rays, penetrates much deeper into an optically thick cloud, creating an extensive partially ionized zone and hence strong low-ionization forbidden lines. A hard AGN radiation field also boosts the production of collisionally excited forbidden line emission because its high thermal energy deposition rate enhances the gas temperature.
The spectra shown in Figure 1 illustrate the
empirical distinction between AGNs and H II nuclei. In NGC 7714, which has a well-known starburst nucleus
(Weedman et al. 1981),
[O I], [N II], and [S II] are
weak relative to H. The
[O III] 4959, 5007 doublet is quite
strong compared to [O II]
3727 or
H because the
metal abundance of NGC 7714's
nucleus is rather low, although the ionization level of H II nuclei can
span a wide range, depending on metallicity
(Ho, Filippenko & Sargent
1997c;
Kewley et al. 2001;
Groves, Heckman & Kauffmann
2006).
On the other hand, the low-ionization lines are markedly stronger
in the other two objects shown, both of which qualify as AGNs. NGC 1358 has a "high-ionization" AGN or "Seyfert"
nucleus. NGC 1052 is the prototype of the class known as
"low-ionization nuclear emission-line regions" or LINERs
(Heckman 1980b).
The ionization level can be judged by the relative strengths of
the oxygen lines, but in practice is most easily gauged by the
[O III] / H
ratio. In the commonly adopted system of
Veilleux & Osterbrock
(1987),
the division between Seyferts and LINERs occurs at
[O III] 5007
/ H = 3.0.
Ho, Filippenko & Sargent
(2003)
stress, however, that this
boundary has no strict physical significance. The ionization level of
the NLR in large, homogeneous samples of AGNs spans a wide and
apparently continuous range; there is no evidence for any clear-cut
transition between Seyferts and LINERs
(Ho, Filippenko & Sargent
2003),
although with sufficient numbers, the two classes do delineate
two distinct loci in optical diagnostic diagrams
(Kewley et al. 2006).
because the
metal abundance of NGC 7714's
nucleus is rather low, although the ionization level of H II nuclei can
span a wide range, depending on metallicity
(Ho, Filippenko & Sargent
1997c;
Kewley et al. 2001;
Groves, Heckman & Kauffmann
2006).
On the other hand, the low-ionization lines are markedly stronger
in the other two objects shown, both of which qualify as AGNs. NGC 1358 has a "high-ionization" AGN or "Seyfert"
nucleus. NGC 1052 is the prototype of the class known as
"low-ionization nuclear emission-line regions" or LINERs
(Heckman 1980b).
The ionization level can be judged by the relative strengths of
the oxygen lines, but in practice is most easily gauged by the
[O III] / H
ratio. In the commonly adopted system of
Veilleux & Osterbrock
(1987),
the division between Seyferts and LINERs occurs at
[O III] 5007
/ H = 3.0.
Ho, Filippenko & Sargent
(2003)
stress, however, that this
boundary has no strict physical significance. The ionization level of
the NLR in large, homogeneous samples of AGNs spans a wide and
apparently continuous range; there is no evidence for any clear-cut
transition between Seyferts and LINERs
(Ho, Filippenko & Sargent
2003),
although with sufficient numbers, the two classes do delineate
two distinct loci in optical diagnostic diagrams
(Kewley et al. 2006).
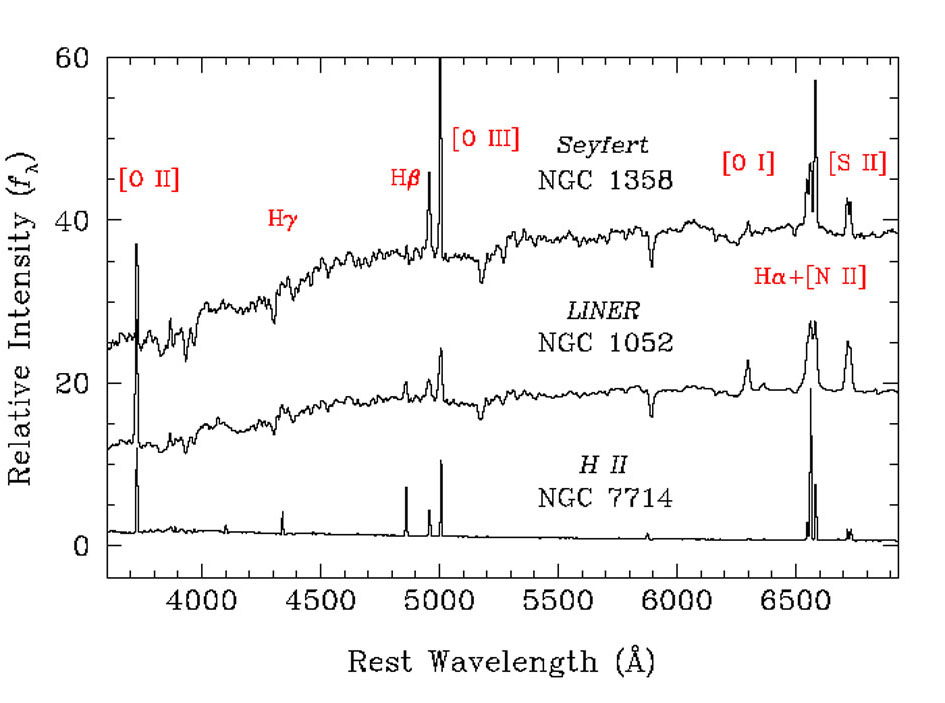 |
Figure 1. Sample optical spectra of the various classes of emission-line nuclei. Prominent emission lines are identified. (Based on Ho, Filippenko & Sargent 1993 and unpublished data.) |
The classification system discussed above makes no reference to the profiles of the emission lines. Luminous AGNs such as quasars and many classical Seyfert galaxies exhibit permitted lines with a characteristically broad component, with full width at half-maximum (FWHM) widths of ~ 1000 to 10,000 km s-1. This component arises from the BLR, which is thought to be physically distinct from the NLR responsible for the narrow lines. Following Khachikian & Weedman (1974), it is customary to refer to Seyferts with and without (directly) detectable broad lines as "type 1" and "type 2" sources, respectively. As discussed in Section 3.4, this nomenclature can also be extended to include LINERs.
The classification system of
Veilleux & Osterbrock
(1987),
which I adopt throughout this paper, is based on two-dimensional
line-intensity ratios constructed from
[O III] 5007,
H
4861,
[O I] 6300,
H
6563,
[N II] 6583, and
[S II] 6716, 6731 (here
H and
H refer only to the
narrow component of the line). The main virtues of
this system, shown in Figure 2, are (1) that it
uses relatively strong lines, (2) that the lines lie in an easily
accessible region of the optical spectrum, and (3) that the line ratios
are relatively insensitive to reddening corrections because of the close
separation of the lines. The definitions of the various classes of
emission-line objects are given in
Ho, Filippenko & Sargent
(1997a)
2. In addition to the three
main classes discussed thus far - H II nuclei, Seyferts, and LINERs -
Ho, Filippenko & Sargent
(1993)
identified a group of "transition objects" whose [O I]
strengths are intermediate between those of H II nuclei and LINERs. Since
they tend to emit weaker [O I] emission than classical LINERs, previous
authors have called them "weak-[O I] LINERs"
(Filippenko & Terlevich
1992;
Ho & Filippenko 1993).
Ho, Filippenko & Sargent
(1993)
postulated that transition objects are composite systems having both an
H II region and a LINER component; I will return to the nature of these
sources in Section 6.5.
 |
Figure 2. Diagnostic diagrams plotting
(a) log
[O III] |
Note that my definition of LINERs differs from that originally proposed by
Heckman (1980b),
who used solely the oxygen lines:
[O II] 3727 >
[O III] 5007 and
[O I] 6300 > 0.33
[O III] 5007. The two
definitions, however, are nearly equivalent. Inspection of the full optical
spectra of
Ho, Filippenko & Sargent
(1993),
for example, reveals that emission-line nuclei classified as LINERs
based on the Veilleux & Osterbrock diagrams almost always also
satisfy Heckman's criteria. This is a consequence of the inverse
correlation between [O III] /
H and [O II]
/ [O III] in photoionized gas with fairly low excitation.
The scheme described above, while conceptually simple, overlooks one key practical complication. The integrated spectra of galactic nuclei include starlight, which in most nearby systems overwhelms the nebular line emission (Figure 1). Any reliable measurement of the emission-line spectrum of galactic nuclei, therefore, must properly account for the starlight contamination.
An effective strategy for removing the starlight from an integrated spectrum is that of "template subtraction," whereby a template spectrum devoid of emission lines is suitably scaled to and subtracted from the spectrum of interest to yield a continuum-subtracted, pure emission-line spectrum. A number of approaches have been adopted to construct the template. These include using (1) the spectrum of an off-nuclear position within the same galaxy (e.g., Storchi-Bergmann, Baldwin & Wilson 1993); (2) the spectrum of a different galaxy devoid of emission lines (e.g., Costero & Osterbrock 1977; Filippenko & Halpern 1984; Ho, Filippenko & Sargent 1993); (3) a weighted linear combination of the spectra of a number different galaxies, chosen to best match the stellar population and velocity dispersion (Ho, Filippenko & Sargent 1997a); (4) a variant of (3), but employing a stellar library and simultaneously fitting for the emission lines and accounting for dust reddening (Sarzi et al. 2007); (5) a mean spectrum derived from a principal-component analysis of a large set of galaxies (Hao et al. 2005a); and (6) a model spectrum constructed from population synthesis techniques, using as input a library of spectra of either individual stars (e.g., Keel 1983c), synthesis models (e.g., Tremonti et al. 2004; Sarzi et al. 2005), or star clusters (e.g., Bonatto, Bica & Alloin 1989). Some studies (e.g., Kim et al. 1995) implicitly assume that only the hydrogen Balmer lines are contaminated by starlight and that the absorption-line component can be removed by assuming a constant equivalent width (EW = 2-3 Å). This procedure is inadequate for a number of reasons. First, the stellar population of nearby galactic nuclei, although relatively uniform, is by no means invariant (Ho, Filippenko & Sargent 2003). Second, the equivalent widths of the different Balmer absorption lines within each galaxy are generally not constant. Third, the Balmer absorption lines affect not only the strength but also the shape of the Balmer emission lines. And finally, starlight contaminates more than just the Balmer lines.
Figure 3 illustrates the starlight subtraction
process for the LINER NGC 3998. Note that in the original observed
spectrum, many of the weaker
emission lines were hardly visible, whereas after starlight subtraction,
they can easily be measured. The intensities of even strong lines such
H and [O III]
4959, 5007 are
modified. Importantly, starlight
correction is essential for properly identifying the weak broad
H component in NGC 3998.
 |
Figure 3. Illustration of starlight removal
for NGC 3998 using the template
galaxy NGC 3115. Prominent emission lines are labeled. The
insert shows an expanded view of the
H |
2.5. Other Classification Criteria
Although the traditional optical classification system described above
is the most widely used, there are instances when features in other
spectral regions may be more practical or useful. Surveys of
intermediate-redshift galaxies, for example, cannot routinely access the
H region, and under such
circumstances it is desirable to devise a classification system based
only on the blue part of the spectrum. Diagnostic diagrams proposed by
Rola, Terlevich & Terlevich
(1997)
based on the strong lines [O II]
3727,
[Ne III] 3869, 3968,
H, and [O III]
4959, 5007 provide
moderately effective discrimination
between starbursts and AGNs. A number of redshift surveys have searched
for narrow-line AGNs based on the presence of
[Ne V] 3346, 3426
(e.g., Hall et al. 2000;
Barger et al. 2001;
Szokoly et al. 2004).
With an ionization potential of 97 eV, [Ne V] unambiguously arises from
nonstellar excitation, but the practical difficulty is that these lines
are quite weak (strength ~ 10% of
[O III] 5007) and
often can only be detected with confidence in stacked spectra (e.g.,
Zakamska et al. 2003).
The long-standing controversy over the relevance of shock excitation
also has led to the development of line diagnostics outside of the
traditional optical window. Díaz, Pagel & Wilson
(1985;
see also
Díaz, Pagel &
Terlevich 1985;
Kirhakos & Phillips 1989)
suggested that [S III] 9069,
9532, in combination with
the optical lines of [O II], [O III], and [S II], are effective in
identifying shock-excited nebula. Since shock heating on average
achieves higher equilibrium electron temperatures than photoionization,
high-ionization UV lines such as
[N V] 1240 and
C IV 1549 can serve as a
powerful discriminant between these two processes (e.g.,
Allen, Dopita & Tsvetanov
1998).
The limited availability of UV spectra, however,
has restricted the wide use of these diagnostics.
Rapid progress in infrared (IR) technology has offered an important new
window that is not only less affected by dust but also potentially has
distinctive diagnostic power.
Alonso-Herrero et al. (1997)
show that Fe II 1.644 /
Br can
serve as an effective substitute for the
conventional [O I] 6300 /
H ratio. Unfortunately,
other strong near-IR features,
notably the vibrational lines of H2, are less useful because
they can be excited by multiple mechanisms
(Larkin et al. 1998).
The mid-IR regime is much more promising, particularly with the sensitivity
and wide bandpass afforded by Spitzer. For the first time, many
of the diagnostic lines previously discussed in a theoretical context
(Spinoglio & Malkan 1992;
Voit 1992)
actually can now be measured (e.g.,
Bendo et al. 2006;
Dale et al. 2006;
Sturm et al. 2005,
2006;
Rupke et al. 2007).
In addition to high-ionization lines such as
[Ne III] 15.5
µm,
[Ne V] 14.3
µm, and
[O IV] 25.9
µm, the low-ionization transitions of
Fe II 26.0
µm and [Si II]
34.8 µm
may prove to be especially useful as they can
constrain models of photo-dissociation and X-ray dissociation
regions. The hard radiation field of AGNs, even of low-luminosity
objects such as LINERs, appears to leave an imprint on the detailed
emission spectrum of polycyclic aromatic hydrocarbons
(Sturm et al. 2006;
Smith et al. 2007).
can
serve as an effective substitute for the
conventional [O I] 6300 /
H ratio. Unfortunately,
other strong near-IR features,
notably the vibrational lines of H2, are less useful because
they can be excited by multiple mechanisms
(Larkin et al. 1998).
The mid-IR regime is much more promising, particularly with the sensitivity
and wide bandpass afforded by Spitzer. For the first time, many
of the diagnostic lines previously discussed in a theoretical context
(Spinoglio & Malkan 1992;
Voit 1992)
actually can now be measured (e.g.,
Bendo et al. 2006;
Dale et al. 2006;
Sturm et al. 2005,
2006;
Rupke et al. 2007).
In addition to high-ionization lines such as
[Ne III] 15.5
µm,
[Ne V] 14.3
µm, and
[O IV] 25.9
µm, the low-ionization transitions of
Fe II 26.0
µm and [Si II]
34.8 µm
may prove to be especially useful as they can
constrain models of photo-dissociation and X-ray dissociation
regions. The hard radiation field of AGNs, even of low-luminosity
objects such as LINERs, appears to leave an imprint on the detailed
emission spectrum of polycyclic aromatic hydrocarbons
(Sturm et al. 2006;
Smith et al. 2007).
Finally, a comment on nomenclature. It is important to stress that the classification scheme outlined above, physically motivated by the desire to separate objects by their source of excitation, is based strictly on the characteristics of the narrow emission lines and not on ancillary attributes such as luminosity, presence of broad emission lines, galaxy morphology, or radio properties. Although one still customarily draws a quaint distinction between quasars and Seyferts based on luminosity, it is widely acknowledged that this division is largely historical. In terms of their position on the line-ratio diagrams, quasars fall on the high-ionization branch and thus can be classified as Seyferts. The same holds for many broad-line and narrow-line radio galaxies, including most Fanaroff & Riley (FR; 1974) type II radio sources, whose high luminosities generally translate directly into a high degree of ionization. By the same token, most FR I sources, because of their low luminosity, typically have fairly low-ionization spectra, and hence technically qualify as LINERs. FR I radio galaxies and LINERs are not separate beasts (cf. Falcke, Körding & Markoff 2004; Chiaberge, Capetti & Macchetto 2005). Strong historical prejudice also compels many to regard Seyfert nuclei as invariably radio-quiet sources that reside exclusively in spiral hosts, when, in fact, neither rule strictly holds (Ho & Peng 2001). Despite claims to the contrary (Krolik 1998; Sulentic, Marziani & Dultzin-Hacyan 2000), broad emission lines emphatically are not solely confined to Seyfert nuclei (Section 3.4). This misconception has led some people to define the Seyfert and LINER classes by their presence or absence of broad emission lines.
1 As originally defined (Weedman et al. 1981), a starburst nucleus is one whose current star formation rate is much higher than its past average rate. Since in general we do not know the star formation history of any individual object, I will adopt the more general designation of "H II nucleus." Back.
2 The classification criteria adopted here differ slightly from those proposed by Kewley et al. (2001), Kauffmann et al. (2003), or Stasinska et al. (2006), but this difference has little effect on the general conclusions. Back.