


The earliest redshift surveys already indicated that the spectra of galaxy
centers often show strong emission lines (e.g.,
Humason, Mayall & Sandage
1956).
In many instances, the spectra revealed abnormal line-intensity
ratios, most notably the unusually great strength of [N II] relative to
H (Burbidge & Burbidge 1962,
1965;
Rubin, Ford & Thonnard
1980;
Rose & Searle 1982).
That the optical emission-line spectra of some nuclei show patterns of
low ionization was noticed from time to time, primarily by Osterbrock
and his colleagues (e.g.,
Osterbrock & Dufour 1973;
Osterbrock & Miller 1975;
Koski & Osterbrock 1976;
Costero & Osterbrock 1977;
Grandi & Osterbrock
1978;
Phillips 1979),
but also by others (e.g.,
Disney & Cromwell 1971;
Danziger, Fosbury & Penston
1977;
Fosbury et al. 1977,
1978;
Penston & Fosbury 1978;
Stauffer & Spinrad 1979).
(Burbidge & Burbidge 1962,
1965;
Rubin, Ford & Thonnard
1980;
Rose & Searle 1982).
That the optical emission-line spectra of some nuclei show patterns of
low ionization was noticed from time to time, primarily by Osterbrock
and his colleagues (e.g.,
Osterbrock & Dufour 1973;
Osterbrock & Miller 1975;
Koski & Osterbrock 1976;
Costero & Osterbrock 1977;
Grandi & Osterbrock
1978;
Phillips 1979),
but also by others (e.g.,
Disney & Cromwell 1971;
Danziger, Fosbury & Penston
1977;
Fosbury et al. 1977,
1978;
Penston & Fosbury 1978;
Stauffer & Spinrad 1979).
The activity in this field culminated in the 1980s, beginning with the recognition (Heckman, Balick & Crane 1980; Heckman 1980b) of LINERs as a major constituent of the extragalactic population, and then followed by further systematic studies of larger samples of galaxies (Stauffer 1982a, 1982b; Keel 1983b, 1983c; Phillips et al. 1986; Véron & Véron-Cetty 1986; Véron-Cetty & Véron 1986; see Ho 1996 for more details). These surveys established three important results. (1) A large fraction of local galaxies contain emission-line nuclei. (2) Many of these sources are LINERs. And (3) LINERs may be accretion-powered systems.
Despite the successes of these seminal studies, there was room for
improvement. Although most of the surveys attempted some form of
starlight subtraction, the accuracy of the methods used was limited (see
discussion in
Ho, Filippenko & Sargent
1997a),
the procedure was
sometimes inconsistently applied, and in some of the surveys, starlight
subtraction was altogether neglected. The problem is exacerbated by the
fact that the apertures used for the observations were quite large,
thereby admitting an unnecessarily large amount of
starlight. Furthermore, most of the data were collected with rather low
spectral resolution (FWHM
 10 Å). Besides
losing useful
kinematic information, blending between the emission and absorption
components further compromises the ability to separate the two.
10 Å). Besides
losing useful
kinematic information, blending between the emission and absorption
components further compromises the ability to separate the two.
Thus, it was clear that much would be gained from a survey having greater sensitivity to the detection of emission lines. The sensitivity could be improved in at least four ways: by taking spectra with higher signal-to-noise ratio and spectral resolution, by using a narrower slit to better isolate the nucleus, and by employing more effective methods to handle the starlight correction.
The Palomar spectroscopic survey of nearby galaxies
(Filippenko & Sargent
1985;
Ho, Filippenko & Sargent
1995,
1997a,
1997b,
1997c,
1997d,
2003;
Ho et al. 1997e)
was designed with these goals in
mind. Using a double CCD spectrograph mounted on the Hale 5-m reflector,
high-quality, moderate-resolution, long-slit spectra were obtained for a
magnitude-limited (BT
 12.5 mag) sample
of 486 northern
(
12.5 mag) sample
of 486 northern
( > 0°)
galaxies. Drawn from the Revised Shapley-Ames (RSA) Catalog of Bright
Galaxies
(Sandage & Tammann 1981),
the bright magnitude limit ensured that the sample had a
high degree of completeness. The spectra simultaneously cover the
wavelength ranges 6210-6860 Å with ~ 2.5 Å resolution (FWHM)
and 4230-5110 Å with ~ 4 Å resolution. Most of the observations
were obtained with a narrow
(1''-2'') slit, and
relatively long exposure times gave high signal-to-noise ratios. This
survey still contains the largest database to date of homogeneous and
high-quality optical spectra of nearby galaxies. It is also the most
sensitive; the detection limit for emission lines is EW
0.25 Å, roughly an
order-of-magnitude improvement compared to previous or subsequent
work. The selection criteria ensure that the sample gives a fair
representation of the local (z
0) galaxy population, and
the proximity of the objects (median distance = 17 Mpc) results in
relatively good spatial resolution (typically
> 0°)
galaxies. Drawn from the Revised Shapley-Ames (RSA) Catalog of Bright
Galaxies
(Sandage & Tammann 1981),
the bright magnitude limit ensured that the sample had a
high degree of completeness. The spectra simultaneously cover the
wavelength ranges 6210-6860 Å with ~ 2.5 Å resolution (FWHM)
and 4230-5110 Å with ~ 4 Å resolution. Most of the observations
were obtained with a narrow
(1''-2'') slit, and
relatively long exposure times gave high signal-to-noise ratios. This
survey still contains the largest database to date of homogeneous and
high-quality optical spectra of nearby galaxies. It is also the most
sensitive; the detection limit for emission lines is EW
0.25 Å, roughly an
order-of-magnitude improvement compared to previous or subsequent
work. The selection criteria ensure that the sample gives a fair
representation of the local (z
0) galaxy population, and
the proximity of the objects (median distance = 17 Mpc) results in
relatively good spatial resolution (typically
 200 pc)
3. These properties of the
Palomar survey make it ideally suited to address issues on the
demographics and physical properties of nearby, and especially
low-luminosity, AGNs. Unless otherwise noted, most of the results
presented in this paper will be taken from the Palomar survey.
200 pc)
3. These properties of the
Palomar survey make it ideally suited to address issues on the
demographics and physical properties of nearby, and especially
low-luminosity, AGNs. Unless otherwise noted, most of the results
presented in this paper will be taken from the Palomar survey.
The Palomar survey has one other virtue that is not widely appreciated. Because the sample is large and essentially unbiased with respect to nuclear or global properties, it is ideally suited for comparative studies of various subpopulations. Examples include efforts to discern differences between type 1 versus type 2 sources to test AGN unification, to ascertain the influence of bars or environment on nuclear activity, or to test for subtle differences between the different AGN classes. The robustness of these and similar studies almost always hinges on the availability of proper control samples. With the Palomar survey, there is no need to construct a separate control sample, which is always a difficult and somewhat dubious undertaking, because the control sample is built into the survey.
For completeness, I mention several other sources of nearby AGNs that have been widely used by the community. The AGN sample culled from the CfA Redshift Survey (Huchra & Burg 1992) has been an important resource for a long time. Comprising 47 relatively bright Seyferts and a handful of LINERs, the CfA sample in many ways complements the Palomar sample at the bright end of the luminosity function. However, as discussed in Ho & Ulvestad (2001), the selection effects of the CfA sample are not easy to quantify because of the subjective and somewhat nonstandard manner in which AGNs were picked from the parent survey. Prior to the full publication of the Palomar survey, Maiolino & Rieke (1995) assembled a compilation of 91 Seyferts from a literature search of the galaxies in the RSA. These "RSA Seyferts" have subsequently been used in a number of follow-up studies. The substantial improvement in the data quality and analysis of the Palomar survey has resulted in many revised classifications of the RSA galaxies. Lastly, a cautionary note. Many investigators rely on literature compilations, such as those assembled in Véron-Cetty & Véron's (2006) catalog or the NASA/IPAC Extragalactic Database, as their source for AGN classifications. This is dangerous. The classifications in these compilations are highly heterogeneous and in some cases wrong.
The sample of nearby AGNs emerging from the Sloan Digital Sky Survey (SDSS)
(Kauffmann et al. 2003;
Hao et al. 2005b;
Kewley et al. 2006)
far surpasses that of the Palomar survey in number but not in
sensitivity. Moreover, because SDSS samples more distant galaxies, the
3''-diameter fibers used in
the survey subtend a physical scale of ~5.5 kpc at the typical redshift
z 0.1, 30
times larger than in the Palomar survey. The SDSS spectra
therefore include substantial contamination from off-nuclear emission,
which dilutes and, in some cases, inevitably confuses the signal from
the nucleus. Contamination by host galaxy emission has two
consequences. First, only
relatively bright nuclei have enough contrast to be detected. But second,
contamination can introduce a more pernicious systematic effect
that can be hard to quantify. Apart from normal H II regions, galactic
disks are known to contain extended emission-line regions that
exhibit low-ionization, LINER-like spectra. They can be confused with
genuine nuclear LINERs. Examples include gas shocked by supernova
remnants (e.g.,
Dopita & Sutherland
1995),
ejecta from starburst-driven winds
(Armus, Heckman & Miley
1990),
and diffuse, warm ionized plasma (e.g.,
Collins & Rand 2001).
Massive, early-type galaxies, though generally lacking in ongoing
star formation, also often possess X-ray emitting atmospheres that exhibit
extended, low-ionization emission-line nebulae (e.g.,
Fabian et al. 1986;
Heckman et al. 1989).
These physical processes, while interesting in their
own right, are not directly related, and thus irrelevant, to the AGN
phenomenon. Thus, LINERs selected from samples of distant galaxies
should be regarded with considerable caution. This comment applies also
to LINERs selected from samples of IR-bright galaxies (e.g.,
Kim et al. 1995;
Kewley et al. 2001;
Corbett et al. 2003),
which, in addition to being relatively distant and maximally confused
with starburst processes, have the additional disadvantage of often
being merging or interacting systems, wherein
shocks undoubtedly generate extended LINER-like emission. I strongly
recommend that researchers avoid IR-selected samples if they are
interested in investigating LINERs as an accretion phenomenon. Many of
the objects in the catalog of LINERs compiled by
Carrillo et al. (1999),
which has been the basis of several recent studies
(Satyapal, Sambruna & Dudik
2004;
Dudik et al. 2005;
González-Martín et
al. 2006),
suffer precisely from this
complication and should be used judiciously.
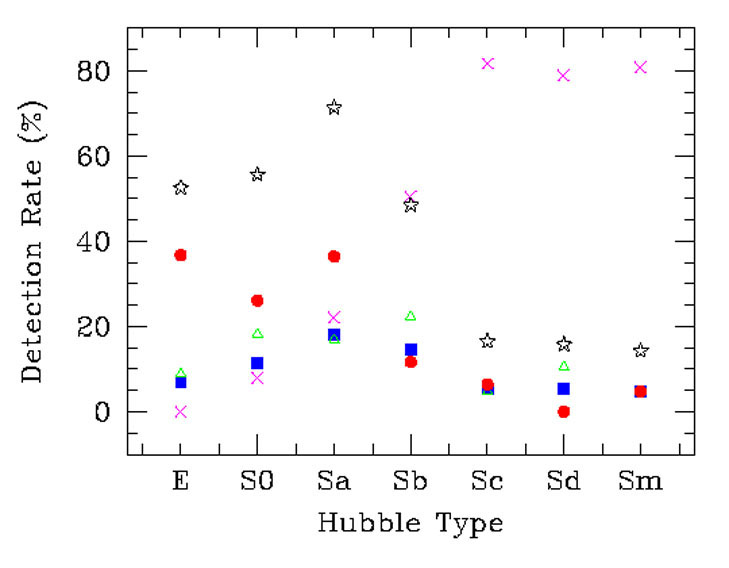
In qualitative agreement with early work, the Palomar survey shows that a substantial fraction (86%) of all galaxies contain detectable emission-line nuclei (Ho, Filippenko & Sargent 1997b). The detection rate is essentially 100% for all disk (S0 and spiral) galaxies, and > 50% for elliptical galaxies. One of the most surprising results is the large fraction of objects classified as AGNs or AGN candidates, as summarized in Figure 4. Summed over all Hubble types, 43% of all galaxies that fall in the survey limits can be considered "active." This percentage becomes even more remarkable for galaxies with an obvious bulge component, rising to ~ 50%-70% for Hubble types E-Sb. By contrast, the detection rate of AGNs drops dramatically toward later Hubble types (Sc and later), which almost invariably (80%) host H II nuclei. This strong dependence of nuclear spectral class on Hubble type has been noticed in earlier studies (Heckman 1980a; Keel 1983b), and further confirmed in SDSS (Kauffmann et al. 2003; Miller et al. 2003). A qualitatively similar conclusion, cast in terms of host galaxy stellar mass rather than Hubble type, is reached by Gallo et al. (2008) and Decarli et al. (2007). Decarli et al. also claim that the occurrence of AGN activity in Virgo cluster spirals does not depend on morphological type, but it must be noted that the sources of spectroscopy and nuclear classification employed in that study are very heterogeneous.
 |
 |
Figure 4. Left: Detection rate of emission-line nuclei as a function of Hubble type. The different classes of nuclei are marked as follows: Seyferts = blue squares, LINERs = red circles, transition objects = green triangles, LINERs + transition objects + Seyferts = black stars, H II nuclei = magenta crosses. Right: Distribution of bulge-to-total (B/T) light ratios, derived from the morphological type and its statistical dependence on B / T. The histograms have been shifted vertically for clarity. (Adapted from Ho, Filippenko & Sargent 1997a, 1997b.) |
|
Within the parent galaxy sample, 11% have Seyfert nuclei, at least doubling estimates based on older (Stauffer 1982b; Keel 1983b; Phillips, Charles & Baldwin 1983) or shallower (Huchra & Burg 1992; Maia, Machado & Willmer 2003; Gronwall et al. 2004; Hao et al. 2005a) surveys. LINERs constitute the dominant population of AGNs. "Pure" LINERs are present in ~20% of all galaxies, whereas transition objects, which by assumption also contain a LINER component, account for another ~ 13%. Thus, if all LINERs can be regarded as genuine AGNs (see Section 6), they truly are the most populous constituents, making up 1/3 of all galaxies and 2/3 of the AGN population (here taken to mean all objects classified as Seyferts, LINERs, and transition objects).
Within the magnitude range 14.5 < r < 17.7 in SDSS,
Kauffmann et al. (2003)
report an overall AGN fraction (for narrow-line
sources) of ~ 40%, of which ~10% are Seyferts. The rest are LINERs and
transition objects. Using a different method of starlight subtraction,
Hao et al. (2005b)
obtain very similar statistics for their sample of
Seyfert galaxies. Roughly 30% of the galaxies on the red sequence in
SDSS exhibit LINER-like emission
(Yan et al. 2006).
Although these
detection rates broadly resemble those of the Palomar survey, one should
recognize important differences between the two surveys. The Palomar
objects extend much farther down the luminosity function than the
SDSS. The emission-line detection limit of the Palomar survey, EW = 0.25
Å, is roughly 10 times fainter than the cutoff chosen by
Hao et al. (2005b).
The faint end of the Palomar
H luminosity function
reaches ~ 1 × 1037 ergs s-1
(Section 5.9), again a factor of
10 lower than the SDSS counterpart. Given that LINERs selected from SDSS
are highly susceptible to extranuclear contamination, as discussed
earlier, it is in fact quite surprising - and perhaps
fortuitous - that the detection rates of these objects agree so well
between the two surveys.
Broad emission lines, a defining attribute of classical Seyferts and
quasars, are also found in nuclei of much lower luminosities. The
well-known case of the nucleus of M81
(Peimbert &
Torres-Peimbert 1981;
Filippenko & Sargent
1988),
for example, has a broad (FWHM
3000 km
s-1) H line
with a luminosity of 2 × 1039 ergs s-1
(Ho, Filippenko & Sargent
1996),
and many other less conspicuous cases have been discovered in the
Palomar survey
(Ho et al. 1997e).
Searching for broad H
emission in nearby nuclei is nontrivial, because it entails measurement of a
(generally) weak, low-contrast, broad emission feature superposed on a
complicated stellar background. Thus, the importance of careful
starlight subtraction cannot be overemphasized. Moreover, even if this
could be accomplished perfectly, one still has to contend with
deblending the H + [N II]
complex. The narrow lines in this complex are often heavily blended
together, and rarely do the lines have simple profiles. The strategy
adopted by
Ho et al. (1997e)
is to use the empirical line profile of the
[S II] lines to model [N II] and the narrow component of
H. The case of NGC 3998 is shown in Figure 3.
Of the 221 emission-line nuclei in the Palomar survey classified as
LINERs, transition objects, and Seyferts, 33 (15%) definitely have broad
H and an additional 16
(7%) probably do. Questionable detections were found in another 8
objects (4%). Thus, approximately 20%-25% of all nearby AGNs are type 1
sources. These numbers, of course, should be regarded as lower limits,
since undoubtedly there must exist AGNs with even weaker broad-line
emission that fall below the detection threshold. Although the numbers
are meager, direct comparison with small-aperture Hubble Space
Telescope (HST) spectra (e.g.,
Nicholson et al. 1998;
Barth et al. 2001b;
Shields et al. 2007)
reveals that the Palomar statistics on
broad H detections seem
to be quite robust. The type 1.9 classification of almost every object
with overlapping HST data turns out to survive. More surprising
still, no new cases of broad H emission have turned up from HST observations. Given
the difficulty of measuring the weak broad H feature on top of the
dominant stellar continuum, it is likely that in general the line widths
may have been systematically underestimated from the ground-based
spectra. Circumstantial support for this conjecture comes from
Zhang, Dultzin-Hacyan &
Wang (2007),
who find that Palomar LLAGNs tend to
have smaller BH virial masses (estimated from the
H linewidth and a BLR
size-luminosity relation) than predicted from their bulge stellar
velocity dispersion. They conclude that the BLR size in LLAGNs may be
larger than normal given their luminosity, but an equally plausible
explanation is that the H
linewidths have been systematically underestimated.
It is illuminating to consider the incidence of broad
H emission as a function of
spectral class. Among objects formally classified as Seyferts, ~ 40% are
Seyfert 1s. The implied ratio of Seyfert 1s to Seyfert 2s (1:1.6) has
important consequences for some models concerning the evolution and
small-scale geometry of AGNs (e.g.,
Osterbrock & Shaw 1988).
Within the Palomar sample, nearly 25% of the "pure" LINERs have detectable
broad H emission. By
direct analogy with the historical nomenclature established for
Seyferts, LINERs can be divided into "type 1" and "type 2" sources
according to the presence or absence of broad-line emission,
respectively
(Ho, Filippenko & Sargent
1997a;
Ho et al. 1997e).
The detection rate of broad H, however, drops drastically for transition objects. The
cause for this dramatic change is unclear. In these objects the
broad-line component may simply be too weak to be detected in the
presence of substantial contamination from the H II region component, or
it may be intrinsically absent (Section 5.5,
6.5).
3.5. Robustness and Completeness
To gain confidence in the AGN statistics based on optical spectroscopy, one must have some handle on whether the existing AGN detections are trustworthy and whether there are many AGNs that have been missed. The robustness issue hinges on the question of whether the weak, nearby sources classified as AGNs are truly accretion-powered. As I argue in Section 6, this appears largely to be the case. The completeness issue can be examined in two regimes. Among galaxies with prominent bulges (Sbc and earlier), for which the spectroscopic AGN fractions are already very high (~ 50%-75%), there is not much room for a large fraction of missing AGNs, although it is almost certain that some have indeed eluded detection in the optical (e.g., Tzanavaris & Georgantopoulos 2007). The same does not necessarily hold for galaxies of Hubble types Sc and later. While the majority of these systems are spectroscopically classified as H II nuclei, one must be wary that weak AGNs, if present, may be masked by brighter off-nuclear H II regions or H II regions projected along the line of sight. After all, some very late-type galaxies do host bona fide AGNs (see Section 7).
The AGN content of late-type galaxies can independently be assessed by
using a diagnostic less prone to confusion by star-forming regions,
namely by looking for compact, nuclear radio or X-ray cores.
Ulvestad & Ho (2002)
performed a Very Large Array (VLA) survey for radio
cores in a distance-limited sample of 40 Palomar Sc galaxies classified
as hosting H II nuclei. To a sensitivity limit of
Prad
1018 - 1020 W Hz-1 at 5
GHz, and a resolution of

 = 1", they found
that none of the galaxies contains a compact radio core. The VLA
study of
Filho, Barthel & Ho
(2000)
also failed to detect radio
cores in a more heterogeneous sample of 12 H II nuclei.
= 1", they found
that none of the galaxies contains a compact radio core. The VLA
study of
Filho, Barthel & Ho
(2000)
also failed to detect radio
cores in a more heterogeneous sample of 12 H II nuclei.
Information on nuclear X-ray cores in late-type galaxies is much more
limited because to date there has been no systematic investigation of
these systems with Chandra. A few studies, however, have
exploited the High Resolution Imager (HRI) on ROSAT to resolve
the soft X-ray (0.5-2 keV) emission in late-type galaxies
(Colbert & Mushotzky 1999;
Lira, Lawrence & Johnson
2000;
Roberts & Warwick 2000).
Although the resolution of the HRI (~ 5'') is not
ideal, it is nonetheless quite effective for identifying point sources
given the relatively diffuse morphologies of late-type galaxies.
Compact X-ray sources, often quite luminous
( 1038
ergs s-1), are frequently found, but generally they do
not coincide with the galaxy nucleus; the nature of these
off-nuclear "ultraluminous X-ray sources" is discussed by
Fabbiano (2006).
1038
ergs s-1), are frequently found, but generally they do
not coincide with the galaxy nucleus; the nature of these
off-nuclear "ultraluminous X-ray sources" is discussed by
Fabbiano (2006).
To summarize: unless H II nuclei in late-type galaxies contain radio and X-ray cores far weaker than the current survey limits - a possibility worth exploring - they do not appear to conceal a significant population of undetected AGNs.
3 A distance scale based on H0 = 75 km s-1 Mpc-1 is assumed throughout. Back.