


5.1. Ionizing Continuum Radiation
AGNs, at least when unobscured, reveal themselves as pointlike nuclear
sources with power-law spectra at optical and UV wavelengths, typically
described by a continuum flux density
f

 , with
 -0.5 (e.g.,
Vanden Berk et al. 2001).
In unbeamed sources, this featureless continuum traces the
low-frequency tail of the "big blue bump"
(Shields 1978;
Malkan & Sargent 1982),
which supplies the bulk of the ionizing photons. This
feature is extremely difficult to detect in LLAGNs, both because the big
blue bump is weak or absent (Section 5.8) and because
the sources are
exceedingly faint. The optical nuclei of LINERs can have
MB
-0.5 (e.g.,
Vanden Berk et al. 2001).
In unbeamed sources, this featureless continuum traces the
low-frequency tail of the "big blue bump"
(Shields 1978;
Malkan & Sargent 1982),
which supplies the bulk of the ionizing photons. This
feature is extremely difficult to detect in LLAGNs, both because the big
blue bump is weak or absent (Section 5.8) and because
the sources are
exceedingly faint. The optical nuclei of LINERs can have
MB  -10 mag
(Ho 2004b),
at least 104 times fainter than their
(usually bulge-dominated) hosts (MB
-10 mag
(Ho 2004b),
at least 104 times fainter than their
(usually bulge-dominated) hosts (MB
 M*
-20 mag). To overcome
this contrast problem, searches for nuclear point sources in the optical
and near-IR have relied on HST images (e.g.,
Chiaberge, Capetti &
Celotti 1999;
Quillen et al. 2001;
Verdoes Kleijn et al. 2002;
Chiaberge, Capetti &
Macchetto 2005;
Balmaverde & Capetti 2006;
González-Martín et
al. 2006).
But resolution alone is not enough. Given the extreme
faintness of the nucleus, the intrinsic cuspiness of the underlying
bulge profile, complexities of the point-spread function, and the often
irregular background marred by circumnuclear dust features, one must pay
very close attention to how the measurements are made. Simple
aperture photometry or searching for central excess emission can yield
very misleading results. The most robust technique to extract faint
nuclei in the presence of these complications employs two-dimensional,
multi-component fitting
(Ho & Peng 2001;
Ravindranath et al. 2001;
Peng et al. 2002).
Using this method, nuclear sources with optical
magnitudes as faint as ~ 20 have been measured, with limits down to ~
22-23 mag possible for nearby galaxies. Due to the computational
requirements of two-dimensional fitting, however, not many LLAGNs have
yet been analyzed in this manner, and fewer still have enough
photometric points to define even a crude spectral slope.
M*
-20 mag). To overcome
this contrast problem, searches for nuclear point sources in the optical
and near-IR have relied on HST images (e.g.,
Chiaberge, Capetti &
Celotti 1999;
Quillen et al. 2001;
Verdoes Kleijn et al. 2002;
Chiaberge, Capetti &
Macchetto 2005;
Balmaverde & Capetti 2006;
González-Martín et
al. 2006).
But resolution alone is not enough. Given the extreme
faintness of the nucleus, the intrinsic cuspiness of the underlying
bulge profile, complexities of the point-spread function, and the often
irregular background marred by circumnuclear dust features, one must pay
very close attention to how the measurements are made. Simple
aperture photometry or searching for central excess emission can yield
very misleading results. The most robust technique to extract faint
nuclei in the presence of these complications employs two-dimensional,
multi-component fitting
(Ho & Peng 2001;
Ravindranath et al. 2001;
Peng et al. 2002).
Using this method, nuclear sources with optical
magnitudes as faint as ~ 20 have been measured, with limits down to ~
22-23 mag possible for nearby galaxies. Due to the computational
requirements of two-dimensional fitting, however, not many LLAGNs have
yet been analyzed in this manner, and fewer still have enough
photometric points to define even a crude spectral slope.
In a few cases, the optical featureless continuum has been detected
spectroscopically. From the ground, this was only possible for a couple of
the brightest sources. The stellar features of NGC 7213
(Halpern & Filippenko
1984)
and Pictor A
(Carswell et al. 1984;
Filippenko 1985)
show dilution by a featureless continuum, which can be described
approximately by a power law with a spectral index of
-1.5. The
nuclear continuum is much more readily seen in small-aperture spectra that
help to reject the bulge starlight. HST spectra have isolated the
optical continuum in several LINERs
(Ho, Filippenko & Sargent
1996;
Nicholson et al. 1998;
Ho et al. 2000;
Shields et al. 2000;
Barth et al. 2001a;
Sabra et al. 2003),
although in most objects it remains too faint to be detected
spectroscopically
(Sarzi et al. 2005).
In all well-studied cases, the optical continuum is quite steep, with
-1 to -2. This range
in spectral slopes is consistent with the broad-band optical
(Verdoes Kleijn et al. 2002)
and optical-UV colors
(Chiaberge et al. 2002)
of the cores frequently detected in the LINER nuclei of FR I radio galaxies.
The predominantly old population of present-day bulges ensures that the stellar contamination largely disappears in the UV, especially at high resolution. A number of attempts have been made to detect UV emission in LINERs using IUE, but most of these efforts yielded ambiguous results (see review in Filippenko 1996), and real progress had to await the HST. Two dedicated HST UV (~ 2300 Å) imaging studies have been completed. Using the pre-COSTAR FOC, Maoz et al. (1996) surveyed a complete sample of 110 large, nearby galaxies, and among the subset with spectral classifications from Palomar, Maoz et al. (1995) discovered that ~25% of the LINERs show an unresolved UV core. Barth et al. (1998) found similar statistics in a more targeted WFPC2 study. They also made the suggestion, later confirmed by Pogge et al. (2000), that dust obscuration is probably the main culprit for the nondetection of UV emission in the majority of LINERs. The implication is that UV emission is significantly more common in LINERs than indicated by the detection rates. In some type 2 objects (e.g., NGC 4569 and NGC 6500), the UV emission is spatially extended and presumably not related to the nuclear source. Second-epoch UV observations with the ACS/HRC revealed that nearly all of the UV-bright sources exhibit long-term variability (Maoz et al. 2005), an important result that helps assuage fears that the UV emission might arise mainly from young stars (Maoz et al. 1998). Importantly, both type 1 and type 2 LINERs vary. UV variability has also been discovered serendipitously in a few other sources (Renzini et al. 1995; O'Connell et al. 2005).
AGNs, no matter how weak, are almost never silent in the radio. Barring chance superposition with a supernova remnant, the presence of a compact radio core is therefore a good AGN indicator. Because of the expected faintness of the nuclei, however, any search for core emission must be conducted at high sensitivity, and arcsecond-scale angular resolution or better is generally needed to isolate the nucleus from the surrounding host, which emits copious diffuse synchrotron radiation. In practice, this requires an interferometer such as the VLA.
The prevalence of weak AGNs in nearby early-type galaxies has been
established from the VLA radio continuum studies of
Sadler, Jenkins & Kotanyi
(1989)
and Wrobel & Heeschen
(1991),
whose 5 GHz
surveys with 
 5" report a high
incidence (~ 30 - 40%) of
radio cores in complete, optical flux-limited samples of elliptical and
S0 galaxies. Interestingly, the radio detection rate is similar to the
detection rate of optical emission lines
(Figure 4), and the optical
counterparts of the radio cores are mostly classified as LINERs
(Phillips et al. 1986;
Ho 1999a).
Conversely,
Heckman (1980b)
showed that LINERs tend to be associated with compact radio sources. The
radio powers are quite modest, generally in the range of
1019 - 1021 W Hz-1 at 5 GHz. When
available, the spectral indices tend to be relatively flat (e.g.,
Wrobel 1991;
Slee et al. 1994).
With the exception of a handful of well-known
radio galaxies with extended jets
(Wrobel 1991),
most of the radio emission is centrally concentrated.
5" report a high
incidence (~ 30 - 40%) of
radio cores in complete, optical flux-limited samples of elliptical and
S0 galaxies. Interestingly, the radio detection rate is similar to the
detection rate of optical emission lines
(Figure 4), and the optical
counterparts of the radio cores are mostly classified as LINERs
(Phillips et al. 1986;
Ho 1999a).
Conversely,
Heckman (1980b)
showed that LINERs tend to be associated with compact radio sources. The
radio powers are quite modest, generally in the range of
1019 - 1021 W Hz-1 at 5 GHz. When
available, the spectral indices tend to be relatively flat (e.g.,
Wrobel 1991;
Slee et al. 1994).
With the exception of a handful of well-known
radio galaxies with extended jets
(Wrobel 1991),
most of the radio emission is centrally concentrated.
No comparable radio survey has been done for spiral galaxies. Over the
last few years, however, a number of studies, mostly using the VLA, have
systematically targeted sizable subsets of the Palomar galaxies, to the
point that by now effectively the entire Palomar AGN sample has been
surveyed at arcsecond
(
0.15" - 2.5") resolution
(Filho, Barthel & Ho
2000,
2002a,
2006;
Nagar et al. 2000,
2002;
Ho & Ulvestad 2001;
Filho et al. 2004;
Nagar, Falcke & Wilson
2005;
Krips et al. 2007).
Because the sensitivity, resolution, and observing
frequency varied from study to study, each concentrating on different
subclasses of objects, it is nontrivial to combine the literature
results. The only survey that samples a significant fraction of the
three LLAGN classes at a uniform sensitivity and resolution is that by
Nagar et al. (2000,
2002;
Nagar, Falcke & Wilson
2005),
which was conducted at 15 GHz and
=
0.15". The main drawback is that the sensitivity
of this survey (rms
0.2 mJy) is rather modest, and mJy-level sources can be missed if they
possess relatively steep spectra. Despite these limitations, Nagar et
al. detected a compact core, to a high level of completeness, in 44% of
the LINERs. Importantly, to the same level of completeness, the
Seyferts exhibit a very similar detection rate (47%). LINER 2s have a
lower detection rate than LINER 1s (38% versus 63%; see
Table 1), but
the same pattern is reflected almost exactly within the Seyfert
population (detection rate 30% for type 2s versus 72% for type
1s). Transition objects, on the other hand, clearly differ, showing a
markedly lower detection rate of only 16%, consistent with the 8.4 GHz
survey of Filho, Barthel & Ho
(2000,
2002a,
2006),
where the detection rate is ~ 25%. The statistical differences in the
Hubble type distributions of the three AGN classes
(Ho, Filippenko & Sargent
2003)
slightly complicate the interpretation of these results. To the
extent that radio power shows a mild dependence on bulge strength or BH
mass
(Nagar, Falcke & Wilson
2005;
see Ho 2002a),
the detection rates, strictly speaking, should be renormalized to
account for the
differences in morphological types among the three classes. This effect,
however, will not qualitatively change the central conclusion: if a
compact radio core guarantees AGN pedigree, then LINERs, of either type
1 or type 2, are just as AGN-like as Seyferts, whereas a significant
fraction of transition objects (roughly half) may be unrelated to AGNs.
| Spectral | LH |
LX | Prad | Lbol/LEdd | LX/LH |
log Ro | log RX | fb | fr | fx |
| Class | (ergs s-1) | (ergs s-1) | (W Hz-1) | (%) | (%) | (%) | ||||
| (1) | (2) | (3) | (4) | (5) | (6) | (7) | (8) | (9) | (10) | (11) |
| S1 | 1.9×1040 | 1.4×1041 | 8.5×10²⁰ | 1.1×10⁻³ | 7.3 | 0.7 | -3.8 | 52 | 72 | 100 |
| S2 | 1.7×1039 | 1.3×1039 | 8.5×10¹⁹ | 5.9×10⁻⁶ | 0.75 | 0.4 | -3.3 | … | 30 | 86 |
| L1 | 3.7×1039 | 8.8×1039 | 2.6×10²⁰ | 1.0×10⁻⁵ | 4.6 | 1.3 | -2.9 | 23 | 63 | 95 |
| L2 | 0.5×1039 | 1.2×1039 | 4.7×10¹⁹ | 4.8×10⁻⁶ | 1.6 | 0.8 | -2.9 | … | 38 | 74 |
| T | 0.7×1039 | 0.5×1039 | 2.4×10¹⁹ | 1.2×10⁻⁶ | 0.41 | 0.4 | -2.8 | 3 | 16 | 74 |
NOTE.- Column (1) Spectral class. (2)
Extinction-corrected luminosity of the H |
||||||||||
The detection rates from the Nagar et al. survey can be viewed as firm
lower limits. At = 1"
and rms = 0.04 mJy at 1.4 and 5 GHz, for example, the detection rate for
the Palomar Seyferts rises to 75%
(Ho & Ulvestad 2001).
Although no lower frequency survey of LINERs has been completed so far
(apart from the lower resolution studies of
Sadler, Jenkins, &
Kotanyi 1989
and
Wrobel & Heeschen 1991
confined to early-type galaxies), the preliminary study by
Van Dyk & Ho (1998)
of 29 LINERs at 5 and 3.6 GHz
( = 0.5"; rms = 0.05-0.1
mJy) yielded a
detection rate of over 80%, again suggesting that LINERs and Seyferts
have a comparably high incidence of radio cores.
Importantly, a sizable, flux-limit subset of the 15 GHz detections has
been reobserved with the Very Long Baseline Array at 5 GHz, and
essentially all of them have been detected at milliarcsecond
resolution
(Nagar, Falcke & Wilson
2005).
The high brightness
temperatures (
106 - 1011 K) leaves no doubt that the radio cores
are nonthermal and genuinely associated with AGN activity.
Where multifrequency data exist, their spectra tend to be flat or even
mildly inverted (
-0.2 to +0.2;
Ho et al. 1999b;
Falcke et al. 2000;
Nagar et al. 2000;
Nagar, Wilson & Falcke
2001;
Ulvestad & Ho 2001b;
Anderson, Ulvestad & Ho
2004;
Doi et al. 2005;
Krips et al. 2007),
seemingly more optically thick than
Seyferts (median = -0.4;
Ulvestad & Ho 2001a),
and variability on timescales of months is common
(Nagar et al. 2002;
Anderson & Ulvestad 2005).
Both of these characteristics suggest that the radio emission in LINERs is
mainly confined to a compact core or base of a jet. Seyfert galaxies
contain radio cores as well, but they are often accompanied by linear,
jetlike features resolved on arcsecond scales (e.g.,
Ulvestad & Wilson 1989;
Kukula et al. 1995;
Ho & Ulvestad 2001;
Gallimore et al. 2006).
This extended component appears to be less prevalent in
LINERs, although a definitive comparison must await a survey matched in
resolution, sensitivity, and wavelength with that performed for the
Seyferts
(Ho & Ulvestad 2001).
Higher resolution images on
milliarcsecond scales do resolve elongated structures akin to
subparsec-scale jets, but most of the power is concentrated in a
compact, high-brightness temperature core
(Bietenholz, Bartel & Rupen
2000;
Falcke et al. 2000;
Ulvestad & Ho 2001b;
Filho, Barthel & Ho
2002b;
Anderson, Ulvestad & Ho
2004;
Filho et al. 2004;
Krips et al. 2007).
The comprehensive summary presented in
Nagar, Falcke & Wilson
(2005)
indicates that the incidence of milliarcsecond-scale
radio cores is similar for LINERs and Seyferts, but that subparsec-scale
jets occur more frequently in LINERs.
X-ray observations provide another very effective tool to isolate LLAGNs and to diagnose their physical properties. Ultra-faint LLAGNs can be identified where none was previously known in the optical (e.g., Loewenstein et al. 2001; Ho, Terashima & Ulvestad 2003; Fabbiano et al. 2004; Pellegrini et al. 2007; Wrobel, Terashima & Ho 2008). Here, too, sensitivity and resolution are critical, as the central regions of galaxies contain a plethora of discrete nonnuclear sources, often suffused with a diffuse thermal plasma. Chandra, whose ACIS camera delivers ~ 0.5" images, is the instrument of choice, although in some instances even data at ~ 5" resolution (e.g., ROSAT HRI) can still provide meaningful constraints, especially if accompanied by spectral information (e.g., XMM-Newton).
As in the radio, no truly unbiased high-resolution X-ray survey has yet been performed of an optical flux-limited sample of nearby galaxies. The closest attempt was made by Roberts & Warwick (2000), who searched for X-ray nuclear sources in 83 Palomar galaxies (~ 20% of the total sample) having archival ROSAT HRI data. This subset is probably not unbiased, but it does encapsulate all the nuclear spectral classes in the Palomar survey. In total, X-ray cores were detected in 54% of the sample, with Seyferts and LINERs (including transition objects) both showing a higher detection rate (~ 70%) than absorption (30%) or H II nuclei (40%). The high detection rate among the optically classified LLAGNs agrees well with other ROSAT studies of Palomar sources (Koratkar et al. 1995; Komossa, Böhringer & Huchra 1999; Halderson et al. 2001; Roberts, Schurch & Warwick 2001), but the nonnegligible detection rate among the inactive members suggests that a significant fraction of the "core" flux may be nonnuclear emission [X-ray binaries (XRBs) and diffuse gas] insufficiently resolved by ROSAT.
Observations with Chandra (e.g., Ho et al. 2001; Eracleous et al. 2002) confirm the suspicion that earlier X-ray studies may have suffered from confusion with extranuclear sources (Figure 5). Importantly, the sharp resolution and low background noise of ACIS enable faint point sources to be detected with brief (few ks) exposures. This makes feasible, for the first time, X-ray surveys of large samples of galaxies selected at non-X-ray wavelengths. In a snapshot survey of a distance-limited sample of Palomar LLAGNs, Ho et al. (2001) find that ~ 75% of LINERs, both type 1 and type 2, contain X-ray cores, some as faint as ~ 1038 ergs s-1 in the 2-10 keV band. Terashima & Wilson (2003b) report an even higher detection rate (100%) for a sample of LINERs chosen for having a flat-spectrum radio core. To date, roughly 50% of the entire Palomar sample, among them 40% of the AGNs, have been observed by Chandra. This rich archival resource has been the basis of a number of recent investigations focused on quantifying the AGN content of LINERs, chief among them Satyapal, Sambruna & Dudik (2004), Dudik et al. (2005), Pellegrini (2005), Satyapal et al. (2005), Flohic et al. (2006), and González-Martín et al. (2006). A common conclusion that can be distilled from these studies is that the incidence of X-ray cores among LINERs is quite high, ranging from ~ 50% to 70%, down to luminosity limits of ~ 1038 ergs s-1. The incidence of X-ray cores in LINERs is somewhat lower than, but still compares favorably to, that found in Palomar Seyferts (~ 90%), the vast majority of which now have suitable X-ray observations, as summarized in Cappi et al. (2006) and Panessa et al. (2006). While the impact of selection biases cannot be assessed easily, they are probably not very severe because most of the observations were not originally intended to study LINERs, nor were they targeting famous X-ray sources.
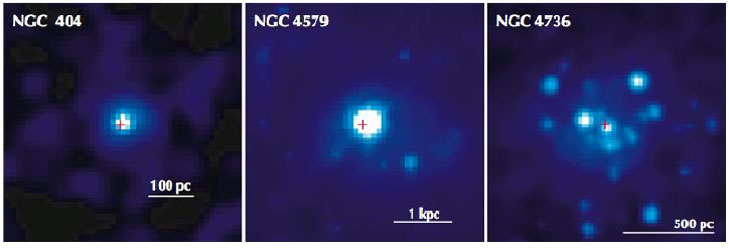 |
Figure 5. Chandra/ACIS images of three LLAGNs, illustrating the diversity and complexity of the X-ray morphologies of their circumnuclear regions. The cross marks the near-IR position of the nucleus. (Courtesy of H.M.L.G. Flohic and M. Eracleous.) |
It is of interest to ask whether the incidence of X-ray cores in LINERs
depends on the presence of broad
H emission. The
moderate-resolution ROSAT/HRI studies of
Roberts & Warwick (2000)
and Halderson et al. (2001)
showed roughly comparable detection rates for type 1 and type 2 LINERs,
suggesting that the two classes are intrinsically similar and that
obscuration plays a minor role in differentiating them. On the other
hand, detailed X-ray spectral analysis has raised the suspicion that
LINER 2s may be a highly heterogeneous class, with the bulk of the X-ray
emission possibly arising from stellar processes. An important caveat is
that these studies were based on large-beam observations, mostly using
ASCA
(Terashima, Ho & Ptak
2000;
Terashima et al. 2000a,
2002;
Roberts, Schurch & Warwick
2001)
and the rest using BeppoSAX
(Georgantopoulos et al. 2002;
Pellegrini et al. 2002).
A clearer, more consistent picture emerges from the recent Chandra
work cited above. Although the individual samples remain small, most
Chandra surveys detect LINER 2s with roughly similar frequency as
LINER 1s, ~ 50%-60%. To gain a more comprehensive census, I have
assembled Chandra measurements for all Palomar LINERs from the
literature, along with unpublished material for a significant number of
additional objects in public archives, which were analyzed following
Ho et al. (2001).
Although clearly heterogeneous and incomplete, the final
collection of 64 LINERs (20 type 1, 44 type 2) does constitute 70% of
the entire Palomar sample. The detection rate among all LINERs is 86%,
broken down into 95% for LINER 1s and 74% for LINER 2s. For
completeness, note that a similar exercise for 36 transition objects
(55% of the parent sample) yields a detection rate of 74%, identical to
that of LINER 2s and only marginally lower than that of Seyfert 2s (86%;
Table 1).
The X-ray spectral properties of LLAGNs, particularly LINERs, have most
thoroughly been investigated using ASCA
(Yaqoob et al. 1995;
Ishisaki et al. 1996;
Iyomoto et al. 1996,
1997,
1998a,
1998b;
Ptak et al. 1996,
1999;
Terashima et al. 1998a,
1998b,
2000a,
2000b,
2002;
Ho et al. 1999a;
Terashima, Ho & Ptak
2000;
Roberts, Schurch & Warwick
2001),
with important contributions from BeppoSAX
(Pellegrini et al. 2000a,
2000b,
2002;
Iyomoto et al. 2001;
Georgantopoulos et al. 2002;
Ptak et al. 2004).
A seminal study on M81 was done using BBXRT
(Petre et al. 1993).
Although the nuclear component was not
spatially isolated because of the poor angular resolution of these
telescopes, they had sufficient effective area to yield good photon
statistics over the energy range ~ 0.5-10 keV to spectrally
isolate the hard, power-law AGN signal. The most salient properties are
the following. (1) Over the region ~ 0.5-10 keV, the continuum can be
fit with a power law with an energy index of
-0.4 to -1.2. Although
this range overlaps with that seen in more luminous sources, the typical
value of ~ -0.8 in LLAGNs may be marginally flatter than in Seyfert 1s
(<> =
-0.87 ± 0.22;
Nandra et al. 1997b)
or radio-quiet quasars
(<> =
-0.93 ± 0.22;
Reeves & Turner 2000),
perhaps being more in line with radio-loud quasars
(< > = -0.6
± 0.16;
Reeves & Turner 2000).
(2) With a few notable exceptions (e.g., M51:
Fukazawa et al. 2001,
Terashima & Wilson 2003a;
NGC 1052:
Weaver et al. 1999,
Guainazzi et al. 2000;
NGC 4258:
Makishima et al. 1994,
Fiore et al. 2001;
NGC 4261:
Matsumoto et al. 2001),
the power-law component shows very little
intrinsic absorption. This trend conflicts with the tendency for the
degree of obscuration to increase with decreasing luminosity (e.g.,
Lawrence & Elvis 1982).
(3) Signatures of X-ray reprocessing by
material from an optically thick accretion disk, in the form of Fe
K emission or Compton
reflection
(Lightman & White 1988;
George & Fabian 1991),
are weak or absent; the weakness of the Fe
K line in LLAGNs runs
counter to the inverse correlation between iron line strength and
luminosity observed in higher luminosity AGNs
(Nandra et al. 1997b).
(4) In the few
cases where Fe K
emission has been detected, it is always narrow. (5) Apart from the hard
power law, most objects require an extra soft component at energies
 2 keV that can be fit
by a thermal plasma model with a temperature of kT
0.4-0.8 keV and
near-solar abundances. (6) Contrary to the trend established for
luminous sources
(Nandra et al. 1997a),
short-term, large-amplitude X-ray variability is rare in LLAGNs
(Ptak et al. 1998).
2 keV that can be fit
by a thermal plasma model with a temperature of kT
0.4-0.8 keV and
near-solar abundances. (6) Contrary to the trend established for
luminous sources
(Nandra et al. 1997a),
short-term, large-amplitude X-ray variability is rare in LLAGNs
(Ptak et al. 1998).
More recent observations with Chandra and XMM-Newton have
refined, but not qualitatively altered, the above results. Where
detailed spectral analysis is possible (e.g.,
Böhringer et al. 2001;
Kim & Fabbiano 2003;
Pellegrini et al. 2003a;
Terashima & Wilson 2003b;
Filho et al. 2004;
Page et al. 2004;
Starling et al. 2005;
Flohic et al. 2006;
González-Martín et
al. 2006;
Soria et al. 2006),
the hard power-law component (except in objects
previously known to be heavily absorbed) continues to be relatively
unabsorbed, even among many type 2 sources, and to show little signs of
reflection. No convincing case of a relativistic Fe
K line has yet surfaced
in an LLAGN. The marginally broad iron lines discovered with ASCA in
M81
(Ishisaki et al. 1996)
and NGC 4579
(Terashima et al. 1998a)
has now been resolved into multiple components
(Dewangan et al. 2004;
Page et al. 2004;
Young et al. 2007),
none of which can be associated with a
canonical disk. At the same time, the equivalent width limits for even
the narrow component have become impressively low (e.g.,
Ptak et al. 2004).
Interestingly, a soft thermal component is still required in
many objects (Section 5.4), but there is no evidence
for blackbody-like soft excess emission commonly seen in Seyferts and
quasars (e.g.,
Turner & Pounds 1989;
Inoue, Terashima & Ho
2007).
5.4. Circumnuclear Thermal Plasma
Early X-ray observations of LLAGNs using ASCA have consistently
revealed the presence of a diffuse, thermal component, typically with a
temperature of kT
0.5 keV
(Ptak et al. 1999;
Terashima et al. 2002).
The uniform analysis of ROSAT data by
Halderson et al. (2001)
concluded that ~ 80% of the Palomar sources contain an extended
component. However, without better resolution, it was impossible to know
the extent of confusion with point sources, how much of the gas is truly
associated with the nuclear region of the galaxy, or the density and
temperature profile of the gas.
Our view of the diffuse component in the nuclear region has been
dramatically sharpened with Chandra and XMM-Newton. Not
only has the near ubiquity of diffuse gas been confirmed in many nearby
galaxies
(Ho et al. 2001;
Eracleous et al. 2002;
Terashima & Wilson 2003b;
Pellegrini 2005;
Rinn, Sambruna & Gliozzi
2005;
Cappi et al. 2006;
González-Martín et
al. 2006;
Soria et al. 2006),
including our own
(Muno et al. 2004)
and our close neighbor M31
(Garcia et al. 2005),
but quantitative, statistical properties of the gas are now becoming
available. In the comprehensive investigation of 19 LINERs by
Flohic et al. (2006),
the diffuse emission, detected in 70% of the
sample, is concentrated within the central few hundred pc. With an
average 0.5-2 keV luminosity of ~ 1038 ergs s-1,
it accounts for more than half of the total central luminosity in most
cases. The average spectrum is similar to that seen in normal galaxies:
it can be described by a thermal plasma with kT = 0.5 keV plus a
power-law component with
= -0.3 to -0.5. I will return to the nature of the hard
component in Section 6.5. What is the origin
of the thermal plasma? Given what we know about the stellar populations
(Section 4.2), a
starburst origin, as suggested by
González-Martín et
al. (2006),
seems improbable. In normal elliptical galaxies, the
X-ray-emitting gas represents the repository of thermalized
stellar ejecta generated from mass loss from evolved stars and Type Ia
supernovae (e.g.,
Awaki et al. 1994).
There is no reason not to adopt
the same picture to explain the hot plasma in LINERs and other
LLAGNs. High-resolution X-ray spectroscopy of the highly ionized gas
around the nucleus of M81
(Page et al. 2003;
Young et al. 2007)
and NGC 7213
(Starling et al. 2005)
reveals that the plasma is collisionally
ionized. Starling et al. note that this may be a property unique to
LINERs, as thermal gas in luminous Seyferts is usually photoionized
rather than collisionally ionized (e.g.,
Kinkhabwala et al. 2002).
Luminous, unobscured AGNs distinguish themselves unambiguously by their
characteristic broad permitted lines. The detection of broad
H emission in ~ 25% of
LINERs
(Ho et al. 1997e)
thus constitutes strong evidence in favor of
the AGN interpretation of these sources. LINERs, like Seyferts, come in
two flavors - some have a visible BLR (type 1), and others do not
(type 2). The broad component becomes progressively more difficult to
detect in ground-based spectra for permitted lines weaker than
H. However, HST
spectra
of LINERs, when available, show broad higher-order Balmer lines as well
as UV lines such as Ly,
C IV  1549, Mg II
2800, and Fe II multiplets
(Barth et al. 1996;
Ho, Filippenko & Sargent
1996).
A subset of LINERs contain broad lines with
double-peaked profiles (Figure 6),
analogous to those seen in a minority of radio galaxies
(Eracleous & Halpern
1994),
where they are often interpreted as a kinematic signature of a
relativistic accretion disk
(Chen & Halpern 1989).
Most of the nearby cases have
been discovered serendipitously, either as a result of the broad
component being variable (NGC 1097:
Storchi-Bergmann, Baldwin &
Wilson 1993;
M81:
Bower et al. 1996;
NGC 3065:
Eracleous & Halpern 2001)
or because of the increased sensitivity to weak, broad features
afforded by small-aperture measurements made with HST (NGC 4450:
Ho et al. 2000;
NGC 4203:
Shields et al. 2000;
NGC 4579:
Barth et al. 2001a).
Double-peaked broad-line AGNs may be more common than
previously thought, especially among LLAGNs, perhaps as a consequence of
their accretion disk structure (Section 8).
1549, Mg II
2800, and Fe II multiplets
(Barth et al. 1996;
Ho, Filippenko & Sargent
1996).
A subset of LINERs contain broad lines with
double-peaked profiles (Figure 6),
analogous to those seen in a minority of radio galaxies
(Eracleous & Halpern
1994),
where they are often interpreted as a kinematic signature of a
relativistic accretion disk
(Chen & Halpern 1989).
Most of the nearby cases have
been discovered serendipitously, either as a result of the broad
component being variable (NGC 1097:
Storchi-Bergmann, Baldwin &
Wilson 1993;
M81:
Bower et al. 1996;
NGC 3065:
Eracleous & Halpern 2001)
or because of the increased sensitivity to weak, broad features
afforded by small-aperture measurements made with HST (NGC 4450:
Ho et al. 2000;
NGC 4203:
Shields et al. 2000;
NGC 4579:
Barth et al. 2001a).
Double-peaked broad-line AGNs may be more common than
previously thought, especially among LLAGNs, perhaps as a consequence of
their accretion disk structure (Section 8).
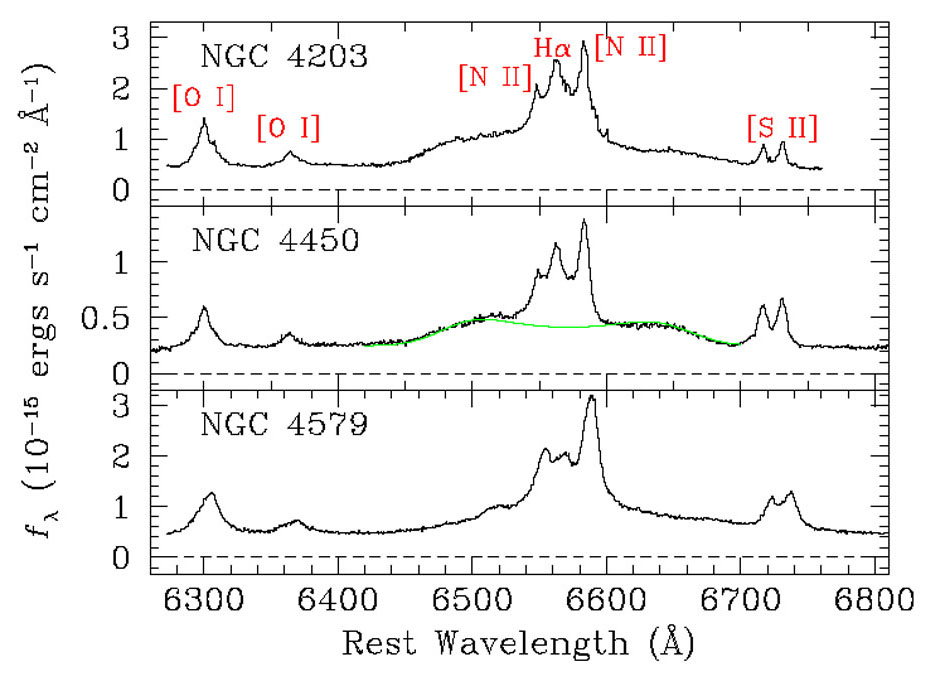 |
Figure 6. LINERs with broad, double-peaked
H |
A pressing question, however, is: What fraction of the more numerous
LINER 2s are AGNs? By analogy with the Seyfert 2 class, do LINER 2s
contain a hidden LINER 1 nucleus? At first sight, it might seem that
there is no a priori reason why the orientation-dependent
unification model, which has enjoyed much success in the context of
Seyfert galaxies, should not apply equally to LINERs. If we suppose that
the ratio of LINER 2s to LINER 1s is similar to the ratio of Seyfert 2s
to Seyfert 1s - 1.6:1 in the Palomar survey - we can reasonably
surmise that the AGN fraction in LINERs may be as high as ~ 60%. That at
least some LINERs do indeed contain a hidden BLR was demonstrated
by the deep Keck spectropolarimetric observations of Barth, Filippenko
& Moran
(1999a,
1999b).
In a survey of 14 LLAGNs, mostly LINERs, these authors detected broad
H emission in three
objects (~ 20%) polarized at a level of 1%-3%. Interestingly, all three
objects are elliptical galaxies with double-sided radio jets. NGC 315 and NGC 1052 technically qualify as type 1.9 LINERs
(Ho et al. 1997e),
whereas NGC 4261 is a LINER
2. Although the sample is small, these observations prove two important
points: (1) the weak broad
H features detected in
direct light is not always scattered emission
(Antonucci 1993),
since polarized emission was not detected in
several other LINER 1.9s included in Barth, Filippenko & Moran's
survey; (2) an obscured nucleus does lurk in some LINER 2s.
At the same time, other bright LINER 2s have resisted detection by spectropolarimetry. As in the case of Seyferts (Tran 2001), however, the nondetection of polarized broad lines does not necessarily imply that there is no hidden BLR. Nevertheless, the BLR in some type 2 AGNs, especially LINERs but also Seyferts, may be intrinsically absent, not obscured. In the case of some Seyferts, mostly weak sources, the evidence comes from low absorbing X-ray column densities (Bassani et al. 1999; Pappa et al. 2001; Panessa & Bassani 2002; Gliozzi et al. 2004; Cappi et al. 2006; Gliozzi, Sambruna & Foschini 2007; Bianchi et al. 2008; but see Ghosh et al. 2007) as well as optical variability (Hawkins 2004). LINERs, as a class, very much conform to this picture. As discussed further below, LINERs of either type generally show very little sign of absorbing or reprocessing material, and UV variability is common. A few exceptions exist (e.g., NGC 1052: Guainazzi et al. 2000; NGC 4261: Sambruna et al. 2003, Zezas et al. 2005), but, interestingly, these are precisely the very ones for which Barth, Filippenko, & Moran discovered hidden BLRs. NGC 4258, also highly absorbed in the X-rays (Fiore et al. 2001), shows polarized narrow lines rather than broad lines (Barth et al. 1999).
An excellent of a LINER with a naked type 2 nucleus is the
Sombrero galaxy. Although clearly an AGN, it shows
no trace of a broad-line component, neither in direct light
(Ho et al. 1997e),
not even when very well isolated with a small HST aperture
(Nicholson et al. 1998),
nor in polarized light
(Barth, Filippenko & Moran
1999b).
Its Balmer
decrement indicates little reddening to the NLR. For all practical
purposes, the continuum emission from the nucleus looks unobscured. It
is detected as a variable UV source
(Maoz et al. 1995,
2005)
and in the soft and hard X-rays
(Nicholson et al. 1998;
Ho et al. 2001).
The X-ray spectrum is only very mildly absorbed
(Nicholson et al. 1998;
Pellegrini et al. 2002,
2003a;
Terashima et al. 2002),
with no signs of
Fe K emission expected
from reprocessed material, consistent with the modest mid-IR emission
reported by
Bendo et al. (2006).
In short, there is no sign of anything being hidden or much doing the
hiding. So where is the BLR? It is just not there.
The lack of a BLR in very low-luminosity sources may be related to a
physical upper limit in the broad-line width
(Laor 2003).
If LLAGNs obey the same BLR-luminosity relation as in higher luminosity
systems, their BLR velocity depends on the BH mass and luminosity. At a
limiting bolometric luminosity of Lbol
1041.8
(MBH / 108
M )2 ergs s-1,
v
25,000 km
s-1, above which clouds may not
survive due to excessive shear or tidal forces. Alternatively, if BLR
clouds arise from condensations in a radiation-driven, outflowing wind
(Murray & Chiang 1997),
a viewpoint now much espoused, then it is
reasonable to expect that very low-luminosity sources would be incapable
of generating a wind, and hence of sustaining a BLR. For example, the
clumpy torus model of
Elitzur & Shlosman (2006)
predicts that the
BLR can no longer be sustained for Lbol
1042 ergs
s-1. In the scenario of
Nicastro (2000),
the BLR originates
from a disk outflow formed at the transition radius between regions
dominated by gas and radiation pressure. As this radius shrinks with
decreasing Lbol / LEdd,
where LEdd = 1.3 × 1038
(MBH /
M) ergs
s-1, the BLR is expected to disappear for
Lbol / LEdd
10-3. The
apparent correlation between BLR line width and
Lbol / LEdd
qualitatively supports this picture
(Xu & Cao 2007).
Although the
existing data are sparse, they indicate that LINERs generally lack UV
resonance absorption features indicative of nuclear outflows
(Shields et al. 2002).
The models by Elitzur & Shlosman and Nicastro are
probably correct in spirit but not in detail, because many of the
Palomar LLAGNs plainly violate their proposed thresholds
(Section 5.10).
)2 ergs s-1,
v
25,000 km
s-1, above which clouds may not
survive due to excessive shear or tidal forces. Alternatively, if BLR
clouds arise from condensations in a radiation-driven, outflowing wind
(Murray & Chiang 1997),
a viewpoint now much espoused, then it is
reasonable to expect that very low-luminosity sources would be incapable
of generating a wind, and hence of sustaining a BLR. For example, the
clumpy torus model of
Elitzur & Shlosman (2006)
predicts that the
BLR can no longer be sustained for Lbol
1042 ergs
s-1. In the scenario of
Nicastro (2000),
the BLR originates
from a disk outflow formed at the transition radius between regions
dominated by gas and radiation pressure. As this radius shrinks with
decreasing Lbol / LEdd,
where LEdd = 1.3 × 1038
(MBH /
M) ergs
s-1, the BLR is expected to disappear for
Lbol / LEdd
10-3. The
apparent correlation between BLR line width and
Lbol / LEdd
qualitatively supports this picture
(Xu & Cao 2007).
Although the
existing data are sparse, they indicate that LINERs generally lack UV
resonance absorption features indicative of nuclear outflows
(Shields et al. 2002).
The models by Elitzur & Shlosman and Nicastro are
probably correct in spirit but not in detail, because many of the
Palomar LLAGNs plainly violate their proposed thresholds
(Section 5.10).
Nonetheless, the statistics within the Palomar survey already provide
tentative support to the thesis that the BLR vanishes at the lowest
luminosities or Eddington ratios. Which of the two is the controlling
variable is still difficult to say. For both Seyferts and LINERs, type 1
sources are almost a factor of 10 more luminous than type 2 sources in
terms of their median total
H luminosity
(Table 1). (The statistical differences between
type 1 and type 2 sources cannot be ascribed to sensitivity differences
in the detectability of broad
H emission. Type 1
objects do have stronger line emission
compared to the type 2s, but on average their narrow
H flux and equivalent width
are only ~ 50% higher, and the two types overlap
significantly. Moreover, as noted in
Section 3.4, the broad
H detection rates turn
out to be quite robust even in light of the much higher sensitivity
afforded by
HST.) The differences persist after normalizing by the Eddington
luminosities: adopting a bolometric correction of Lbol
16
LX,
Lbol / LEdd = 1.1 × 10⁻³
and 5.9 × 10⁻⁶ for Seyfert 1s and Seyfert 2s,
respectively, whereas the corresponding values for LINER 1s and LINER 2s
are 1.0 × 10⁻⁵ and 4.8 × 10⁻⁶. Two
caveats are in order. First, while most of the type 1 sources have X-ray
data, only 60% of the LINER 2s and 70% of the Seyfert 2s do. Second, the
X-ray luminosities, which pertain to the 2-10 keV band, have been
corrected for intrinsic absorption whenever possible, but many sources
are too faint for spectral analysis. The lower X-ray luminosities for
the type 2 sources must be partly due to absorption, but considering the
generally low absorbing columns, particularly among the LINERs
(Georgantopoulous et
al. 2002;
Terashima et al. 2002),
it is unclear if
absorption alone can erase the statistical difference between the two
types. The tendency for Seyfert 2s to have lower Eddington ratios than
Seyfert 1s has previously been noted, for the Palomar sample
(Panessa et al. 2006)
and others
(Middleton, Done & Schurch
2008).
Several authors have raised the suspicion that LINER 2s may not be
accretion-powered. Large-aperture X-ray spectra of LINER 2s, like those of
LINER 1s, can be fit with a soft thermal component plus a power law with
-0.7 to -1.5
(Georgantopoulos et al. 2002;
Terashima et al. 2002).
But this alone does not provide enough leverage to distinguish AGNs from
starburst galaxies, many of which look qualitatively similar over the
limited energy range covered by these observations. We cannot turn to
the iron K
line or variability for guidance, because LLAGNs generally exhibit neither
(Section 5.3). The hard X-ray emission in LINER 2s is
partly extended
(Terashima et al. 2000a>;
Georgantopoulos et al. 2002),
but the implications of this finding are unclear. Just because the X-ray
emission surrounding the LLAGN is morphologically complex and there is
evidence for circumnuclear star formation (e.g., NGC 4736;
Pellegrini et al. 2002)
does not necessarily imply that there is a causal connection between the
starburst and the LLAGN.
Roberts, Schurch & Warwick
(2001)
advocate a starburst connection from the observation that
LINER 2s have a mean flux ratio in the soft and hard X-ray band (~ 0.7)
similar to that found in NGC 253. This interpretation, however, conflicts
with the stellar population constraints discussed in
Section 4.2. It is also not
unique. Luminous, AGN-dominated type 1 sources themselves exhibit a tight
correlation between soft and hard X-ray luminosity, with a ratio not
dissimilar from the quoted value
(Miniutti et al. 2008).
An important clue comes from the fact that many LINER 2s have a lower
LX /
LH
ratio than LINER 1s
(Ho et al. 2001).
In particular, the observed X-ray luminosity from the
nucleus, when extrapolated to the UV, does not have enough ionizing
photons to power the H
emission
(Terashima et al. 2000a).
This implies that (1) the X-rays are
heavily absorbed, (2) nonnuclear processes power much of the optical
line emission, or (3) the ionizing SED is different than assumed. As
discussed in Section 6.4, this energy budget
discrepancy appears to be
symptomatic of all LLAGNs in general, not just LINER 2s, and most likely
results from a combination of the second and third effect. There are
some indications that the SEDs of LINER 2s indeed differ systematically
from those of LINER 1s (e.g.,
Maoz et al. 2005;
Sturm et al. 2006).
In light of the evidence given in Sections 5.3,
< ahref="#5.6">5.6, I consider the first
solution to be no longer tenable. One can point to objects such as
NGC 4261
(Zezas et al. 2005)
as examples of LINER 2s with strong obscuration, but such cases are rare.
From the point of view of BH demographics, the most pressing issue is what fraction of the LINER 2s should be included in the AGN tally. Some cases are beyond dispute (M84, M87, Sombrero). What about the rest? The strongest argument that the majority of LINER 2s are AGN-related comes from the detection frequency of radio (Section 5.2) and X-ray (Section 5.3) cores, which is roughly 60% of that of LINER 1s. On the other hand, the detection rate of Seyfert 2s are similarly lower compared to Seyfert 1s, most likely reflecting the overall reduction of nuclear emission across all bands in type 2 LLAGNs as a consequence of their lower accretion rates. In summary, the AGN fraction among LINER 2s is at least 60%, and possibly as high as 100%.
In line with the absence of a BLR discussed above and using very much the
same set of evidence, a convincing case can be made that the torus also
disappears at very low luminosities. In a large fraction of nearby LINERs,
the low absorbing column densities and weak or undetected Fe
K emission
(Section 5.3) strongly indicate that we have a
direct, unobstructed view of the nucleus.
Ghosh et al. (2007)
warn that absorbing columns can be underestimated
in the presence of extended soft emission, especially when working with
spectra of low signal-to-noise ratio. While this bias no doubt enters at
some level, cases like the Sombrero (Section 5.3)
cannot be so readily dismissed. By analogy with situation in luminous
AGNs (e.g.,
Inoue, Terashima & Ho
2007;
Nandra et al. 2007),
type 1 LLAGNs, if they possess tori, should also show
strong, narrow fluorescent Fe
K emission. This
expectation is not borne out by observations. NGC 3998, which has excellent X-ray data, offers
perhaps the most dramatic example. Apart from showing no signs
whatsoever for intrinsic photoelectric absorption, it also possesses one
of the tightest upper limits to date on Fe
K emission: EW < 25 eV
(Ptak et al. 2004).
Our sight line to the nucleus is as clean as a whistle.
Satyapal, Sambruna & Dudik
(2004)
claim that many LINERs have obscured nuclei, but
this conclusion is based on IR-bright, dusty objects chosen from
Carrillo et al. (1999);
as I have discussed in Section 3.2, I regard
these objects not only as
biased, but also confusing with respect to their nuclear properties.
Palomar Seyferts, whose luminosities and Eddington ratios are about an
order of magnitude higher than those of LINERs
(Section 5.10), show
markedly larger absorbing column densities and stronger Fe
K lines. In an
XMM-Newton study of a distance-limited sample of 27 Palomar
Seyferts,
Cappi et al. (2006)
detect strong Fe
K emission in over half of
objects. The distribution of absorbing columns is nearly continuous,
from NH
1020 to
1025 cm-2,
with 30%-50% of the type 2 sources being Compton-thick
(Panessa et al. 2006).
This seems consistent with the tendency for Seyferts to be
more gas-rich than LINERs, to the extent that this is reflected in their
higher NLR densities
(Ho, Filippenko & Sargent
2003).
The trend of increasing absorption with increasing luminosity or
Eddington ratio observed in Palomar LLAGNs has an interesting parallel
among radio galaxies. A substantial body of recent work indicates that
the nuclei of FR I sources, most of which are, in fact, LINERs, are
largely unobscured (e.g.,
Chiaberge, Capetti &
Celotti 1999;
Donato, Sambruna & Gliozzi
2004;
Balmaverde & Capetti
2006).
In contrast, FR II systems, especially those with broad or high-excitation
lines (analogs of Seyferts), show clear signs of absorption and Fe
K emission
(Evans et al. 2006).
Even if we are fooled by the X-ray observations, substantial absorption must result in strong thermal reemission of "waste heat" in the IR. While sources such as Cen A provide a clear reminder that every rule has its exception (Whysong & Antonucci 2004), the existing data do suggest that, as a class, FR I radio galaxies tend to be weak mid-IR or far-IR sources (Haas et al. 2004; Müller et al. 2004). The same holds for more nearby LINERs. Their SEDs do show a pronounced mid-IR peak (Section 5.8), but as I will argue later, it is due to emission from the accretion flow rather than from dust reemission.
5.7. Narrow-line Region Kinematics
The kinematics of the NLR are complex. At the smallest scales probed by HST, Verdoes Kleijn, van der Marel & Noel-Storr (2006) find that the velocity widths of the ionized gas in the LINER nuclei of early-type galaxies can be modeled as unresolved rotation of a thin disk in the gravitational potential of the central BH. The subset of objects with FR I radio morphologies, on the other hand, exhibit line broadening in excess of that expected from purely gravitational motions; these authors surmise that the super-virial motions may be related to an extra source of energy injection by the radio jet. Walsh et al. (2008) use multiple-slit STIS observations to map the kinematics of the inner ~ 100 pc of the NLR in a sample of 14 LLAGNs, mostly LINERs. Consistent with earlier findings (Ho et al. 2002; Atkinson et al. 2005), the velocity fields are generally quite disorganized, rarely showing clean signatures of dynamically cold disks undergoing circular rotation. Nevertheless, two interesting trends can be discerned. The emission line widths tend to be largest within the sphere of influence of the BH, progressively decreasing toward large radii to values that roughly match the stellar velocity dispersion of the bulge. The luminous members of the sample, on the other hand, show more chaotic kinematics, as evidenced by large velocity splittings and asymmetric line profiles, reminiscent of the pattern observed by Rice et al. (2006) in their sample of Seyfert galaxies. Walsh et al. suggest that above a certain luminosity threshold - one that perhaps coincides with the LINER/Seyfert division - AGN outflows and radio jets strongly perturb the kinematics of the NLR.
A large fraction (~ 90%) of the Palomar LLAGNs have robust measurements
of integrated
[N II] 6583 line
widths, which enable a crude
assessment of the dynamical state of the NLR and its relation to the
bulge. Consistent with what has been established for more powerful
systems
(Nelson & Whittle 1996;
Greene & Ho 2005a),
the kinematics of the ionized gas are dominated by random motions that, to
first order, trace the gravitational potential of the stars in the
bulge. Among the objects with available central stellar velocity
dispersions,
 NLR /
*
0.7-0.8 for the weakest
sources
(LH
1038 ergs s-1), systematically rising to
NLR
/ *
1.2 in the more luminous
members
(LH
1041.5 ergs s-1). L.C. Ho (in preparation)
speculates that the central AGN injects a source of dynamical heating of
nongravitational origin to the NLR, either in the form of radiation
pressure from the central continuum or mechanical interaction from radio
jets. Given the empirical correlation between optical line luminosity
and radio power (e.g.,
Ho & Peng 2001;
Ulvestad & Ho 2001a;
Nagar, Falcke & Wilson
2005),
and the near ubiquity of compact radio
sources, it is a priori difficult to determine which of these two
sources acts as the primary driver. The tendency for extended radio
emission to be more prevalent in Seyferts (Section 5.2)
suggests that jets may be more important.
NLR /
*
0.7-0.8 for the weakest
sources
(LH
1038 ergs s-1), systematically rising to
NLR
/ *
1.2 in the more luminous
members
(LH
1041.5 ergs s-1). L.C. Ho (in preparation)
speculates that the central AGN injects a source of dynamical heating of
nongravitational origin to the NLR, either in the form of radiation
pressure from the central continuum or mechanical interaction from radio
jets. Given the empirical correlation between optical line luminosity
and radio power (e.g.,
Ho & Peng 2001;
Ulvestad & Ho 2001a;
Nagar, Falcke & Wilson
2005),
and the near ubiquity of compact radio
sources, it is a priori difficult to determine which of these two
sources acts as the primary driver. The tendency for extended radio
emission to be more prevalent in Seyferts (Section 5.2)
suggests that jets may be more important.
5.8. Spectral Energy Distribution
The broad-band SED provides one of the most fundamental probes of the physical processes in AGNs. Both thermal and nonthermal emission contribute to the broad-band spectrum of luminous AGNs such as quasars and classical Seyfert galaxies. In objects whose intrinsic spectrum has not been modified severely by relativistic beaming or absorption, the SED can be separated into several distinctive components (e.g., Elvis et al. 1994): radio synchrotron emission from a jet, which may be strong ("radio-loud") or weak ("radio-quiet"); an IR excess, now generally considered to be predominantly thermal reradiation by dust grains; a prominent optical to UV "big blue bump," usually interpreted to be pseudo-blackbody emission from an optically thick, geometrically thin accretion disk (Shields 1978; Malkan & Sargent 1982); a soft X-ray excess, whose origin is still highly controversial (Done et al. 2007; Miniutti et al. 2008); and an underlying power law, which is most conspicuous at hard X-ray energies but is thought to extend down to IR wavelengths, that can be attributed to Comptonization of softer seed photons.
Within this backdrop, there were already early indications that the SEDs
of LINERs may deviate from the canonical form.
Halpern & Filippenko
(1984)
succeeded in detecting the featureless optical continuum in
NGC 7213, and while these authors suggested that a
big blue bump may be
present in this object, they also noted that it possesses an
exceptionally high X-ray-to-optical flux ratio, although
perhaps one not inconsistent with the extrapolation of the trend of
increasing X-ray-to-optical flux ratio with decreasing
luminosity seen in luminous sources
(Zamorani et al. 1981;
Avni & Tananbaum 1982).
A more explicit suggestion that LINERs may possess a
weak UV continuum was made in the context of double-peaked broad-line
AGNs such as Arp 102B and Pictor A, whose narrow-line spectra share many
characteristics with LINERs
(Chen & Halpern 1989;
Halpern & Eracleous
1994).
The HST spectrum of Arp 102B, in fact, shows an
exceptionally steep optical-UV nonstellar continuum
(
-2.1 to -2.4;
Halpern et al. 1996).
Halpern & Eracleous
(1994)
further suggested that the
SEDs are flat in the far-IR. In an important study of M81,
Petre et al. (1993)
proposed that the relative weakness of the UV continuum
compared to the X-rays is a consequence of a change in the structure of
the central accretion flow, from a standard thin disk to an
ion-supported torus (see Section 8.3).
Parameterizing the two-point spectral index between 2500 Å and 2 keV by
ox
 [logL(2500 Å) - logL(2 keV)] /
[log(2500 Å) -
log(2 keV)],
M81 and possibly other LINERs
(Mushotzky 1993)
have ox
-1, to be compared with
ox
-1.4 for quasars and
ox
-1.2 for Seyferts
(Mushotzky & Wandel
1989).
[logL(2500 Å) - logL(2 keV)] /
[log(2500 Å) -
log(2 keV)],
M81 and possibly other LINERs
(Mushotzky 1993)
have ox
-1, to be compared with
ox
-1.4 for quasars and
ox
-1.2 for Seyferts
(Mushotzky & Wandel
1989).
The full scope of the spectral uniqueness of LLAGNs only became evident
once the modern, albeit still fragmentary, multiwavelength data could be
assembled. The initial studies concentrated on individual objects,
emphasizing the weakness of the UV bump (M81:
Ho, Filippenko & Sargent
1996;
Sombrero:
Nicholson et al. 1998)
and the overall consistency of the SED with spectral models generated
from advection-dominated accretion flows (ADAFs; see
Narayan 2002 and
Yuan 2007
for reviews) as unique attributes of systems with low Eddington
ratios (NGC 4258:
Lasota et al. 1996,
Chary et al. 2000;
M87:
Reynolds et al. 1996;
M60:
Di Matteo & Fabian 1997).
Ho (1999b)
systematically investigated the SEDs of a small sample of seven LLAGNs
with available BH mass estimates and reliable small-aperture fluxes from
radio to X-ray wavelengths. This was followed by a study of another five
similar objects, which have the additional distinction of having
double-peaked broad emission lines
(Ho et al. 2000;
Ho 2002b).
Figure 7
gives the latest update from a comprehensive analysis of the SEDs of 150
nearby type 1 AGNs spanning 4 dex in BH mass (MBH
105-109
M) and
6.5 dex in Eddington ratio (Lbol / LEdd
10-6 -
100.5). Let us focus on two regimes:
Lbol / LEdd = 0.1 to 1, typical of
classical, luminous AGNs, and
Lbol / LEdd < 10-3.0,
which characterizes most nearby LLAGNs
(Section 5.10). I defer the
discussion of the physical implications until
Section 8, but for now
list the most notable features concerning the LLAGN SED, some of which
are also apparent in the composite LINER SED assembled by
Eracleous, Hwang & Flohic
(2008a).
(1) The big blue bump is conspicuously
absent. (2) Instead, a broad excess is shifted to the mid-IR, forming a
"big red bump"; this component is probably related to the mid-IR excess
previously noted by
Lawrence et al. (1985),
Willner et al. (1985),
and
Chen & Halpern (1989),
and more recently from Spitzer observations (e.g.,
Willner et al. 2004;
Bendo et al. 2006;
Gu et al. 2007).
(3) As a consequence of this shift, the optical-UV slope is
exceptionally steep, generally in the range
ou
-1 to -2.5, to be
compared with
ou
-0.5 to -0.7 for
luminous AGNs
(Vanden Berk et al. 2001;
Shang et al. 2005);
the X-ray-to-optical ratio is large, resulting in
ox
-1. (4) There is no evidence for a soft X-ray excess. (5) Lastly, the
overall SED can be considered radio-loud, defined here by the convention
that the radio-to-optical luminosity ratio exceeds a value of
Ro
L(5 GHz) / L(B) = 10.
Radio-loudness, in fact, seems to be a property common to essentially
all nearby weakly active nuclei
(Ho 1999b,
2002a;
Ho et al. 2000)
and a substantial fraction of Seyfert nuclei
(Ho & Peng 2001).
Defining radio-loudness based on the relative strength of the
radio and X-ray emission, RX
L(5 GHz)/
LX,
Terashima & Wilson
(2003b)
also find that
LINERs tend to be radio-loud, here taken to be RX >
10-4.5. Moreover, the degree of radio-loudness scales
inversely with Lbol / LEdd
(Ho 2002a;
Terashima & Wilson 2003b;
Wang, Luo & Ho 2004;
Greene, Ho & Ulvestad
2006;
Panessa et al. 2007;
Sikora, Stawarz & Lasota
2007;
L.C. Ho, in preparation; see Figure 10b).
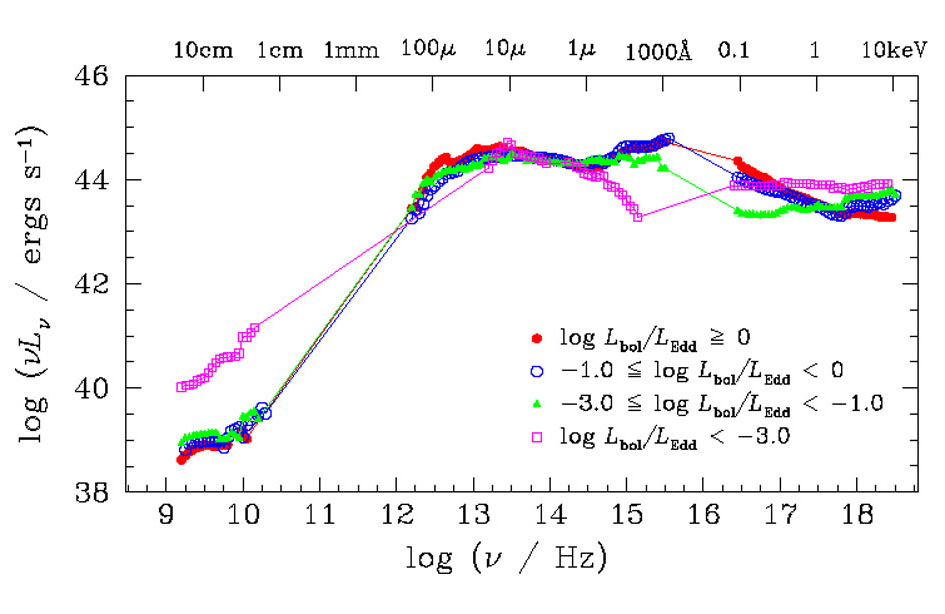 |
Figure 7. Composite SEDs for radio-quiet AGNs binned by Eddington ratio. The SEDs are normalized at 1 µm. (Adapted from L.C. Ho, in preparation.) |
In a parallel development, studies of the low-luminosity, often LINER-like
nuclei of FR I radio galaxies also support the notion that they lack a UV
bump. M84
(Bower et al. 2000)
and M87
(Sabra et al. 2003)
are two familiar examples, but it has been well documented that FR I
nuclei tend to exhibit
flat ox
(Donato, Sambruna & Gliozzi
2004;
Balmaverde, Capetti &
Grandi 2006;
Gliozzi et al. 2008)
and steep slopes in the optical
(Chiaberge, Capetti &
Celotti 1999;
Verdoes Kleijn et al. 2002)
and optical-UV
(Chiaberge et al. 2002).
Finally, I note that the UV spectral slope can be indirectly constrained
from considering the strength of the
He II 4686 line. While
this line is clearly detected in Pictor A
(Carswell et al. 1984;
Filippenko 1985),
its weakness in NGC 1052 prompted
Péquignot (1984)
to deduce that the ionizing spectrum must show a sharp cutoff above the
He+ ionization limit (54.4 eV). In this respect, NGC 1052 is
quite representative of LINERs in general.
He II 4686 was not
detected convincingly in a single case among a sample of 159
LINERs in the entire Palomar survey
(Ho, Filippenko & Sargent
1997a).
Starlight contamination surely contributes partly to this, but
the line has also eluded detection in HST spectra (e.g.,
Ho, Filippenko & Sargent
1996;
Nicholson et al. 1998;
Barth et al. 2001b;
Sabra et al. 2003;
Sarzi et al. 2005;
Shields et al. 2007),
which indicates that it is truly intrinsically very weak. To a first
approximation, the ratio of
He II 4686 to
H reflects the
relative intensity of the ionizing continuum between 1 and 4 Ryd. For an
ionizing spectrum
f
, case B recombination
predicts He II 4686 /
H = 1.99
× 4
(Penston & Fosbury 1978).
The current observational limits of
He II 4686 /
H
0.1 thus imply
-2, qualitatively
consistent with the evidence from the SED studies.
reflects the
relative intensity of the ionizing continuum between 1 and 4 Ryd. For an
ionizing spectrum
f
, case B recombination
predicts He II 4686 /
H = 1.99
× 4
(Penston & Fosbury 1978).
The current observational limits of
He II 4686 /
H
0.1 thus imply
-2, qualitatively
consistent with the evidence from the SED studies.
Maoz (2007)
has offered an alternative viewpoint to the one presented
above. Using a sample of 13 LINERs with variable UV nuclei, he argues
that their SEDs do not differ appreciably from those of more luminous
AGNs, and hence that LINERs inherently have very similar accretion disks
compared to powerful AGNs. Maoz does not disagree that LINERs have
large X-ray-to-UV flux ratios or that they tend to be radio-loud;
his data show both trends. Rather, he contends that because LINERs lie
on the low-luminosity extrapolation of the well-known relation between
ox and
luminosity
(Zamorani et al. 1981;
Avni & Tananbaum 1982;
Strateva et al. 2005)
they do not form a distinct population. And while LINERs do
have large values of Ro, they nonetheless occupy the
"radio-quiet" branch of the Ro versus
Lbol / LEdd plane
(Sikora, Stawarz & Lasota
2007).
In my estimation, the key point is not, and has
never been, whether LINERs constitute a disjoint class of AGNs, but
whether they fit into a physically plausible framework in which their
distinctive SEDs, among other properties, find a natural, coherent
explanation. Section 8 attempts to offer such a
framework.
It should be noted that Maoz's results strongly depend on his decision to exclude all optical and near-IR data from the SEDs, on the grounds that they may be confused by starlight. I think this step is too draconian, as it throws away valuable information. While stellar contamination is certainly a concern, one can take necessary precautions to try to isolate the nuclear emission as much as possible, either through high-resolution imaging (e.g., Ho & Peng 2001; Ravindranath et al. 2001; Peng et al. 2002) or spectral decomposition. In well-studied sources, there is little doubt that the optical continuum is truly both featureless and nonstellar (e.g., Halpern & Filippenko 1984; Ho, Filippenko & Sargent 1996; Ho et al. 2000; Bower et al. 2000; Sabra et al. 2003). Given what we know about the nuclear stellar population, we cannot assign the featureless continuum to young stars. In a few cases, the nonstellar nature of the nucleus can even be established through variability in the optical (Bower et al. 2000; Sabra et al. 2003; O'Connell et al. 2005) and mid-IR (Rieke, Lebofsky & Kemp 1982; Grossan et al. 2001; Willner et al. 2004).
While the SEDs of LINERs differ from those of traditional AGNs, it is important to recognize that they are decidedly nonstellar and approximate the form predicted for radiatively inefficient accretion flows (RIAFs) onto BHs, often coupled to a jet (Quataert et al. 1999; Yuan, Markoff & Falcke 2002; Yuan et al. 2002; Fabbiano et al. 2003; Pellegrini et al. 2003b; Ptak et al. 2004; Nemmen et al. 2006; Wu, Yuan & Cao 2007). They bear little resemblance to SEDs characteristic of normal stellar systems. Inactive galaxies or starburst systems not strongly affected by dust extinction emit the bulk of their radiation in the optical-UV and in the thermal IR regions, with only an energetically miniscule contribution from X-rays.
Many astrophysical applications of AGN demographics benefit from knowing
the AGN luminosity function,
 (L, z).
Whereas
(L, z)
has been reasonably well charted at high
L and high z using quasars, it is very poorly known at low
L and low z. Indeed, until very recently there has been no
reliable determination of
(L, 0). The
difficulty in determining
(L, 0) can be
ascribed to a number of factors, as discussed in
Huchra & Burg (1992).
First and foremost is the
challenge of securing a reliable, spectroscopically selected
sample. Since nearby AGNs are expected to be faint relative to their
host galaxies, most of the traditional techniques used to identify
quasars cannot be applied without introducing large biases. The
faintness of nearby AGNs presents another obstacle, namely how to
disentangle the nuclear emission - the only component relevant to
the AGN - from the usually much brighter contribution from the host
galaxy. Finally, most optical luminosity functions of bright, more
distant AGNs are specified in terms of the nonstellar optical continuum
(usually the B band), whereas spectroscopic surveys of nearby
galaxies generally only reliably measure optical line emission (e.g.,
H) because the
featureless nuclear continuum is often impossible to detect in
ground-based, seeing-limited apertures.
(L, z).
Whereas
(L, z)
has been reasonably well charted at high
L and high z using quasars, it is very poorly known at low
L and low z. Indeed, until very recently there has been no
reliable determination of
(L, 0). The
difficulty in determining
(L, 0) can be
ascribed to a number of factors, as discussed in
Huchra & Burg (1992).
First and foremost is the
challenge of securing a reliable, spectroscopically selected
sample. Since nearby AGNs are expected to be faint relative to their
host galaxies, most of the traditional techniques used to identify
quasars cannot be applied without introducing large biases. The
faintness of nearby AGNs presents another obstacle, namely how to
disentangle the nuclear emission - the only component relevant to
the AGN - from the usually much brighter contribution from the host
galaxy. Finally, most optical luminosity functions of bright, more
distant AGNs are specified in terms of the nonstellar optical continuum
(usually the B band), whereas spectroscopic surveys of nearby
galaxies generally only reliably measure optical line emission (e.g.,
H) because the
featureless nuclear continuum is often impossible to detect in
ground-based, seeing-limited apertures.
A different strategy can be explored by taking advantage of the fact
that H luminosities are
now available for nearly all of the AGNs in the Palomar survey.
Figure 8
shows the H luminosity
function for the Palomar sources, computed using the
V / Vmax method (L.C. Ho, A.V. Filippenko
& W.L.W. Sargent, in preparation). Two versions are shown, each
representing an extreme view of what kind of sources should be regarded
as bona fide AGNs. The open symbols include only type 1 nuclei,
whose AGN status is incontrovertible. This may be regarded as the most
conservative assumption and a lower bound, since we know that genuine
narrow-line AGNs do exist. The filled symbols lump together all sources
classified as LINERs, transition objects, and Seyferts, both type 1 and
type 2. This represents the most optimistic view and an upper bound, if
some type 2 sources are in fact AGN impostors, although, as I argue in
Section 6.5, this is likely to be a small
effect. The true space density of local AGNs lies between these two
possibilities. In either case, the differential luminosity function can
be approximated by a single power law from
LH
1038 to 3 × 1041 ergs s-1, roughly
of the form L-1.2 ±
0.2. The slope seems to flatten below
LH
1038 ergs
s-1, but the luminosity function is highly uncertain at the
faint end because of density fluctuations in our local
volume. Nevertheless, it is remarkable that the Palomar luminosity
function formally begins at
LH
6 × 1036
ergs s-1, roughly the luminosity of the Orion nebula
(Kennicutt 1984).
In units more familiar to the AGN community, this
corresponds to an absolute B-band magnitude of roughly -8 (using
the H-optical continuum
conversion of
Greene & Ho 2005b),
no brighter than a single supergiant star.
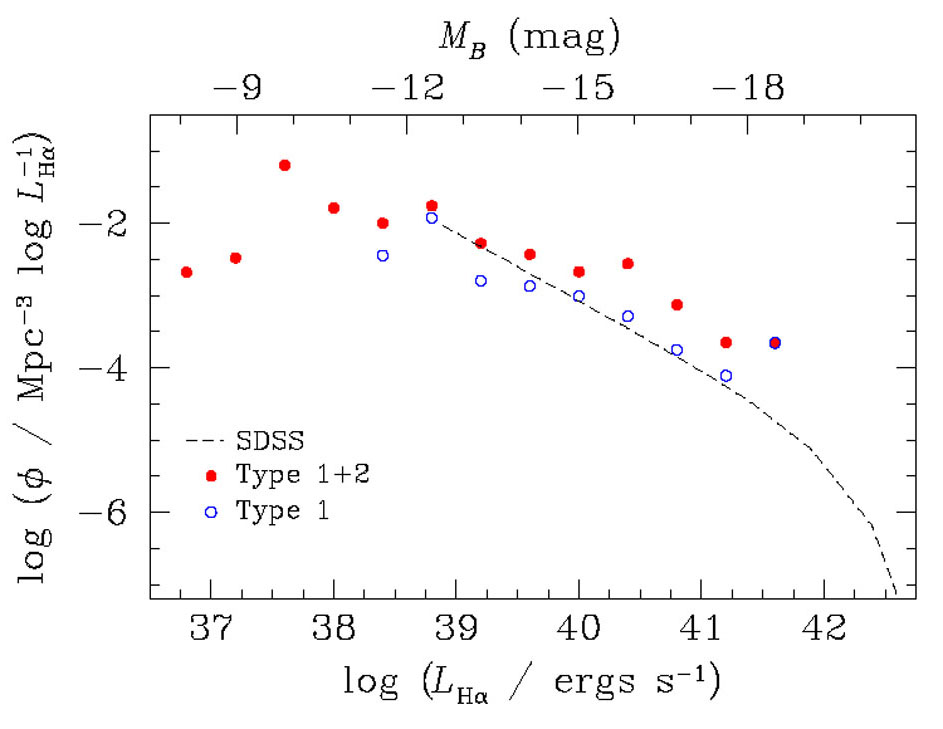 |
Figure 8. The
H |
For comparison, I have overlaid the
H luminosity function of
z
0.35 Seyfert galaxies derived from the SDSS by
Hao et al. (2005b).
The Palomar survey reaches ~ 2 orders of magnitude fainter in
H
luminosity than SDSS, but the latter extends a factor of 10 higher at the
bright end. Over the region of overlap, the two surveys show reasonably
good agreement, especially considering the small number statistics of
the Palomar survey and the fact that Hao et al.'s sample only includes
Seyferts.
5.10. Bolometric Luminosities and Eddington Ratios
To gain further insight into the physical nature of LLAGNs, it is more
instructive to examine their bolometric luminosities rather than their
luminosities in a specific band or emission line. Because AGNs emit a
very broad spectrum, their bolometric luminosities ideally should be
measured directly from their full SEDs. In practice, however, complete
SEDs are not readily available for most AGNs, and one commonly estimates
Lbol by applying bolometric corrections derived from a
set of well-observed calibrators. As discussed in
Section 5.8, the SEDs
of LLAGNs differ quite markedly from those of conventionally studied
AGNs. Nonetheless, they do exhibit a characteristic shape, which enables
bolometric corrections to be calculated. The usual practice of choosing
the optical B band as the reference point should be abandoned for
LLAGNs, not only because reliable optical continuum measurements are
scarce but also because the optical/UV region of the SED shows the
maximal variance with respect to accretion rate
(Section 5.8) and
depends sensitively on extinction. What is available, by selection, is
nuclear emission-line fluxes, and upper limits thereon. Although the
H luminosity comprises
only a small percentage of the total power, its fractional contribution
to Lbol turns out to be fairly well defined: from the
SED study of L.C. Ho (in preparation), Lbol
220
LH,
with an rms scatter of ~ 0.4 dex, consistent with the calibration given in
Greene & Ho (2005b,
2007a).
Because of the
wide range of ionization levels among LLAGNs, a bolometric correction
based on H should be
more stable than one tied to
[O III] 5007 (e.g.,
Heckman et al. 2005).
Nevertheless, in light of the nonnuclear component of the nebular
flux in LLAGNs (Section 6.4), the luminosity
of the narrow
H line will tend to
overestimate Lbol. I recommend that, whenever
possible, Lbol should be based on the hard X-ray (2-10
keV) luminosity, bearing in mind the added complication that the
bolometric correction in this band is luminosity-dependent. Making use
again of the database from L.C. Ho (in preparation), I estimate
Lbol / LX
83, 28, and 16 for
quasars, luminous Seyferts, and LLAGNs, respectively.
Figure 9 shows the distributions of
Lbol and their values normalized with respect to the
Eddington luminosity for Palomar galaxies with measurements of
LX and central stellar velocity dispersion. The
MBH -
relation of
Tremaine et al. (2002)
was used to obtain LEdd. Although there is substantial
overlap, the four
spectral classes clearly delineate a luminosity sequence, with
Lbol decreasing systematically as
S  L
T
A. The differences
become even more pronounced in
terms of Lbol / LEdd, with Seyferts
having a median value (1.3 × 10⁻⁴) 20 times higher than
in LINERs (5.9 × 10⁻⁶), which in turn are higher than
transition objects by a factor of ~ 5. Among Seyferts and LINERs, type 1
sources are systematically more luminous than type 2s. Notably, the vast
majority of nearby nuclei have highly sub-Eddington luminosities. The
total distribution of Eddington ratios is characterized by a prominent
peak at Lbol / LEdd
10-5 dominated
by Seyfert 2s, LINERs, and transition objects, and a precipitous drop
toward larger Eddington ratios. Contrary to previous claims
(Wu & Cao 2005;
Hopkins & Hernquist
2006)
based on the smaller sample of
Ho (2002a),
the distribution of Eddington ratios shows no
bimodality. The systematic difference in Eddington ratios between LINERs
and Seyferts has been noticed before in the Palomar survey
(Ho 2002b,
2003,
2005)
and in SDSS
(Kewley et al. 2006),
but this is the first time that the more subtle differences among the
different subclasses can be discerned.
L
T
A. The differences
become even more pronounced in
terms of Lbol / LEdd, with Seyferts
having a median value (1.3 × 10⁻⁴) 20 times higher than
in LINERs (5.9 × 10⁻⁶), which in turn are higher than
transition objects by a factor of ~ 5. Among Seyferts and LINERs, type 1
sources are systematically more luminous than type 2s. Notably, the vast
majority of nearby nuclei have highly sub-Eddington luminosities. The
total distribution of Eddington ratios is characterized by a prominent
peak at Lbol / LEdd
10-5 dominated
by Seyfert 2s, LINERs, and transition objects, and a precipitous drop
toward larger Eddington ratios. Contrary to previous claims
(Wu & Cao 2005;
Hopkins & Hernquist
2006)
based on the smaller sample of
Ho (2002a),
the distribution of Eddington ratios shows no
bimodality. The systematic difference in Eddington ratios between LINERs
and Seyferts has been noticed before in the Palomar survey
(Ho 2002b,
2003,
2005)
and in SDSS
(Kewley et al. 2006),
but this is the first time that the more subtle differences among the
different subclasses can be discerned.
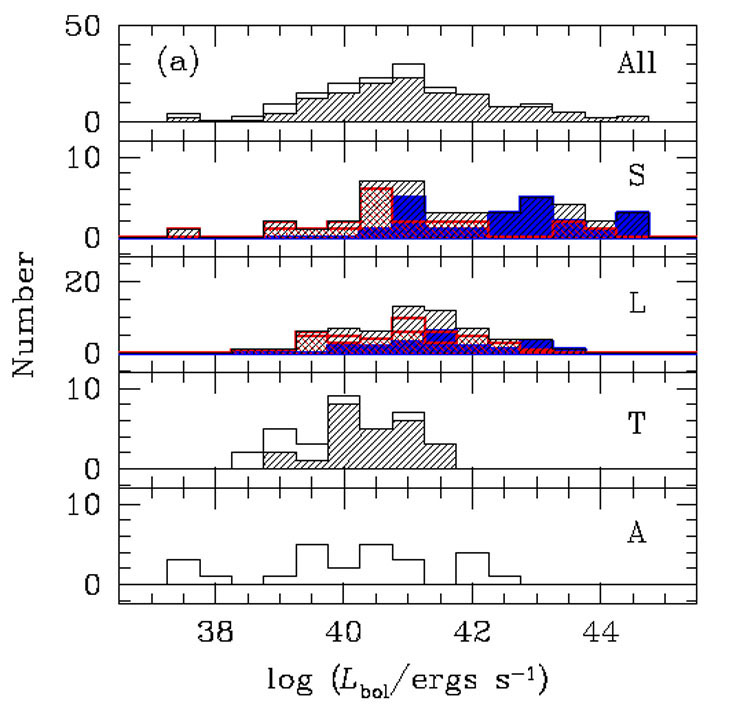 |
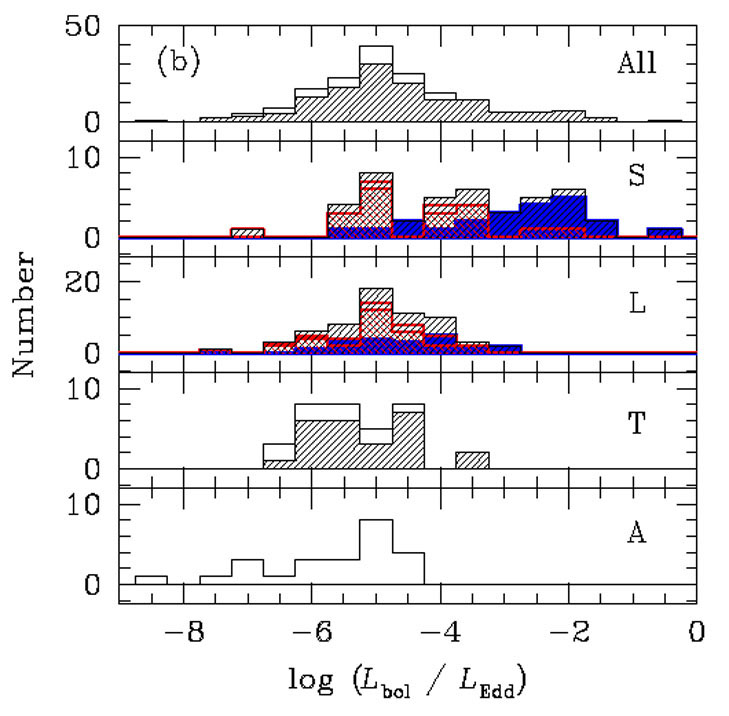 |
Figure 9. Distribution of (a) bolometric luminosity, Lbol, and (b) ratio of bolometric luminosity to the Eddington luminosity, Lbol / LEdd, for all objects, Seyferts (S), LINERs (L), transition objects (T), and absorption-line nuclei (A). Lbol is based on the X-ray (2-10 keV) luminosity. The hatched and open histograms denote detections and upper limits, respectively; type 1 objects are plotted in blue, type 2 objects in red. (Adapted from L.C. Ho, in preparation.) |
|