


The First Byurakan Spectral Sky Survey (FBS), also commonly known as the
"Markarian Survey," was initiated in 1964. It was the first systematic
objective-prism search for galaxies with strong ultraviolet (UV)
continuum emission. The observations were carried out with the Byurakan
Observatory (Armenia) 1 m Schmidt telescope equipped with a
low-dispersion (1800 Å mm-1 at
H ),
1.5° objective prism. This low-dispersion objective prism was mostly
used with Kodak IIa-F plates to detect galaxies with excess UV
radiation. The survey consisted of 1133 fields (each 4° ×
4° in size) and covered 17,008 deg2 north of
-15° declination, excluding regions within 15° - 20° of
the Galactic
plane. It was completed in 1978 and published in a series of 15 papers
including 1500 UV-excess objects
(Markarian et
al. 1981
and references therein). Later
Markarian at al (1989)
added 15 new objects detected on the original plates, bringing
the total number of Markarian objects to 1515. A list of 40 anomalous
galaxies brighter than 13th magnitude was published earlier
(Markarian 1963).
These galaxies are not included in the database.
),
1.5° objective prism. This low-dispersion objective prism was mostly
used with Kodak IIa-F plates to detect galaxies with excess UV
radiation. The survey consisted of 1133 fields (each 4° ×
4° in size) and covered 17,008 deg2 north of
-15° declination, excluding regions within 15° - 20° of
the Galactic
plane. It was completed in 1978 and published in a series of 15 papers
including 1500 UV-excess objects
(Markarian et
al. 1981
and references therein). Later
Markarian at al (1989)
added 15 new objects detected on the original plates, bringing
the total number of Markarian objects to 1515. A list of 40 anomalous
galaxies brighter than 13th magnitude was published earlier
(Markarian 1963).
These galaxies are not included in the database.
In the series of 15 original papers (Markarian et al. 1981 and references therein) the descriptions for individual Markarian galaxies and often their neighbor(s) are noted, and in several cases these neighbors were also described as UV-excess objects with appropriate spectral classes, but surprisingly these objects were not included in the UV-excess objects lists. These "missing" objects were included in the present database under the individual Markarian name. Similarly, several Markarian galaxies had more than one component described as a UV-excess object. We separate all these components as isolated Markarian objects and include them in this database by adding letters (a, b) to the name of the main Markarian object. This brings the total number of Markarian objects that are included in the present database to 1544.
In the course of the Markarian survey, more than 200 Seyfert galaxies, and hundreds of starburst, blue compact, and H II galaxies were discovered. The FBS remains perhaps the best-known source of such objects in the local universe. During the past 30 years, hundreds of research articles have appeared that contain detailed observational data and studies of Markarian objects (e.g., Huchra 1977; Keel & van Soest 1992; Mazzarella & Boroson 1993; Bicay et al. 1995). Extensive compilations of optical data and literature references for the Markarian galaxies were presented in two catalogs (Mazzarella & Balzano 1986, hereafter MB86; Markarian et al. 1989, hereafter M+89). Both catalogs have greatly contributed to the study of Markarian galaxies, but there still remained a significant incompleteness in the availability of many fundamental parameters such as magnitudes, diameters and morphologies. Today, the availability of the high-quality observations from the photographic sky surveys allows us to measure additional optical parameters such as morphology, apparent magnitude, size, and axial ratio of the galaxies in a more accurate and homogeneous way, and also to extract quantitative data about their local environment. This high accuracy and homogeneous information can be important and valuable not only for the study of the sample of Markarian galaxies, but also for comparative studies of the properties of the different samples of active and star-forming as well as normal galaxies. The data gathered in this database were measured and compiled with the goal of obtaining a complete, homogeneous set of optical parameters for the Markarian objects for statistical studies. Eventually, we expect that some of these parameters objects could be improved by data mining of the Sloan Digital Sky Survey (SDSS), but even when completed, however, the SDSS survey footprint will only cover about 70% of the Markarian survey area. The currently available Data Release 5 (DR5) of SDSS contains photometric data for 946 and photometric plus spectral information for 455 Markarian objects. It should also be noted that we do not use the SDSS magnitudes published in the DR5 catalog because of potential saturation of the CCDs for the brighter galaxies and the difficulties in measuring extended galaxies by the automated pipeline processing that often break up into multiple objects. In the future we expect that photometric measurements of these galaxies will become available following reprocessing from the image data.
2.2. Compiled Parameters for Markarian Galaxies
In this database, heliocentric redshifts for 1524 of 1544 Markarian objects have been collected from the literature, the NASA Extragalactic Database (NED), and the 455 Markarian galaxies observed spectrally in the SDSS 5th Data Release. Of the 20 objects without redshifts, 4 are galaxies (Mrk 1017, 1254, 1265 and 1327), 5 are components of the galaxies (Mrk 256b, 456a, 489a, 861a, and 913b), and the remaining 11 are galaxies with projected galactic stars. For these 11 cases the spectra of the projected stars had previously been observed and the UV-excess identified with the stars rather than the galaxies. In many cases when more than one redshift measurements are available, the more accurate H I 21 cm or the latest published value is given. Redshifts for the UV-excess components of the galaxies with multicomponent structure are mostly from the papers relating to their detailed spectroscopic study. References for these determinations are provided in the notes to the database. Redshift information for some misclassified or not correctly identified objects are described in the same section of the notes.
2.2.2. FBS Spectral Classification
Markarian (1967; MB86; M+89) assigned a spectral classification for each UV excess galaxy that describes the degree of condensation of the UV emission as well as its intensity. Emission regions are classified as "stellar" s or "diffuse" d if the half-width of the emission region on the Schmidt plates is of the order of 2" or 6" - 8", respectively. The intermediate types sd and ds were also used. A number between 1 and 3 was used to indicate the relative intensity of the UV emission with 1 being the strongest UV excess. The existence of emission lines in the spectra was identified by "e," with "e:" indicating doubtful cases. In the database, spectral classes for Markarian galaxies are presented according to M+89.
In the database, we use the following classes to describe the activity: Seyfert class 1 - 2, LINERs as Seyfert class 3, QSO, BL Lacertae, SB (starburst nuclei), and H II objects (spectra similar to H II regions), as well as galactic stars. Galaxies with Wolf-Rayet spectra are described in the database as WR activity class objects (e.g., Schaerer et al. 1999). We should note that in the literature there is an overlap of SB and H II classifications. Many objects previously defined as H II have later been classified as SB and vice versa (e.g., Balzano 1983; Telesco et al. 1993). There are probably many more SB and H II objects among the Markarian galaxies that have narrow emission line spectra but for which detailed spectral information is not available yet. If there is not sufficient spectral information for classification of the galaxies, a description of the spectra of the galaxy as e (emission), a (absorption), or e, a (emission, absorption) is presented. All objects with new determinations of the activity classes and objects whose activity classes have been revised since M+89 are mentioned in the notes to the database.
2.3. Measured Parameters for Markarian Galaxies
2.3.1. Observational Material and Images of Markarian galaxies
Central to this project was the availability of the digitized sky survey (DSS) images obtained in support of the construction of the HST Guide Star Catalogues (Lasker et al. 1990; McLean et al. 1998), The GSC is based on Palomar Schmidt plates for the northern sky and the SERC UK Schmidt plates for the southern sky. Approximately 80% of the Markarian galaxies are located on the northern sky survey plates and 20% on the southern plates. Five different sets of survey plates were used in this project.
For the morphological classification, we primarily used the northern
"Quick-V" (QV) survey, and the southern "Equatorial-J" (EJ) surveys. The
QV plates are 20 minute V-band exposures on IIaD emulsion with
Wratten number 12 gelatin or 3 mm Schott GG495 glass filter giving a
central wavelength of 5700 Å. The EJ plates are ~ 60 minute
J-band exposures on IIIaJ emulsion with a Scott GG395 glass
filter giving an effective wavelength of ~ 4800 Å. We find the QV
and EJ
survey plates to be superior to the original Palomar Observatory Sky
Survey (POSS-I) survey plates for our purpose of classifying the
morphologies of the Markarian galaxies. This is because the central
regions of the galaxies are frequently much less saturated on the QV,
and additionally, more structure can be resolved with the medium grain
QV and fine grain EJ emulsions compared to the coarse grain 103a POSS-I
emulsions. The magnitudes and diameter measurement were computed from
the POSS-II Jpg and Fpg surveys and
the UKSTU EJ and ER surveys. The Palomar Sky Survey
(Reid et al. 1991)
has been taken in three passbands; blue (IIIa-J emulsion and GC395 filter:
 eff
~ 4800 Å); red (IIIa-F emulsion and RG610
filter: eff
~ 6500 Å); and near-infrared (INV emulsion and RG9 filter:
eff ~ 8500
Å). The UKSTU ER is a
IIIa-F emulsion with OG590 filter giving an effective wavelength of ~ 6300
Å. The mean limiting magnitude for the POSS-II plates are
Jpg = 22.5 ± 0.4 and Fpg = 20.8
± 0.4
(Reid et al. 1991).
eff
~ 4800 Å); red (IIIa-F emulsion and RG610
filter: eff
~ 6500 Å); and near-infrared (INV emulsion and RG9 filter:
eff ~ 8500
Å). The UKSTU ER is a
IIIa-F emulsion with OG590 filter giving an effective wavelength of ~ 6300
Å. The mean limiting magnitude for the POSS-II plates are
Jpg = 22.5 ± 0.4 and Fpg = 20.8
± 0.4
(Reid et al. 1991).
All the plates were digitized at the Space Telescope Science Institute (STScI) using Perkin-Elmer PDS 2020G scanning microdensitometers with various modifications as described by Lasker et al. (1990). The QV and EJ plates were scanned at a resolution of 1.7" pixel-1. The POSS-II and UKSTU-ER plates were scanned at a resolution of 1.0" pixel-1. These images have better resolution and fidelity compared to the earlier POSS-I surveys on which many previous studies were based.
Using the positions published by MB86, 14.25' × 14.25' images centered on each Markarian galaxy were extracted from the QV and EJ images in the DSS. These images were visually compared to the finding charts published by Markarian and his coworkers (Markarian et al. 1981 and references therein) to locate significant positional discrepancies. The finding charts published by Markarian and his coworkers are copies of the POSS E plates covering a 16' × 16' fields. Using these images, the accurate coordinates of Markarian galaxies were measured and their morphologies were determined.
Using the accurate optical positions of Markarian galaxies, 10' × 10' regions centered on each Markarian galaxy were extracted from the POSS-II J, POSS-II F, and UKSTU-ER images. Using these images, the morphologies of Markarian galaxies were checked using the outer region structure. We then measured each object's blue and red apparent magnitude, major and minor diameters, and position angles, as well as determining the apparent number of neighboring galaxies within a 50 kpc radius based on the published redshift.
The original Markarian lists contain positions accurate to about 2' - 3' in right accession and declination. In both the MB86 and M+89 catalogs, the sources of accurate coordinates of Markarian galaxies are Peterson (1973), Kojoian et al. (1978, 1981a, 1981b, 1982, 1984), and Foltz et al. (1980, 1981). In these articles the accuracy of the position measurements is reported to be a few arcseconds.
Finding charts of the Markarian galaxies and descriptions of individual objects were the primary sources to build the list of the objects for measurement. Positions of stellar objects are typically located to better than 0.5" using either a 2D Gaussian fit or the intensity-weighted moments of the object pixels. The actual positions of the extended objects are somewhat more poorly determined because of their more complex morphologies and difficulty of locating the image centroid of the objects. For such objects and also for the objects with multiple UV-excess sources in the common envelopes we visualized the images of the Markarian objects using the Aladin interactive software sky atlas and checked or measured carefully the positions (using the peak intensity) for diffuse objects or multiple UV-excess components in the common envelopes. In these cases the positions may be uncertain to 1". Once again, note that multiple components have been renamed by adding a letter to the original Markarian name. All coordinates are in the HST Guide Star Selection J2000.0 System.
The descriptions in the original lists of Markarian galaxies indicate that a large fraction are morphologically peculiar. However, these descriptions were often in error because they were limited by the sensitivity of the Palomar Observatory Sky Survey (POSS-I) prints on which galaxies images were inspected. Only about 30% of the sample objects (preferentially the closer and brighter galaxies) had previously published morphological descriptions (MB86; M+89; Huchra 1977; de Vaucouleurs et al. 1976, hereafter RC2; Nilson 1973). The current database presents complete and homogeneous data for the morphologies of Markarian galaxies.
The northern QV survey plates were originally intended for the measurement of stellar objects between 12th and 19th magnitude; however, since they are of shorter exposure than typical survey plates the nuclei of many galaxies are not saturated. These plates are suitable for examining the morphology of the central structure of many brighter galaxies. This is especially true for Markarian galaxies, which are typically between 14th and 17th magnitude. Furthermore, the uniformity of the survey plates makes them useful for examining the structural features of the galaxies. For the morphological study of Markarian galaxies, especially the structure of the outer regions, the Jpg and Fpg plates were used as supplementary material. By using both digital images and isophotal maps, which were constructed to display the large dynamic range of the images, we classified the Markarian galaxies using the modified Hubble sequence (E-S0-Sa-Sb-Sc-Sd-Sm-Im) and the extension to blue compact dwarf galaxies (BCDs; Sandage & Binggeli 1984).
Markarian irregular galaxies usually contain at least one giant star-forming region, which is the main source of the excess UV radiation. Sandage & Binggeli (1984) designate giant H II regions in irregular galaxies as BCDs. We have expanded this approach by classifying such galaxies using the composite notation Im/BCD when the underlying Im system is dominant and by BCD/Im when the BCD component (often with several knots) dominates. It is important to note that this approach is morphological only. According to several recent studies (e.g., Papaderos et al. 1996; Doublier et al. 1997), the underlying component of a BCD is structurally different from that of an Im galaxy.
In several cases (Mrk 59, 71, 86b, 94, 256b, 404, 489b, 1039, 1236, 1315, and 1379a) the Markarian object is actually a giant H II complex in the large galaxy. These cases are noted in the catalog as an H II region. Close interacting systems or mergers are classified as separate classes of the objects.
In Figure 1, as examples, images of each
morphological type galaxies are shown both in gray scale and contour
plots. The field size (and thus magnification) was selected individually
for each galaxy to clearly illustrate its individual morphological
structure. The contour levels are in arbitrary units. The lowest contour
level was chosen at the about
3  level of the local
background. The contour interval is
constant, but different in each case; usually it is between 10% - 30% of
the local background. The interval was chosen in order to best
illustrate both the inner and outer structure of the galaxy.
level of the local
background. The contour interval is
constant, but different in each case; usually it is between 10% - 30% of
the local background. The interval was chosen in order to best
illustrate both the inner and outer structure of the galaxy.
 |
Figure 1. Examples of different
morphological type Markarian objects. North is up, and east is to the
left. The magnification was selected individually for each galaxy to
clearly illustrate its individual morphological structure. The contour
levels are in arbitrary units. The lowest contour level was chosen at
the about 3 |
| Figure 1b, 1c, 1d, 1e, 1f, 1g, 1h, 1i, 1j |
The morphological structures of "peculiar" Markarian galaxies are better studied (e.g., Petrosian et al. 1978; Mazzarella & Boroson 1993) than the morphologies of "ordinary" Markarian objects, for which the most valuable research was carried out by Huchra (1977). Prior to this study, the HYPERLEDA (Leon-Meudon Extragalactic Database) database contained the published morphological classes of 675 Markarian galaxies. These were collected from various publications and often are incorrectly defined or not complete. Figure 2 illustrates several examples that are misclassified in the HYPERLEDA compilation due to its inhomogeneous nature. The total number of misclassified cases in HYPERLEDA is around 100.
 |
Figure 2. Examples of galaxies classified differently by HYPERLEDA and in this paper: Mrk 49 (elliptical cf. Im/BCD); Mrk 51 (elliptical cf. spiral); Mrk 1504 (elliptical cf. spiral); Mrk 314 (elliptical cf. merger); Mrk 84 (nonbarred cf. barred spiral); Mrk 161 (nonbarred cf. barred spiral); Mrk 647 (nonbarred cf. barred spiral); Mrk 1189 (nonbarred cf. barred spiral); Mrk 162 (compact cf. spiral); Mrk 1319 (compact cf. spiral); Mrk 750 (compact cf. BCD/Im); Mrk 194 (compact cf. merger). North is up, and east is to the left. The magnification was selected individually for each galaxy to clearly illustrate its individual morphological structure. Contour levels and axis labels are as in Fig. 1. |
Figure 2b, 2c, 2d, 2e, 2f |
Figure 3 illustrates the distribution of the object morphologies derived from our homogeneous classification compared with the subsample available within HYPERLEDA.
 |
Figure 3. Bar graph showing change in morphological distribution between the HYPERLEDA sample (white) and our complete classification (black). |
In both the original lists of Markarian galaxies and in M+89, the angular sizes of UV-excess objects were measured on red POSS-I charts and corresponded to the regions of the galaxies radiating in UV. In most cases, this was the main body of the galaxy, but in a number of cases it referred only to the nuclear region or some condensation in the galaxy. These diameters were eye estimates and so were not homogeneous or accurate.
The major and minor angular diameters of Markarian galaxies were
measured in a homogeneous way from the blue and red images of the
galaxies at the isophote corresponding to 3 times the background rms
noise or 3 . Since the
Jpg and Fpg plates have different
limiting apparent magnitudes
(Reid et
al. 1991), it
is necessary to reduce the measured diameters to a single uniform
system. Taking into account that the mean linear diameter of the galaxy
depends on its morphological type (e.g.,
Roberts & Hayes
1994),
a reduction to a uniform system is performed
separately for the samples of early (elliptical, S0 and S0/a galaxies)
and late (spiral and irregular galaxies) as well as blue compact and
compact type galaxies. Such a separation into subsamples was essential
also for the
Heidmann et
al. (1972)
procedure, which was used to determine the mean limiting galaxy surface
brightness in our system.
Figure 4 compares the red and blue major diameters for the (a) early-type galaxies, (b) late-type galaxies, and (c) the BCD and compact galaxies. Using linear regression to determine the fits and correlation coefficients give us the following:
Early. - D"(F) = (0.942 ± 0.011)D"(J) + (0.634 ± 0.488), r = 0.978 ± 0.011, N = 363.
Late. - D"(F) = (0.917 ± 0.006)D"(J) + (1.515 ± 0.333), r = 0.985 ± 0.006, N = 870.
Compact. - D"(F) = (0.858 ± 0.019)D"(J) + (1.425 ± 0.441), r = 0.958 ± 0.021, N = 178.
 |
 |
 |
|
Figure 4. Comparison of the measured blue and red major diameters for (a) early morphological type, (b) late morphological type, and (c) compact morphological type Markarian galaxies. The best linear fit and 1:1 lines are plotted. |
|
In general, the 5% - 8% larger blue diameters of Markarian galaxies in
comparison to red diameters are due to a combination of both the deeper
limiting magnitudes for the blue plates compared to the red plates
(Reid et al. 1991),
and the fact that the outer regions of many of these galaxies tends to
be blue because of star formation in their disks. Using the method of
Heidmann et
al. (1972),
we obtain two estimates of the limiting
(3 ) surface brightness
from both the early-type (25.22 ± 0.38 mag arcsec-2) and
late-type (25.25 ± 0.59 mag arcsec-2) galaxies. These
are consistent with each other and we shall adopt a mean limiting
surface brightness of Bj = 25.2 mag arcsec-2 for our
measurements.
We used data from HYPERLEDA to verify the agreement of our diameter system with the standard D(25) diameter system (Paturel et al. 1991, 1997). Once again, the comparison of our measured blue angular diameters with the HYPERLEDA angular diameters are done separately for early- and late-type Markarian galaxies. Before comparing the samples, we excluded the objects that are incorrect in HYERLEDA. Figure 5 compares HYPERLEDA D(25) and our blue diameters for (a) early-type and (b) late-type Markarian galaxies. The dependence between two diameters can be fitted in with the linear regression, which has following form and coefficient of correlation:
Early. - D"(25) = (0.870 ± 0.016)D"(J) + (1.910 ± 0.747), r = 0.956 ± 0.018, N = 277.
Late. - D"(25) = (0.923 ± 0.008)D"(J) + (1.345 ± 0.477), r = 0.980 ± 0.008, N = 584.
 |
 |
Figure 5. Comparison of the measured blue major diameters with HYPERLEDA for (a) early morphological type and (b) late morphological type Markarian galaxies. The best linear fit and 1:1 lines are plotted. |
Our measured blue diameters are typically larger than HYPERLEDA blue D(25) diameters. This is due to the deeper mean limiting galaxy surface brightness in our system.
Several authors (e.g., Smith 1985) emphasized that the Markarian survey may be biased against discovering objects with even quite small amounts of dust extinction. Other authors stress the importance of a bias against discovering of the UV excess galaxies, as a function of the inclination of the galaxy with respect to the observer (Joeveer 1986). In this respect determination of inclination for large number of Markarian objects is crucial.
The major and minor angular diameters of Markarian galaxies were measured in both bandpasses in a homogeneous way with respect to the background and its rms noise for the mean limiting surface brightness of about 25.2 mag arcsec-2. The axis ratios were calculated from these measurements using the formula R = Dminor / Dmajor. Figure 6 compares the red and blue axis ratios for (a) early-type, (b) late-type, and (c) compact galaxies. We obtained the following fit and correlations:
Early. - R(F) = (0.970 ± 0.021)R(J) + (0.028 ± 0.017), r = 0.924 ± 0.020, N = 363.
Late. - R(F) = (0.957 ± 0.009)R(J) + (0.033 ± 0.006), r = 0.962 ± 0.009, N = 870.
Compact. - R(F) = (0.947 ± 0.029)R(J) + (0.057 ± 0.025), r = 0.924 ± 0.028, N = 178.
 |
 |
 |
|
Figure 6. Comparison of the measured blue and red axial ratios for (a) early morphological type, (b) late morphological type, and (c) compact morphological type Markarian galaxies. The best linear fit and 1:1 lines are plotted. |
|
These data indicate that the axial ratios measured in the blue and red systems have no significant differences.
Once again, we used data from HYPERLEDA to verify the agreement of our axial ratio system with the standard R(25) system (Paturel et al. 1997) separately for early- and late-type Markarian galaxies. We used the same galaxies for which we compared the angular diameters. Figure 7 compares HYPERLEDA and our axial ratios for (a) early-type and (b) late-type Markarian galaxies.
Early. - R(25) = (0.800 ± 0.039)R(J) + (0.140 ± 0.031), r = 0.774 ± 0.038, N = 277.
Late. - R(25) = (0.852 ± 0.019)R(J) + (0.085 ± 0.013), r = 0.880 ± 0.020, N = 584.
 |
 |
Figure 7. Comparison of the measured blue axial ratios with HYPERLEDA for (a) early morphological type and (b) late morphological type Markarian galaxies. The best linear fit and 1:1 lines are plotted. |
The Markarian galaxies axial ratios in HYPERLEDA and our measurements have no significant differences.
2.3.6. Apparent Jpg (Blue) and Fpg (Red) Magnitudes
According to previous determinations, the LF of Markarian galaxies resemble those of field galaxies (Huchra & Sargent 1973; Huchra 1977; Xu et al. 1988) and represent of 6% - 11% of field galaxies. This percentage depends strongly on the absolute luminosity of the galaxies, and there are large uncertainties since the apparent magnitudes and redshifts are based on limited samples. In this database we provide our measurements of the apparent blue and red magnitudes for all Markarian objects with improved accuracy and in a homogeneous manner.
The magnitudes of the galaxies were measured from the POSS-II and UKSTU photographic survey plates that are available at STScI and used for the construction of the GSC-II catalog (McLean et al. 1998). These magnitudes of the stars on these plates were calibrated by observing stellar CCD sequences in every field (Bucciarelli et al. 2001). In order to measure the magnitudes of nonstellar objects, it was necessary to use a technique to derive the nonlinear intensity to photographic density transformation so that one can integrate in intensity units. It should be stressed that the photometric calibrations techniques used in the GSC-II (the all-sky catalog derived from the DSS images), or PSF growth techniques (e.g., Bacher et al. 2005) are applicable only to stars and not galaxies.
We have implemented a modification of the technique developed by the APM group (Bunclark & Irwin 1983), to internally calibrate photographic plates using the measured stellar profiles. This is an iterative process, which as a by-product determines the photographic density-intensity (D-I) function for that plate. By adding a step to this iterative process of a least-squares fit of the derived magnitudes of the GSC-II stars in the field to their catalog magnitudes we effectively constrain the calibration to be linear and with a determined zero point. One can then take the D-I function and zero point to integrate the intensity within the isophotal contours of the galaxy and convert that to a magnitude. In cases where we were unable to automatically deblend overlapping objects in software, a manual procedure was used to mark a boundary between objects in order to assign the pixel's surface brightness to the correct object. This does not eliminate measurement errors due to the saturation that can occur in the nuclei of the brighter galaxies or possible field effects where the D-I response varies over the plate. The blue and red apparent magnitudes of Markarian galaxies were measured from the Jpg and Fpg-band images of the objects in homogeneous way at the isophote corresponding to 3 times the background rms noise, which is approximately 25.2 mag arcsec-2.
Even though a large number of surface or aperture photometry studies have been carried out over the last 3 decades, only a fraction of the Markarian sample has published magnitudes. In addition, comparisons among these data are complicated since most data have been obtained using different telescopes and reduced with different methods. One of the best and most homogeneous photometric studies of Markarian galaxies that includes data for 196 objects was published by Huchra (1977). We chose to use this sample in order to test our techniques. For the galaxies included in his Table 2 of integrated properties, we compare our Jpg magnitudes as well as (Jpg - Fpg) colors with his B integrated magnitudes and (B - R) colors. A number of Markarian galaxies with multicomponent structure (e.g., Mrk 86, 116, etc.) have been excluded from the comparisons. Figure 8 shows the relation between (a) magnitudes and (b) colors. The dependence between magnitudes and color systems can be fitted with linear regressions, which have the following forms and coefficients of correlation, respectively:
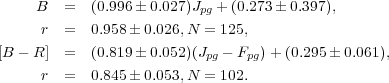 |
The mean absolute differences between the Huchra (1977) B and our Jpg magnitudes is 0.28 ± 0.18 and Huchra (1977) (B - R) and our (Jpg - Fpg) colors is 0.16 ± 0.12. These minor differences are reasonable given the uncertainties associated with Huchra's aperture corrections (his largest apertures were, on average, slightly smaller than the effective diameter of our outer isophotes), and the fact that the photometric systems are slightly different (Sandage vs. Johnson-Kron-Cousins). Among the galaxies with larger magnitude and/or color differences, there are interacting systems (e.g., Mrk 325, 333), edge on galaxies (e.g., Mrk 416, 479, etc.), and galaxies with extended low surface brightness outer structures (e.g., Mrk 391, 430, etc.), which can account for the errors.
 |
|
 |
|
Figure 8. (a) Comparison of the measured Jpg and Huchra (1977) B apparent magnitudes. (b) Comparison of the (Jpg - Fpg) colors with Huchra (1977) (B - R) colors. The best linear fit and 1:1 lines are plotted. |
Overall, our magnitude measurements are in good agreement with Huchra (1977) and give us an independent estimate of our error to be ~ 0.3 mag. Using the total sample of Markarian galaxies we employ V / Vmax and log N versus limiting magnitude methods to examine the completeness of this sample at increasing limiting m(Jpg) and m(Fpg) magnitudes. We conclude that the Markarian galaxy sample is incomplete at m(Jpg) > 15.2, and at m(Fpg) > 14.3. This estimate of completeness is in good agreement with MB86.
It is well known that the (B - R) color of galaxies depends on their morphological type (e.g., Jansen et al. 2000). In this respect, a comparison of our measured blue and red magnitudes of Markarian galaxies is done for the samples of early (elliptical, S0, S0/a) and late (spiral and irregular) galaxies separately. The mean color difference for early- and late-type Markarian galaxies, respectively, are 1.24 ± 0.28 and 1.11 ± 0.33, which are typical values for similar morphological type galaxies (e.g., Jansen et al. 2000).
A comparison of our Jpg band magnitude measurements with HYPERLEDA B-band magnitude determinations was also conducted separately for the early- and late-type Markarian galaxies. In this comparison we include all Markarian galaxies excluding only multicomponent objects. Figure 9 compares HYPERLEDA B and our Jpg magnitudes for (a) early-type and (b) late-type galaxies. The calculated transformations are as follows:
Early. - B = (0.984 ± 0.031)Jpg + (0.523 ± 0.446), r = 0.862 ± 0.027, N = 357.
Late. - B = (0.999 ± 0.019)Jpg + (0.272 ± 0.283), r = 0.880 ± 0.017, N = 832.
 |
 |
Figure 9. Comparison of the Jpg apparent magnitudes with HYPERLEDA B for (a) early morphological type and (b) late morphological type Markarian galaxies. The best linear fit and 1:1 lines are plotted. |
The mean absolute differences of the HYPERLEDA B and our Jpg magnitudes, respectively, for the early- and late-type Markarian galaxies are 0.39 ± 0.34 and 0.40 ± 0.38. For 68% early-type and 70% late-type Markarian galaxies the HYPERLEDA B and our Jpg magnitude difference is less than 0.5 mag and, respectively, for 6% and 10% galaxies this difference is greater than 1.0 mag. The 0.2 - 0.5 mag internal error of our measurements has its contribution on individual differences but the following factors also affect the residuals.
The apparent total B magnitudes in HYPERLEDA are reduced to the RC3 system for standard 25 mag arcsec-2 isophotal level. Our Jpg magnitudes are determined at the 25.2 mag arcsec-2 isophotal level. This 0.2 mag difference in the lowest isophotal level can have a significant effect on the integrated Jpg magnitudes. In HYPERLEDA, a growth curve fitting method was used to transfer determined magnitudes from different sources to the RC3 system. While this method derives homogeneous photometric parameters, it ignores the morphology of individual galaxies: the relative brightness of the bulge, disks, arms, active nuclei, etc. (Prugniel & Heraudeau 1998), will introduce errors. This is why there are 72 Markarian galaxies in HYPERLEDA that have B magnitudes fainter than 17 mag even though the FBS (Markarian 1967) had a well-defined limiting magnitude of 17. As discussed in Section 2.3.5, in HYPERLEDA a number of Markarian galaxies have erroneous identification (e.g., Mrk 586, 902, 1154, etc.). These galaxies have large (Jpg - B) residuals. Some of the galaxies with large (Jpg - B) residuals are objects in close interaction (e.g., Mrk 109, 220, 582, etc.). The presence of close neighbors can introduce a larger error in either our or HYPERLEDA magnitude determinations if they are not properly separated by the software algorithms. Similarly, galaxies with projected stars (e.g., Mrk 327, 498, 689, etc.) can introduce errors in either our or HYPERLEDA magnitude determinations if they are not properly treated by the software algorithms.
The position angles (P.A.) of the major axes were determined at the same (25.2 mag arcsec-2) isophotal level as the angular diameter and magnitude measurements. P.A. is measured from the north (P.A. = 0°) toward east between 0° and 180°. Similar to Sections 2.3.4 and 2.3.5, the P.A. were reduced to a single uniform system. We compared the red and blue results for all three subsamples (Fig. 10) with the result that there are no significant differences or dependence on the morphological class of the objects.
 |
 |
 |
|
Figure 10. Comparison of the measured blue and red position angles for (a) early morphological type, (b) late morphological type, and (c) compact morphological type Markarian galaxies. The best linear fit and 1:1 lines are plotted. |
|
A comparison of our P.A. blue measurements for Markarian galaxies with HYPERLEDA determinations for the same objects has been done and is shown in Figure 11. Despite a large scatter, the dependence between our and HYPERLEDA's P.A. measurements can be fitted in with the linear regression, which has following form and coefficient of correlation:
 |
The mean absolute difference between the HYPERLEDA's and our blue P.A. for Markarian galaxies is 12.2° ± 15.4°, which is approximately twice larger than difference between our blue and red P.A. measurements. For most Markarian galaxies, the P.A. in HYPERLEDA and our measurements are not significantly different. There are several possible reasons for the large scatter:
 |
Figure 11. Comparison of the measured blue position angles with HYPERLEDA. The best linear fit and 1:1 lines are plotted. |
The overall relationship between Markarian galaxies and their local environment has been discussed by Gisler (1978) and Petrosian & Turatto (1986a, 1986b) and studied in more detail for a subsample of Markarian AGNs (e.g., Petrosian 1982; Dahari 1985; MacKenty 1989, 1990; Laurikainen & Salo 1995; De Robertis et al. 1998) with some controversial results. In order to address some of these issues and deal with random projection effects in a statistical manner, we systematically counted the neighboring galaxies around each Markarian galaxy to build a homogeneous data set for analysis. These counts of neighboring galaxies were done for all Markarian objects that have determined redshifts z > 0.005 by projecting a circle of 50 kpc radius around each galaxy. All galaxies detected within this circle were counted if their angular sizes differed from that of the Markarian galaxy by no more than factor of 2 (e.g., Karachentsev 1972), and wherever redshifts were available, have a velocity difference within ± 800 km s-1 (e.g., Madore et al. 2004). The counts of neighbor galaxies were checked in the 50 kpc circles extracted from both the Jpg- and Fpg-band images. There were 77 Markarian objects closer than z = 0.005 that were not used because of the difficulty in reliably determining associated objects over a wider field of view as random projections become more dominant.
