


In Figure 12 of the article we show 2' × 2' regions from the digitized QV or EJ images. Each plate shows 100 Markarian objects except for the last one, which shows those galaxies added by M+89 to the final version of the First Byurakan Survey catalog. The order within the plate is given by the Markarian number. The contrast of the images has been adjusted to provide the best subjective compromise between displaying the outer regions of the galaxies and preserving the structure of their inner regions. For completeness, Markarian objects identified as stars are retained in these plates.
 |
Figure 12. 2' × 2' field QV or EJ images for all Markarian objects. North is up, and east is to the left. The order within the plate is given by Markarian galaxies number. The contrast of the images has been adjusted to provide the best subjective compromise between displaying the outer regions of the galaxies and preserving the structure of their inner regions. |
| Figure 12b, 12c, 12d, 12e, 12f, 12g, 12h, 12i, 12j, 12k, 12l 12m, 12n 12o, 12p |
Since we are particularly concerned about the connection between galaxy activity, star formation, and galaxy interactions, we pay special attention to the interacting and merging Markarian galaxies. Mergers and close interacting systems are distinguished as a separate class of objects according to the following definitions (Petrosian et al. 2002):
Merger. - Two or more galaxies are in a common envelope, or the object has double or multiple nuclei. For this class the nuclei have approximately similar brightness. Multiple nuclei are often connected with structural details (spiral arms, jets, tails, etc.). Some of these nuclei may be luminous H II regions that do not necessarily belong to a dynamically distinct in a merger. It is also possible that, similar to clumpy irregulars (e.g., Casini & Heidmann 1976), some objects classified as mergers are irregular galaxies with a large network of giant H II regions. More detailed imaging observations will be required in order to identify such objects and isolate the real mergers among the total listed.
Galaxies in interaction. - Two or more galaxies seen separately but apparently connected with tidal features (tails, bridges, loops, etc.). One or more galaxies in the interacting system can have a disturbed structure. Usually a Markarian galaxy is one component of an interacting system, but there are also cases when an entry in the Markarian catalog is the interacting system itself. Occasionally it is difficult to distinguish a merger from an interacting system, and merger and interacting systems can indeed be classified within the same scheme (e.g., Borne et al. 1999). Nevertheless, for many cases, it was possible to define a morphological class for each of the galaxy forming interacting system.
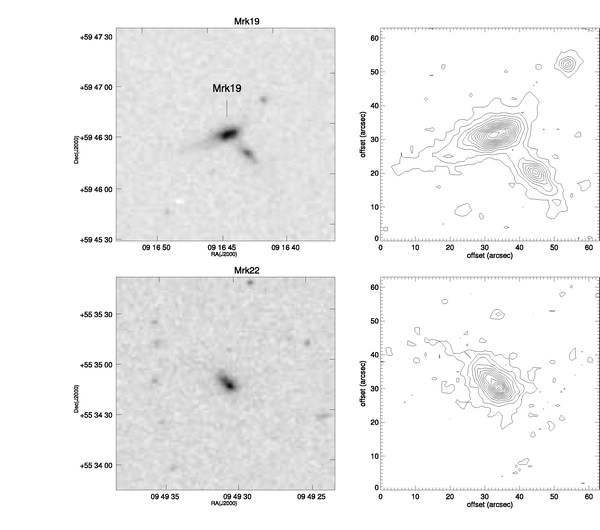
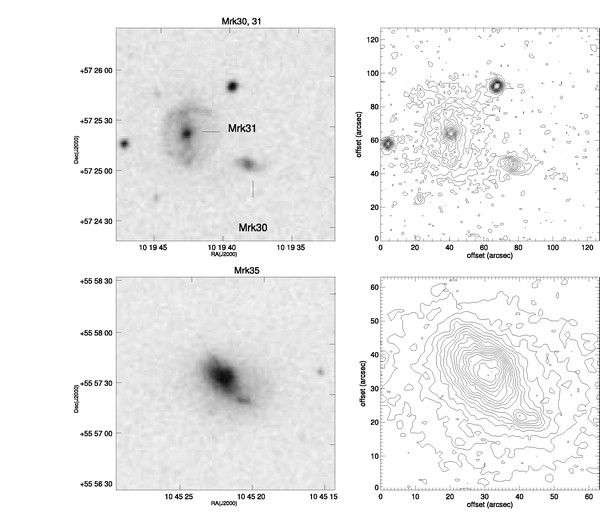
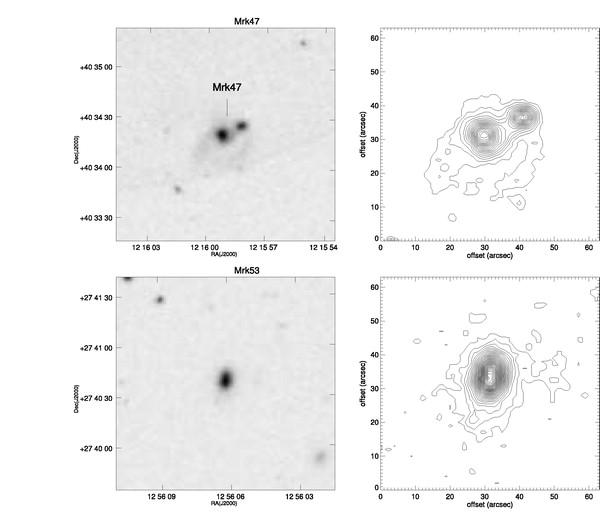
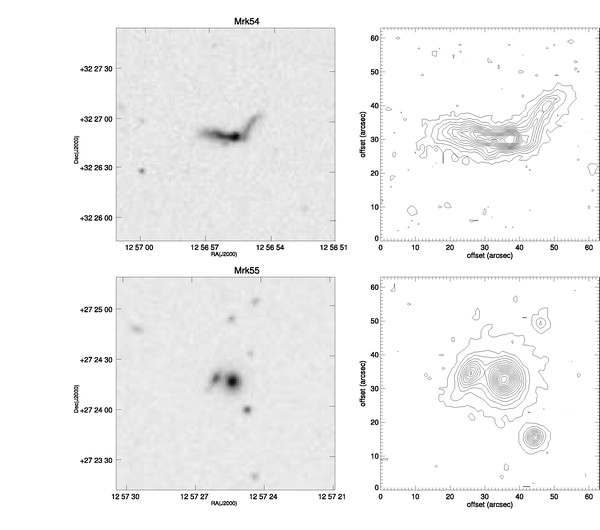
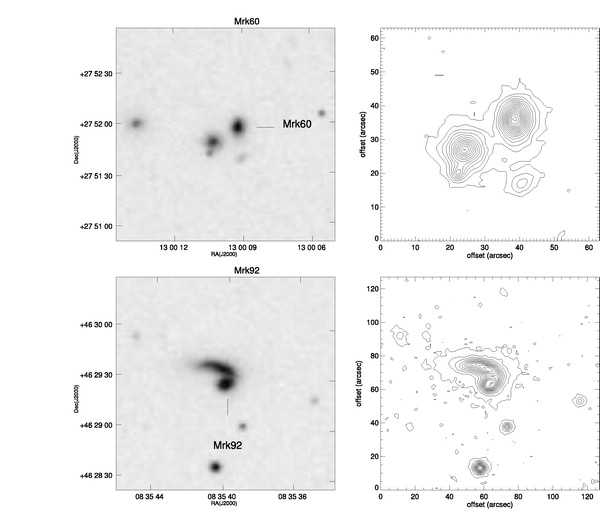
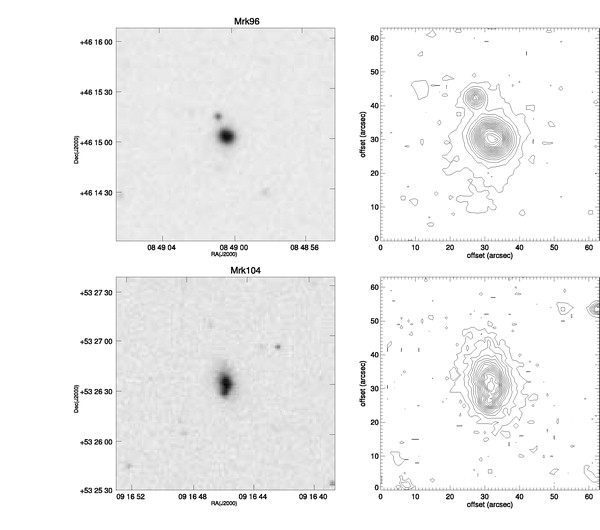
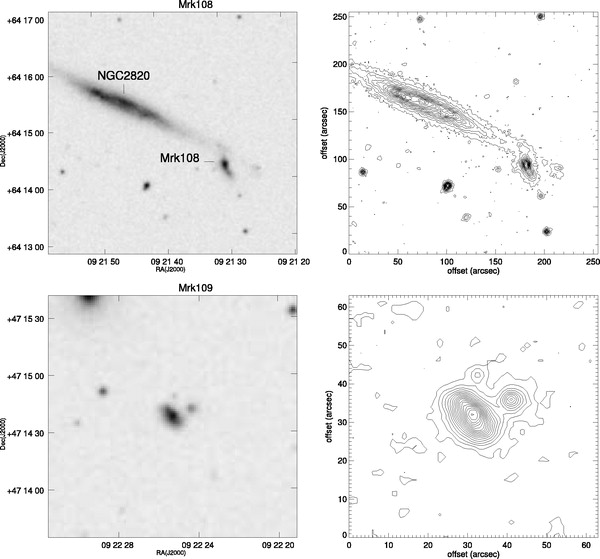
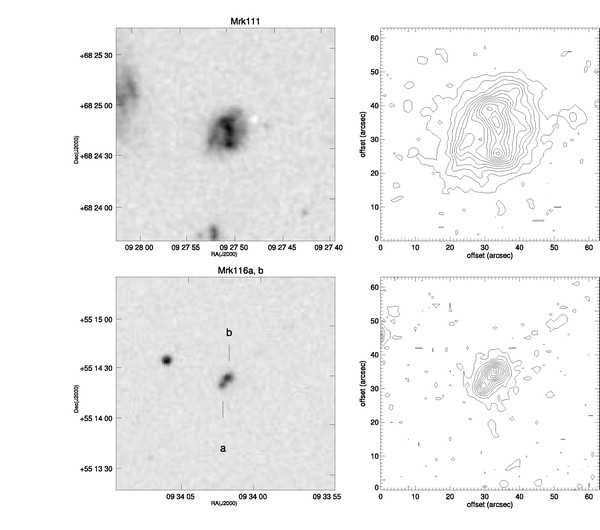
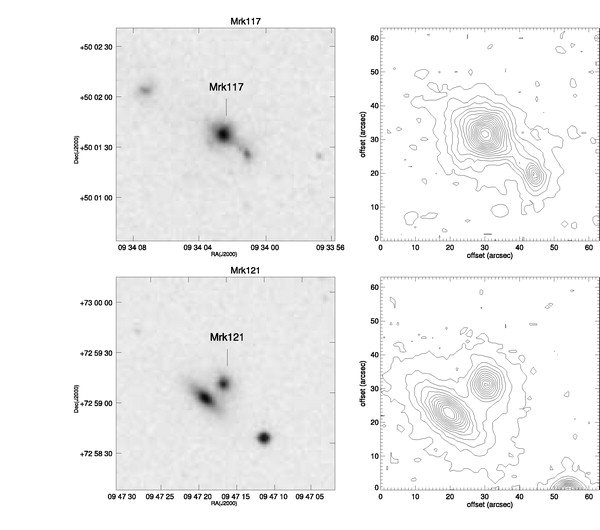
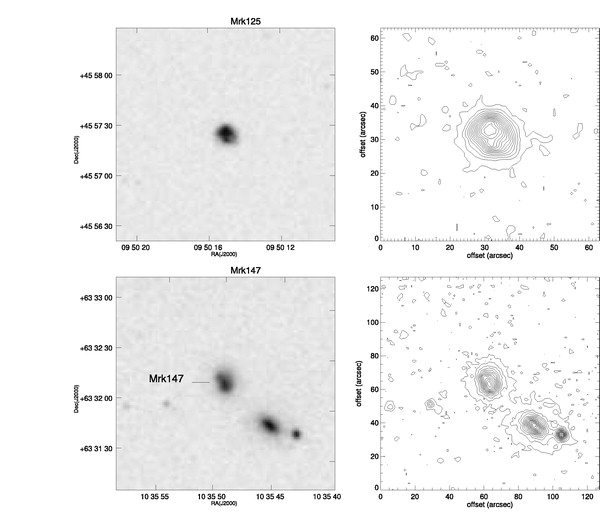
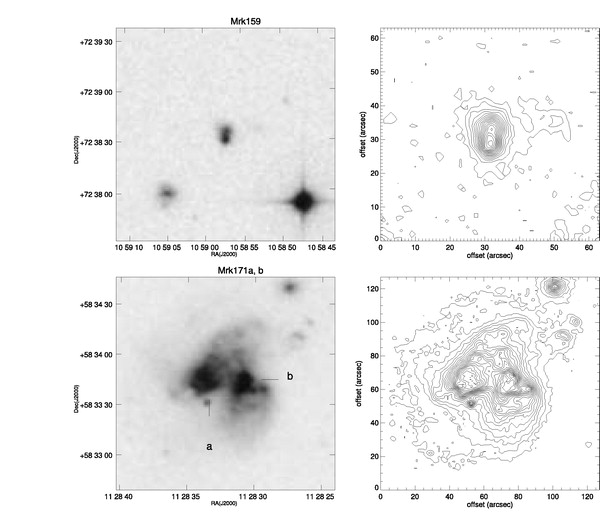
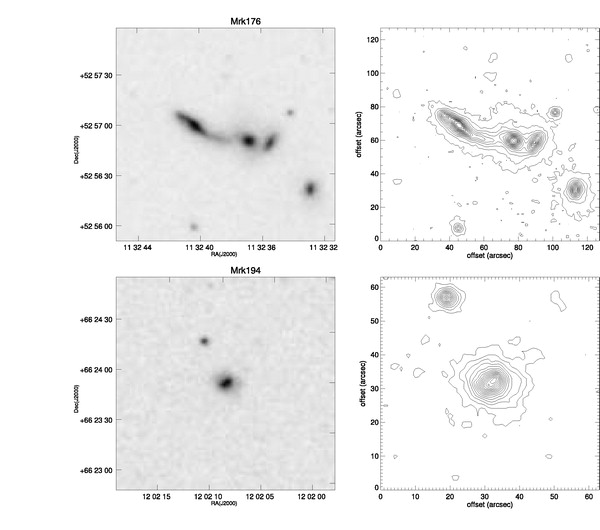
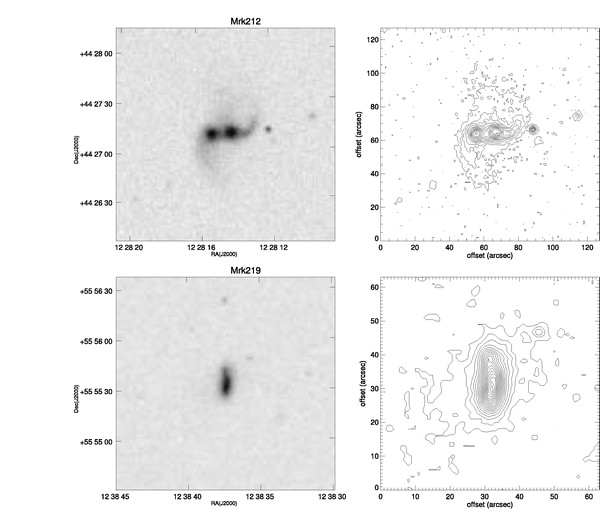
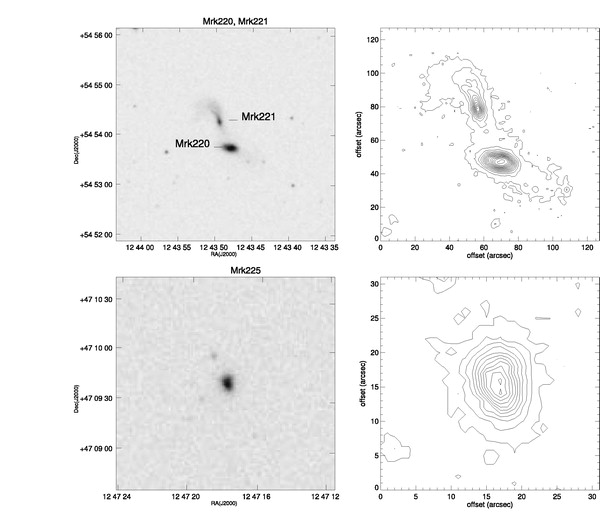
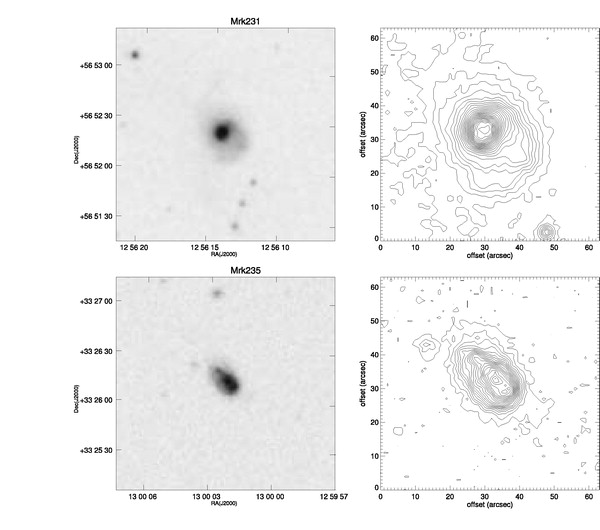
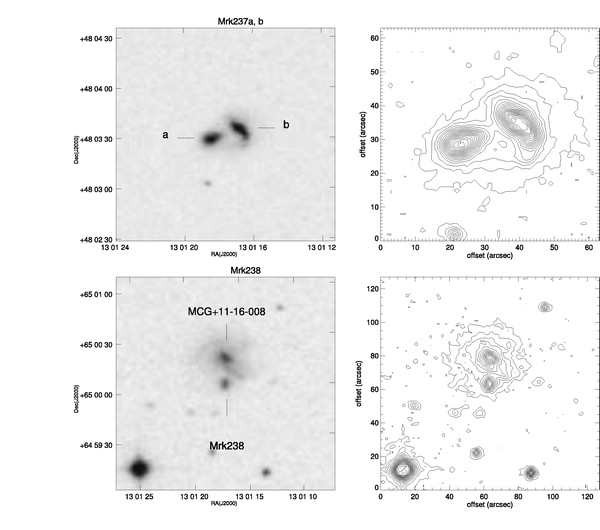
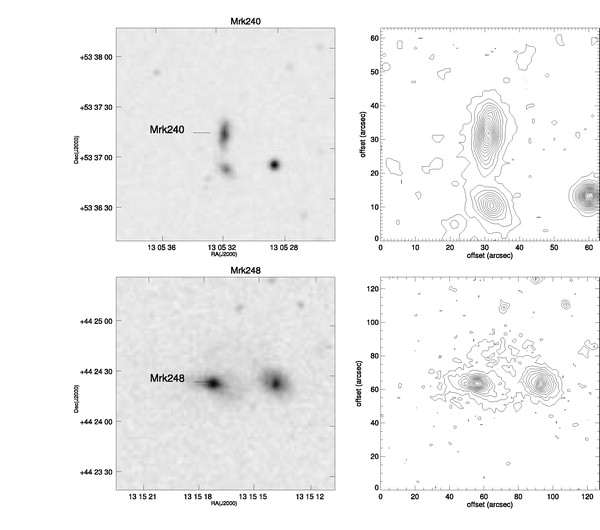
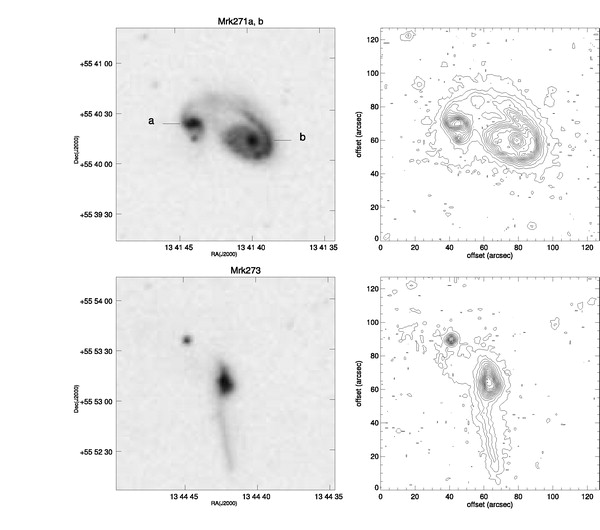
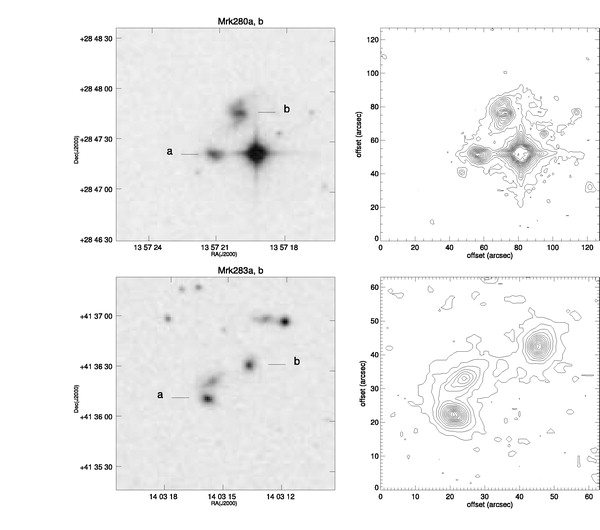
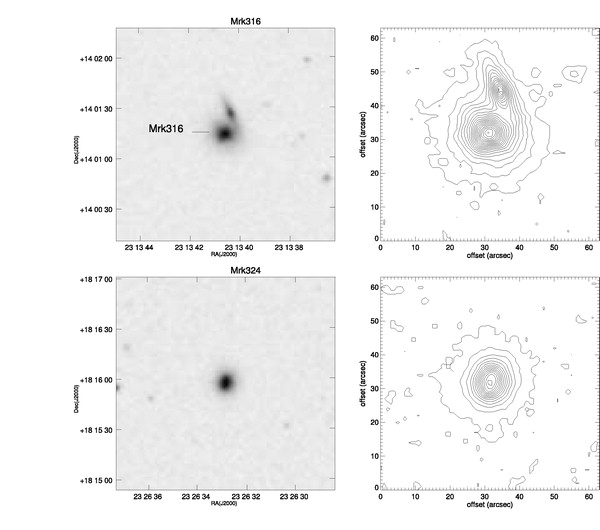
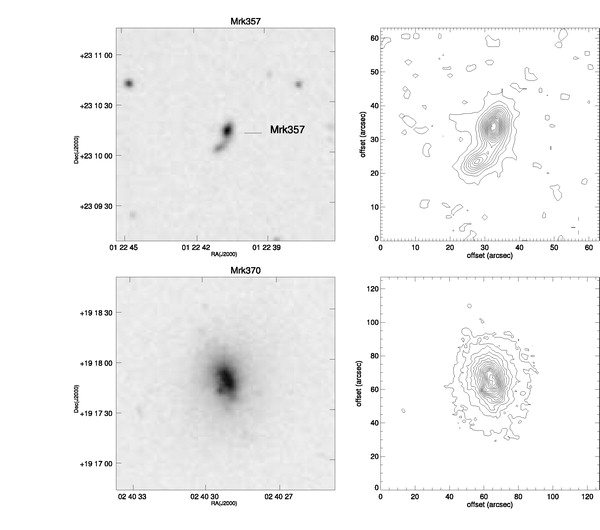
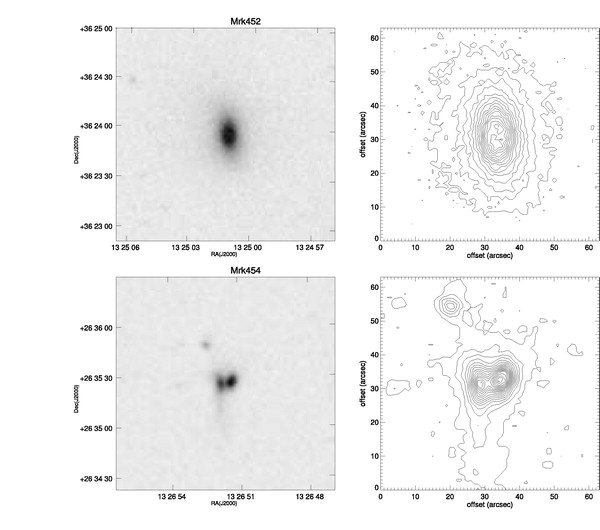
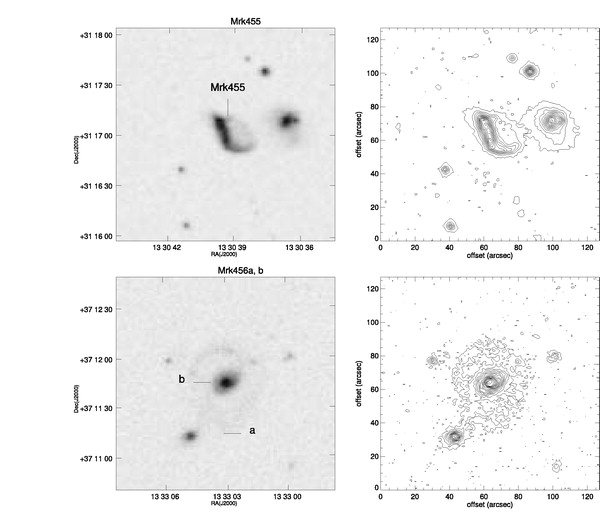
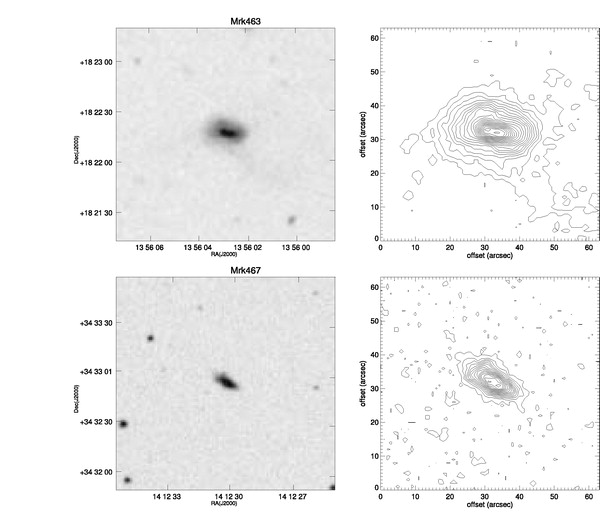
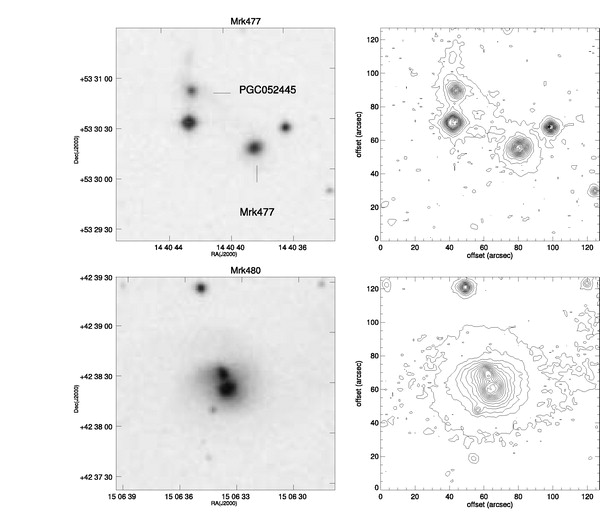
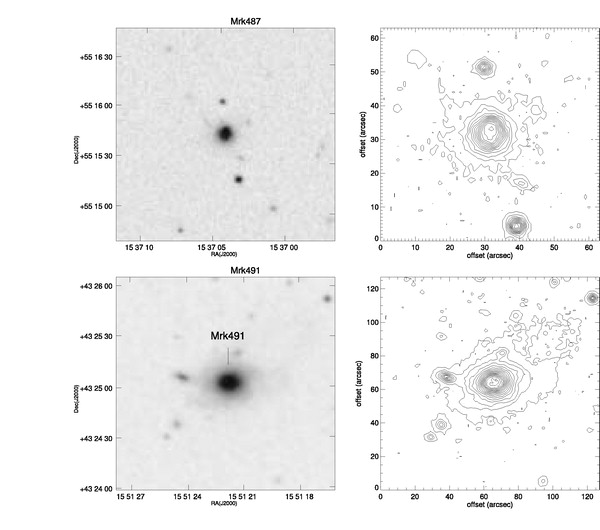
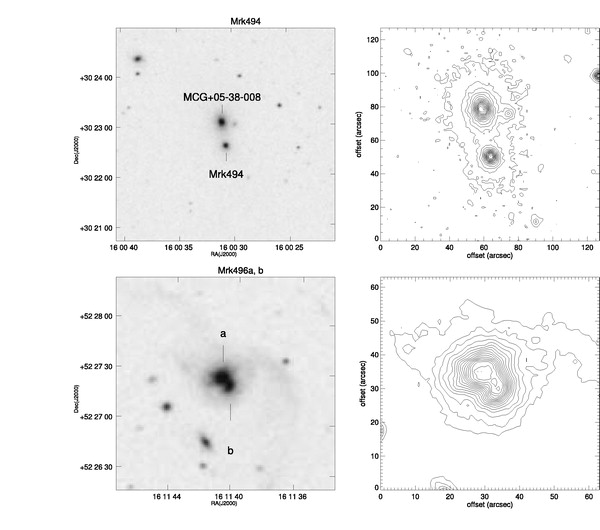
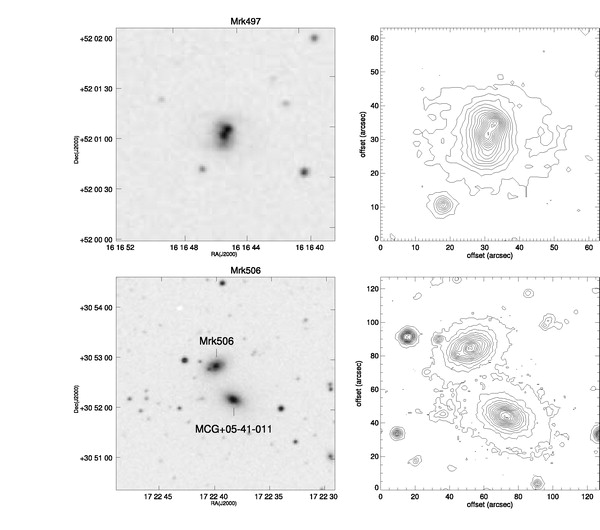
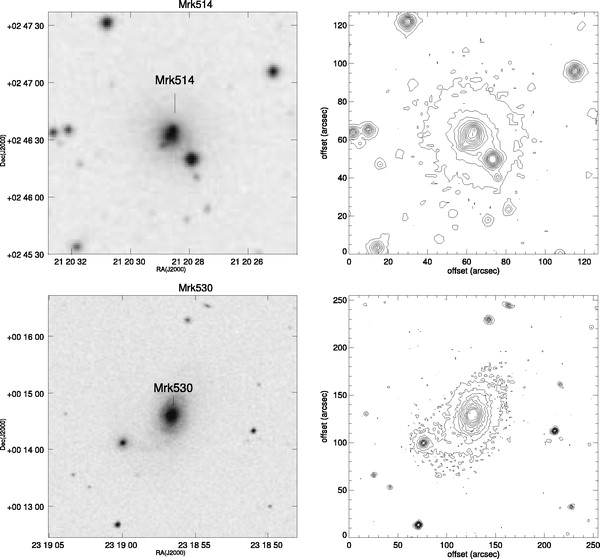
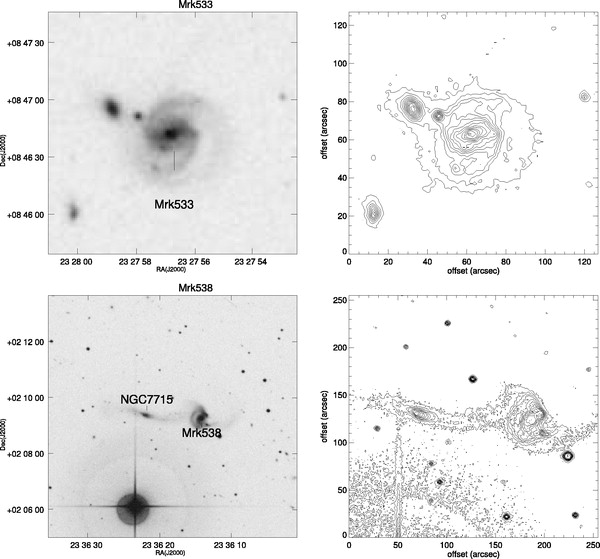
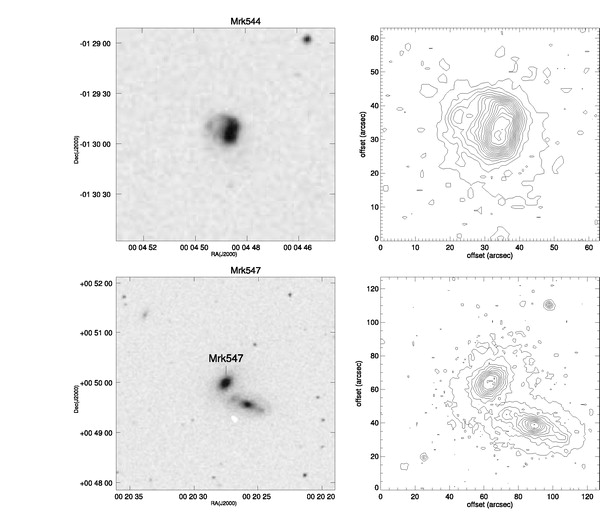
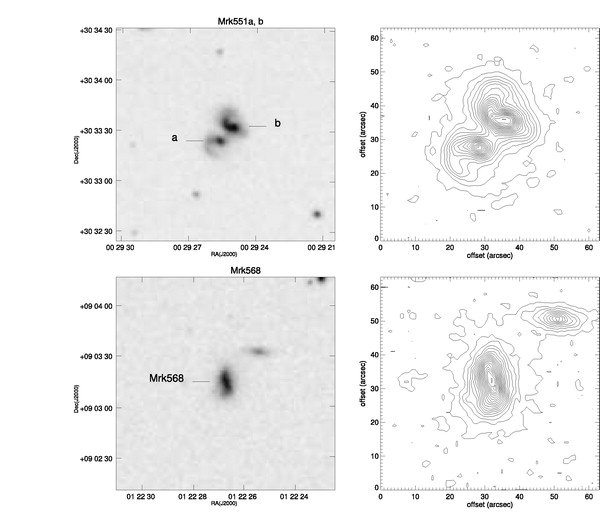
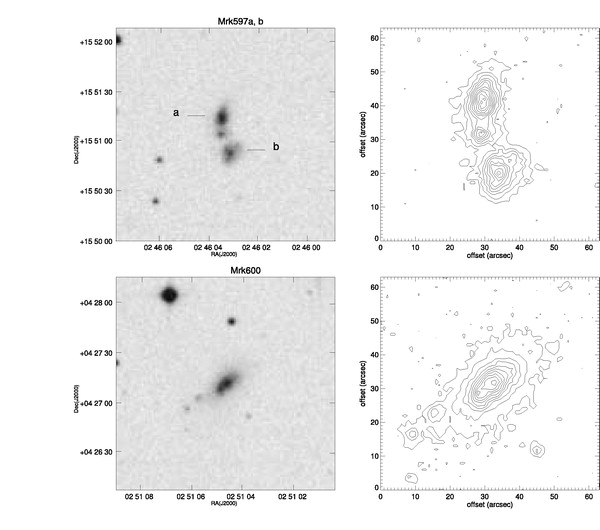
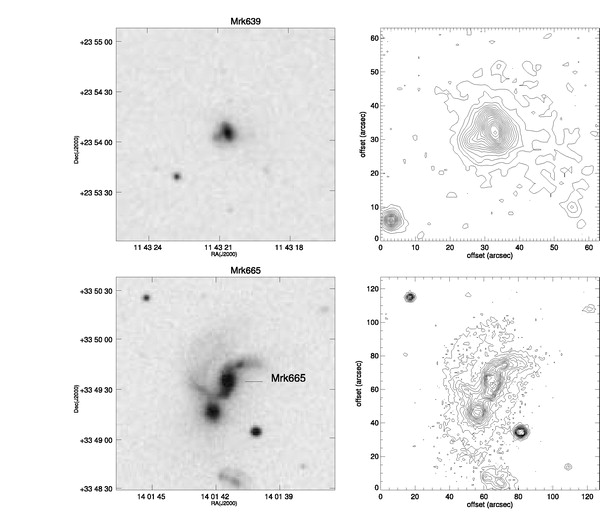
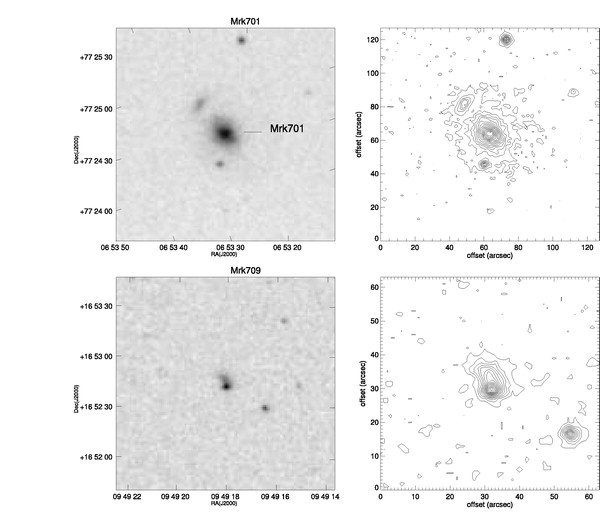
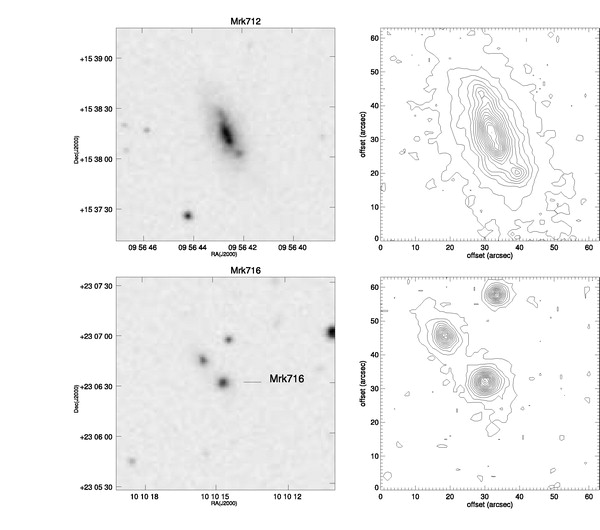
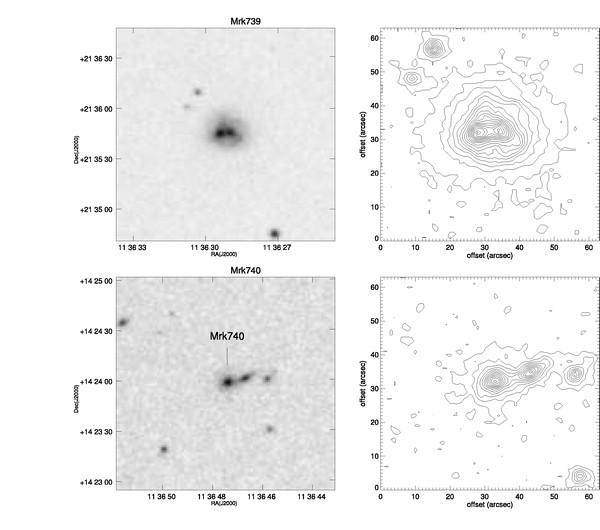
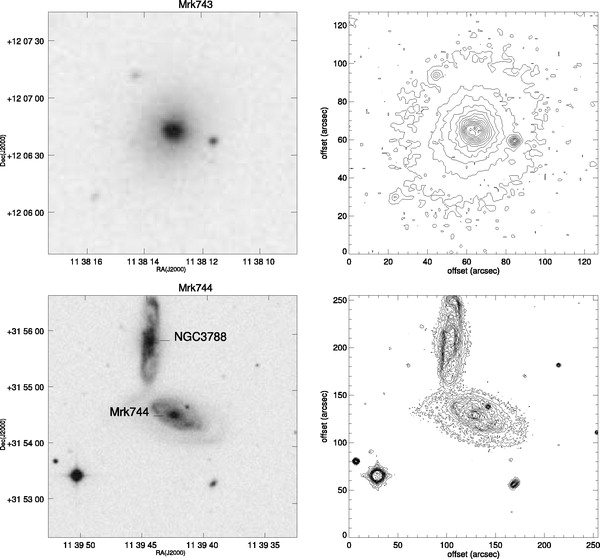
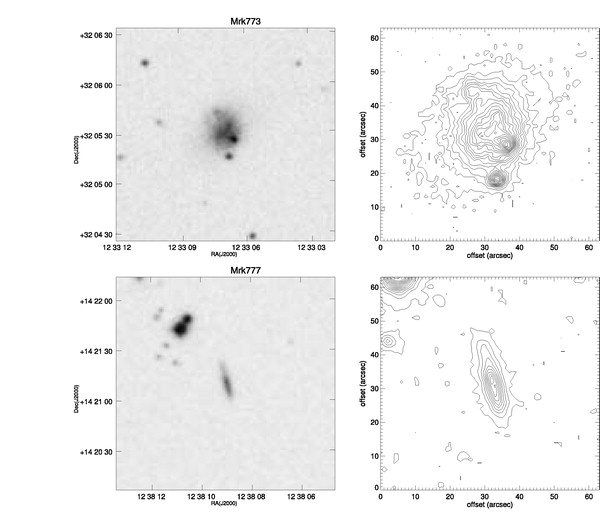
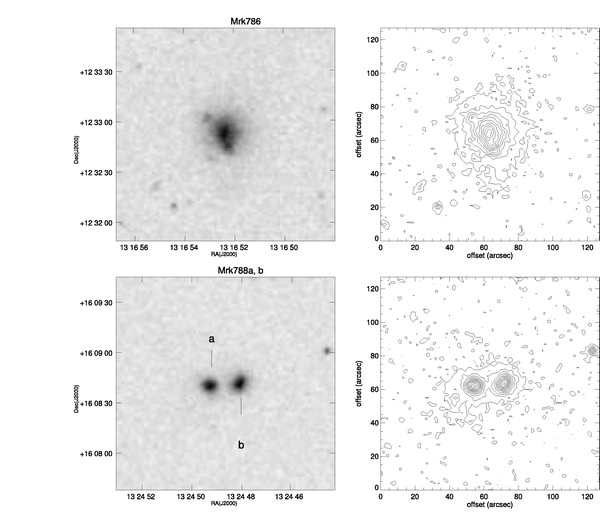
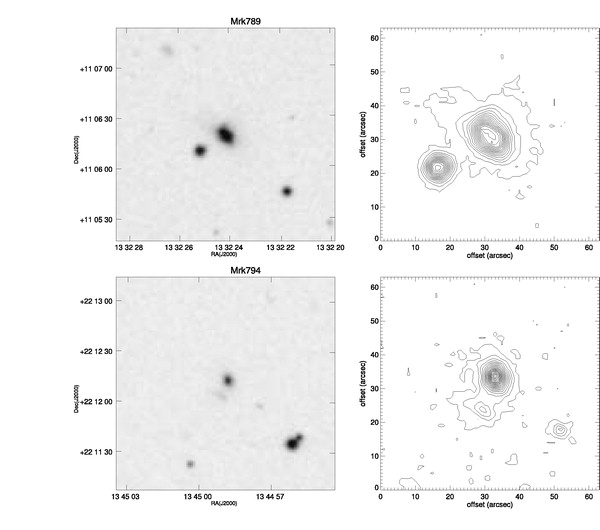
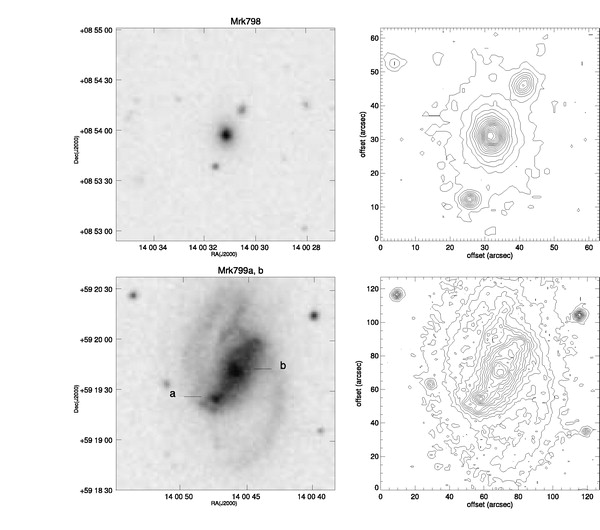
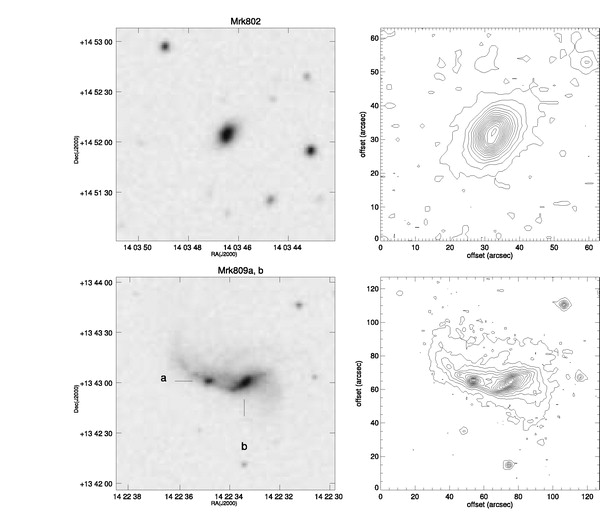
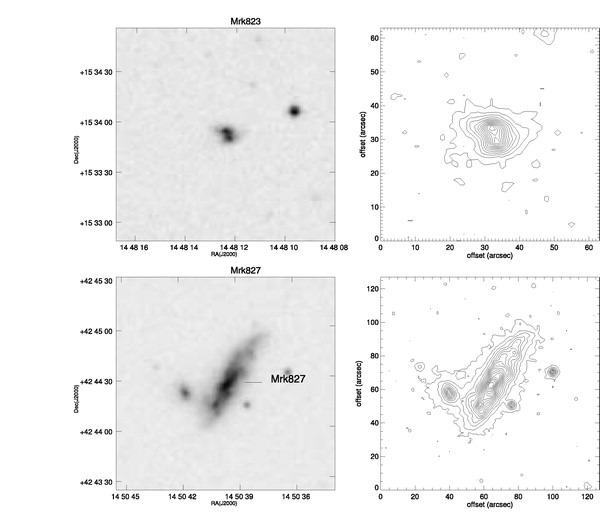
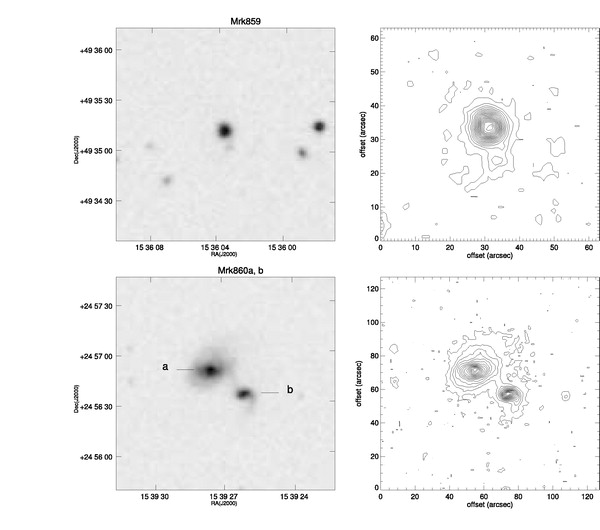
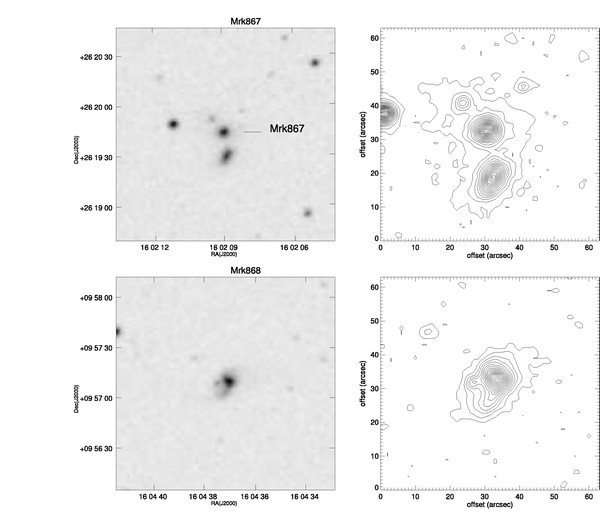
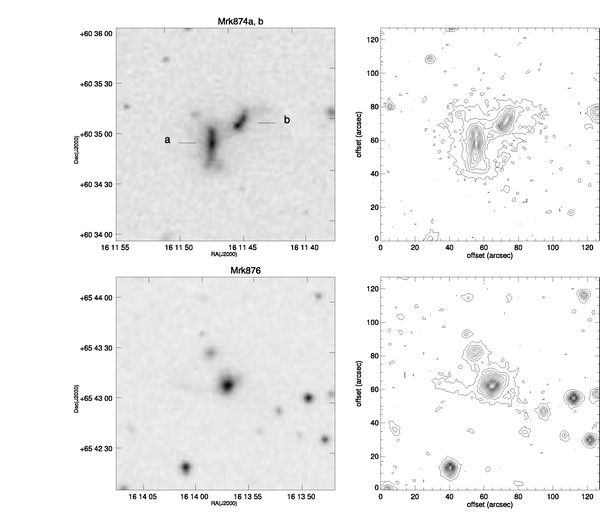
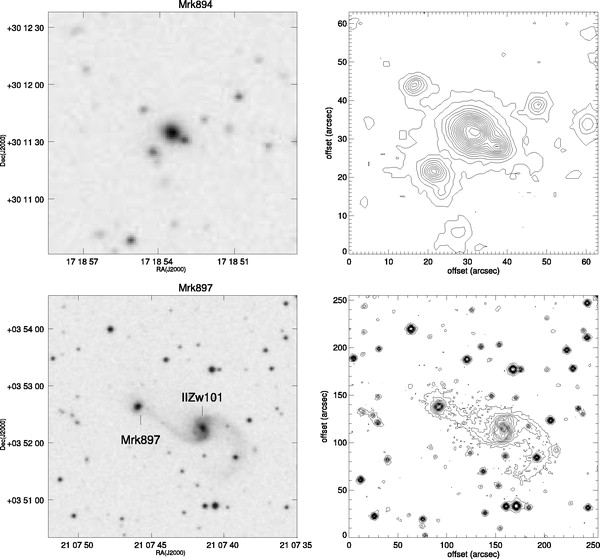
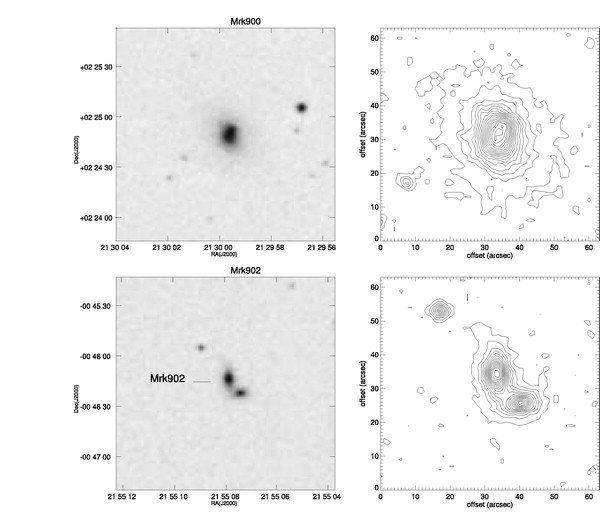
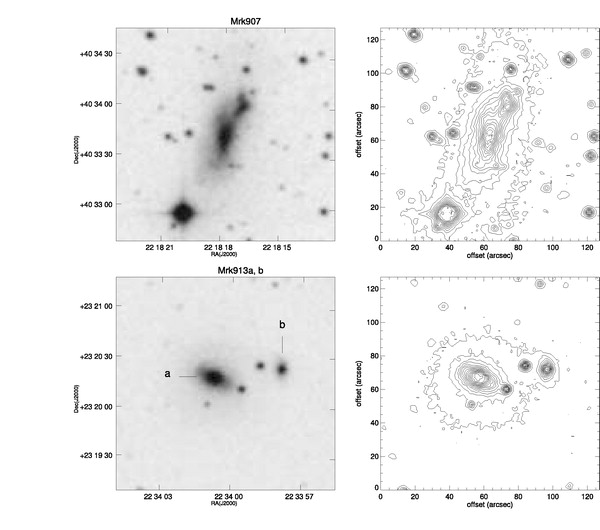
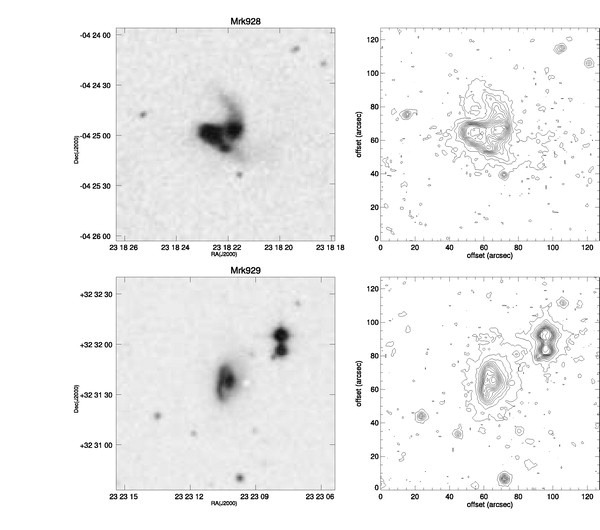
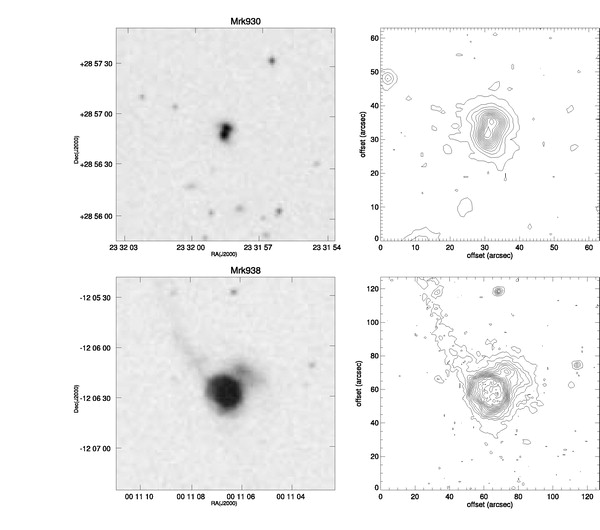
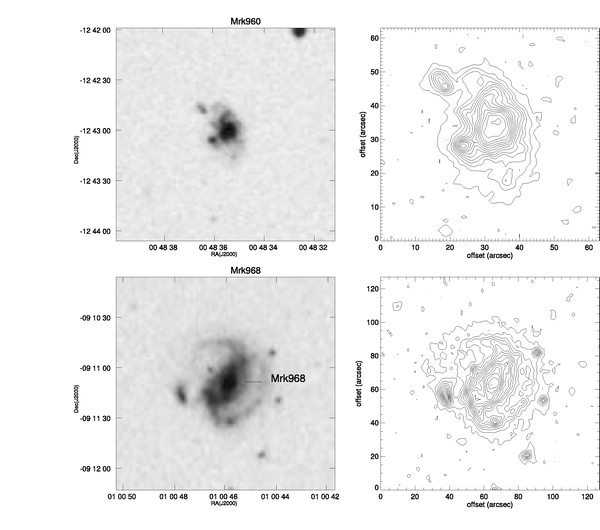
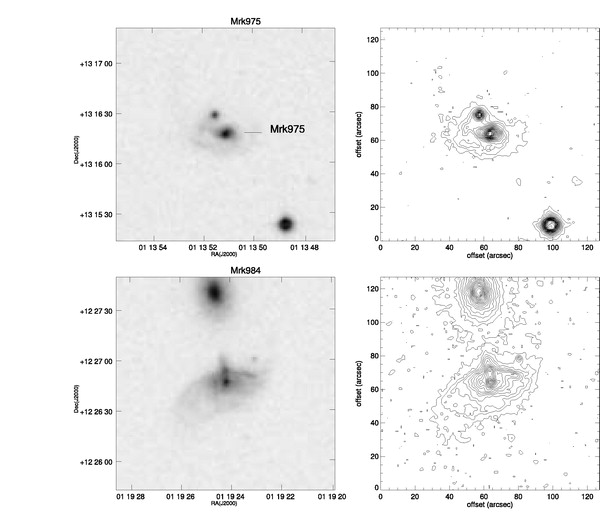
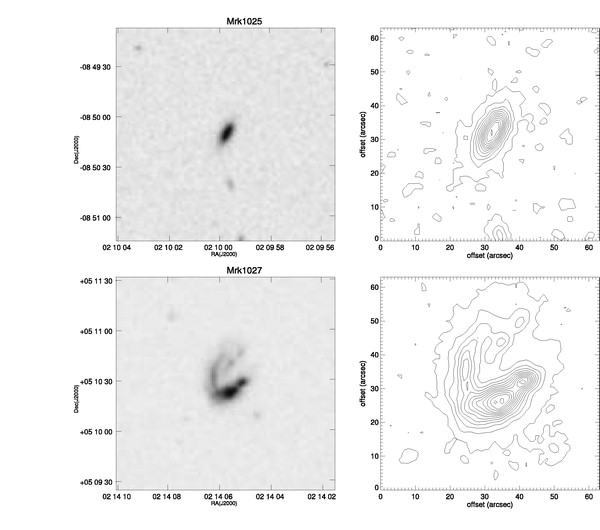
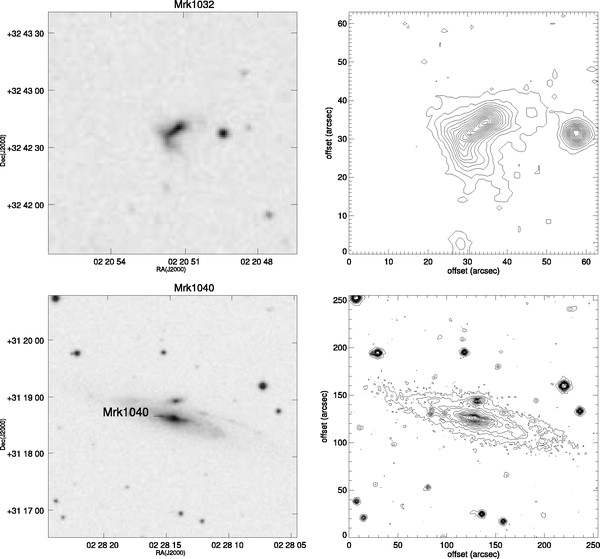
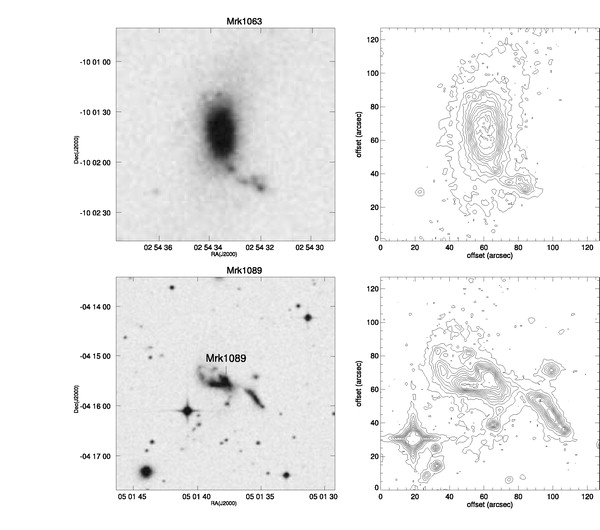
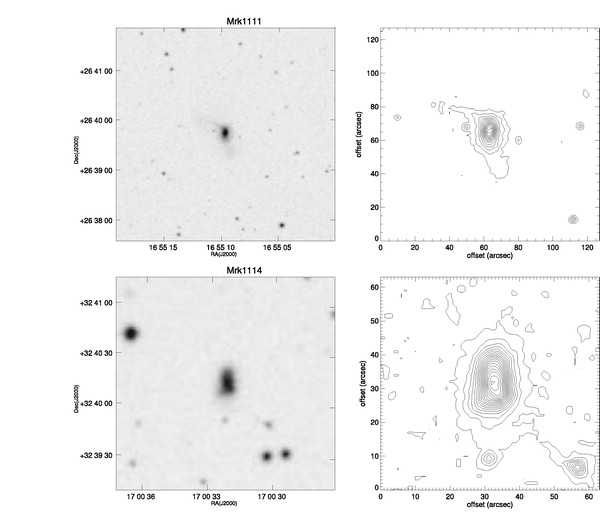
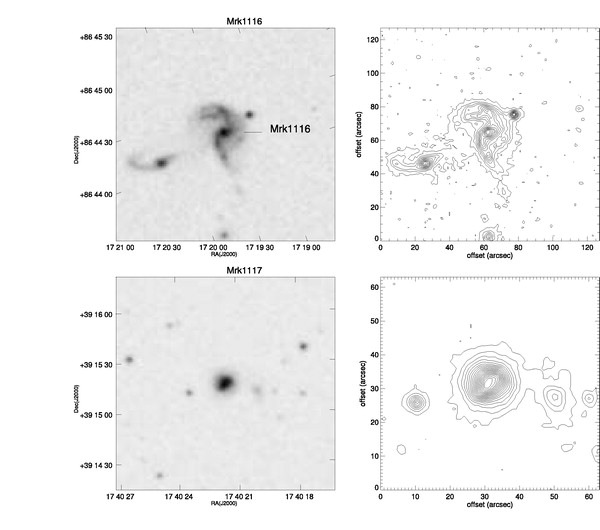
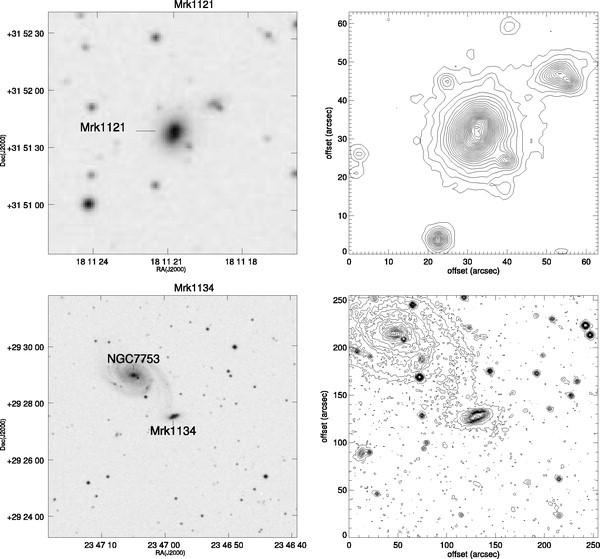
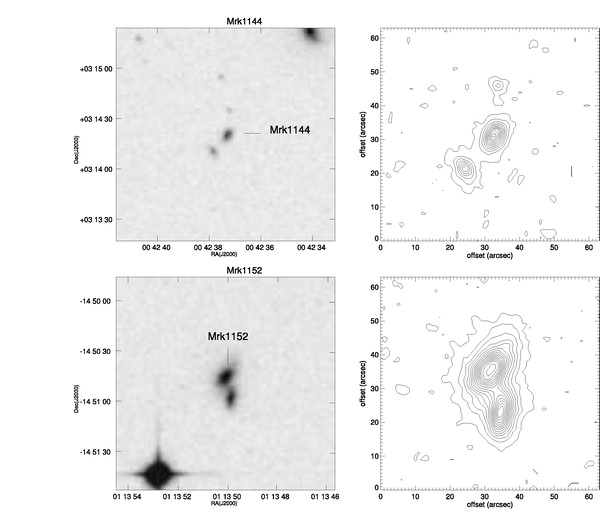
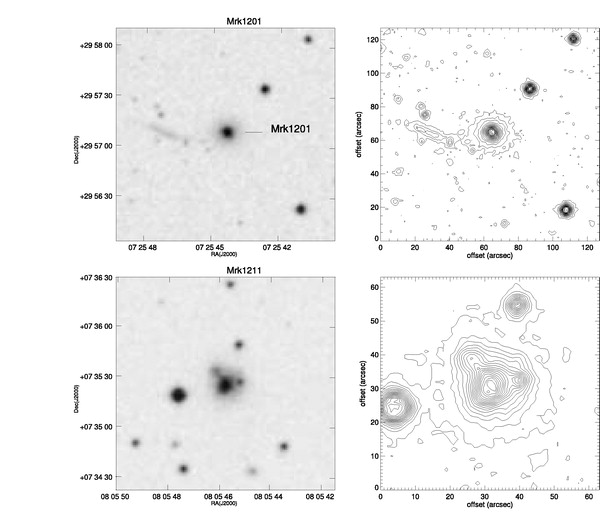
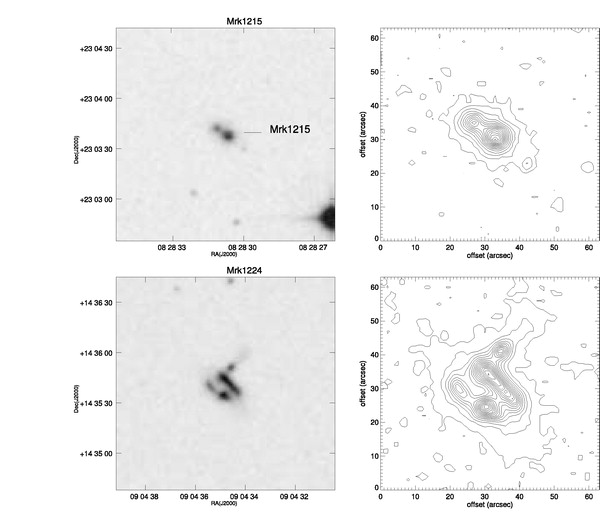
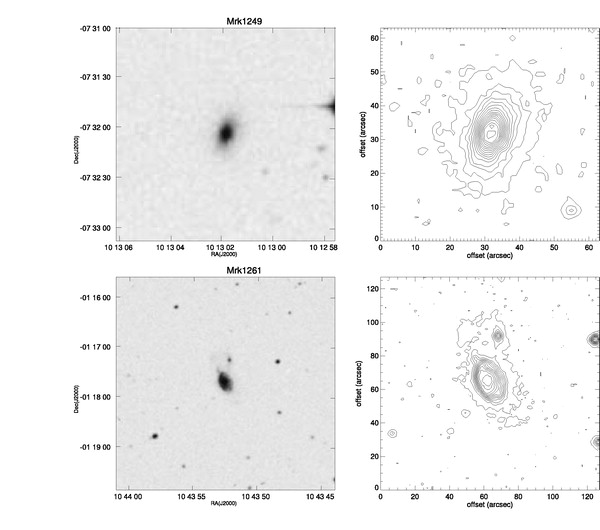
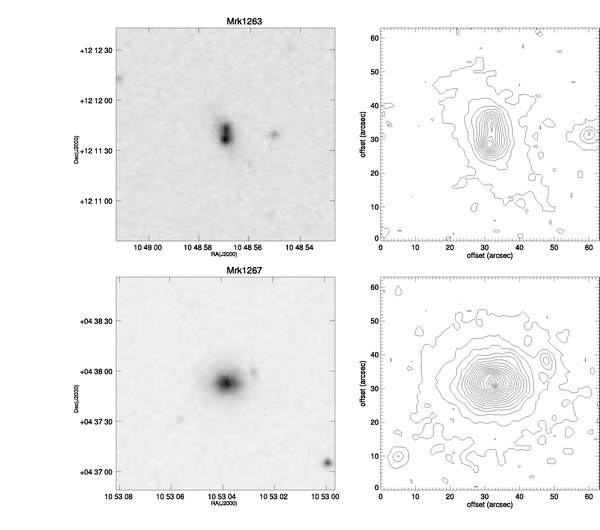
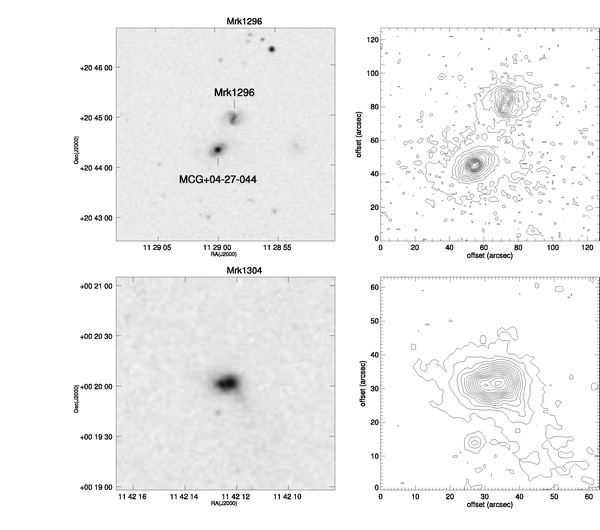
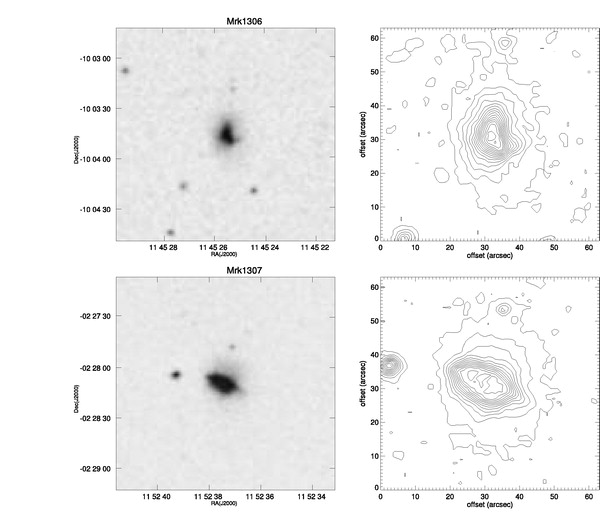
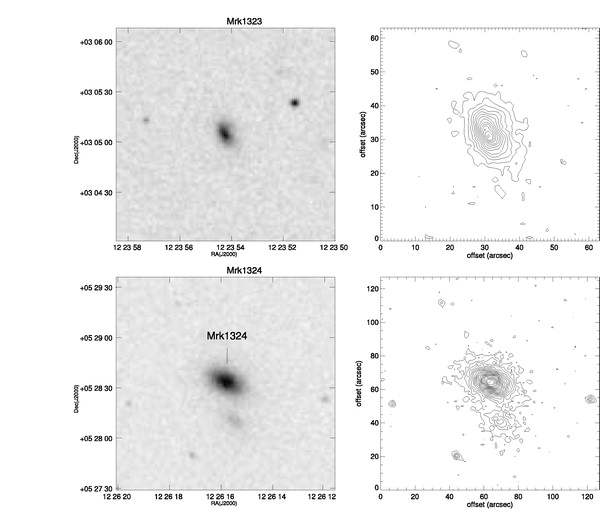
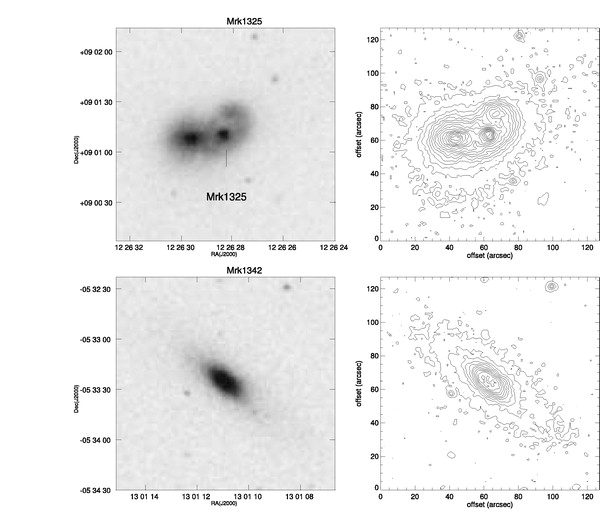
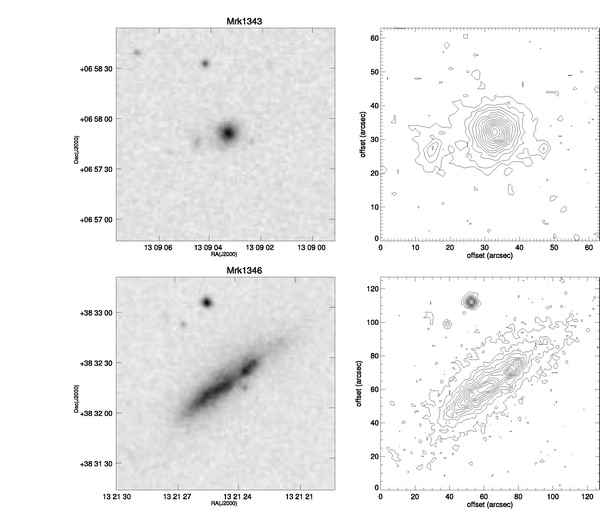
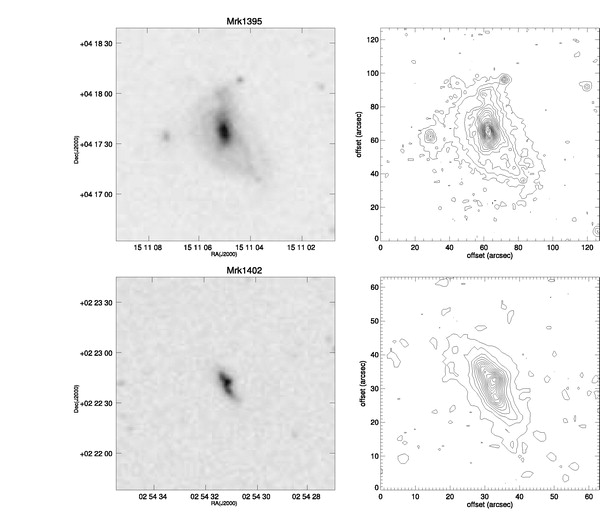
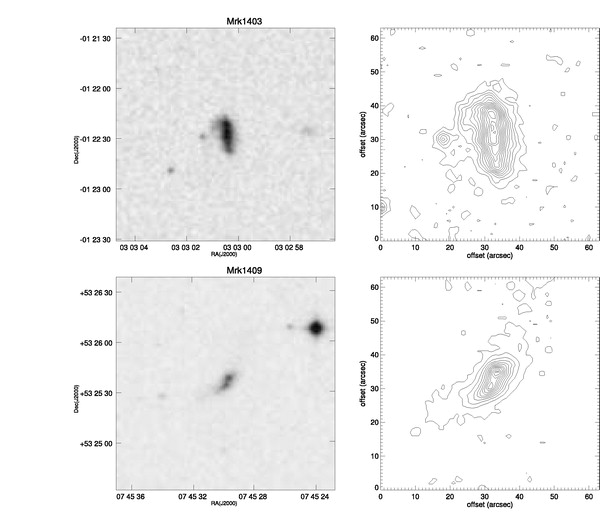
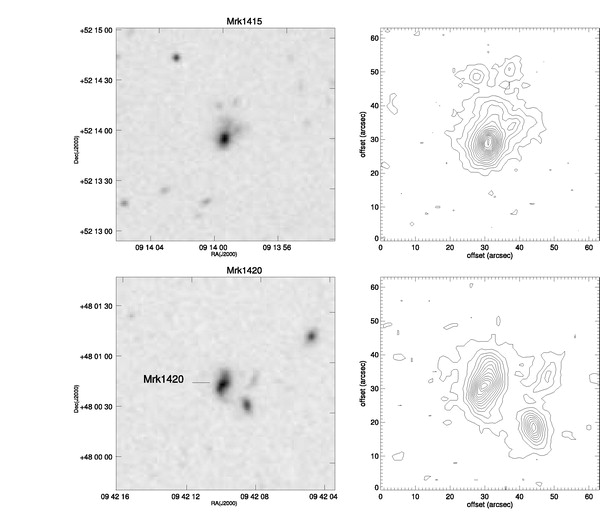
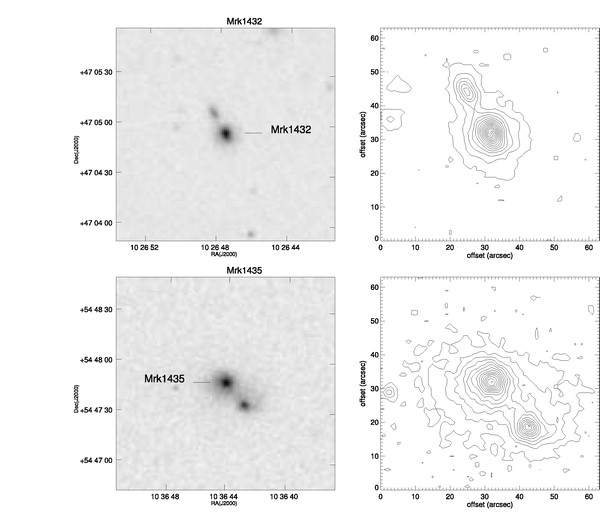
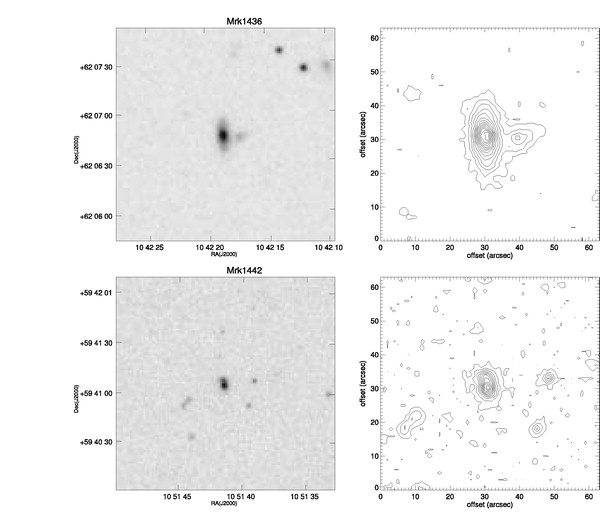
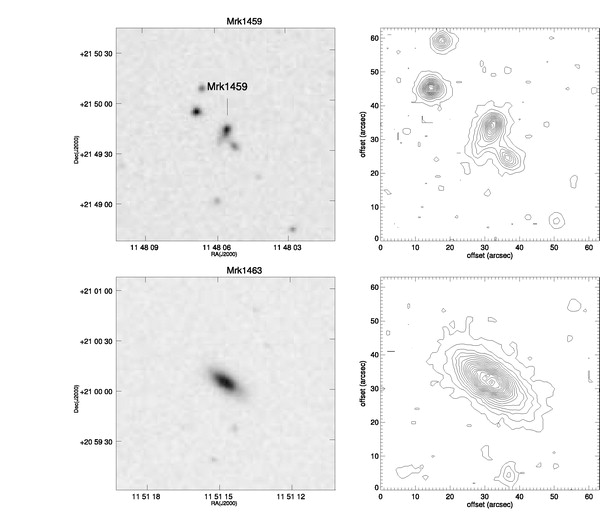
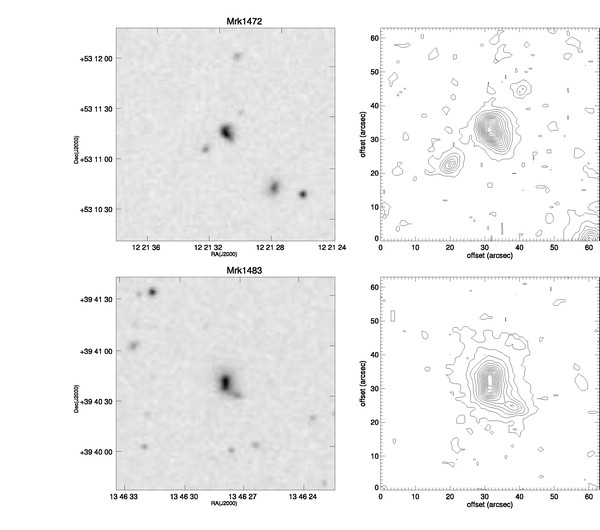
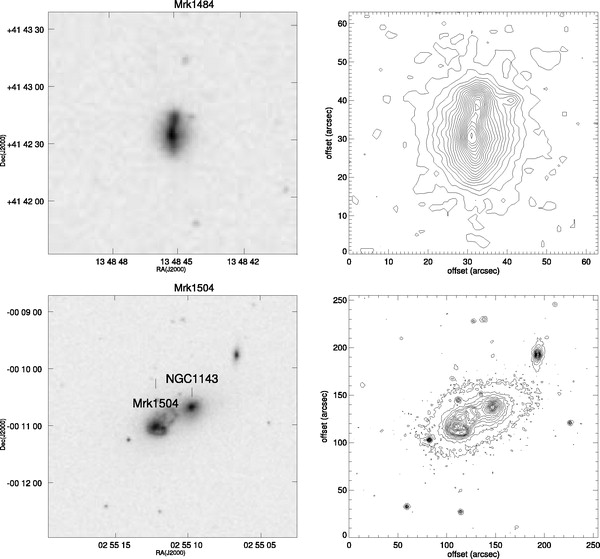
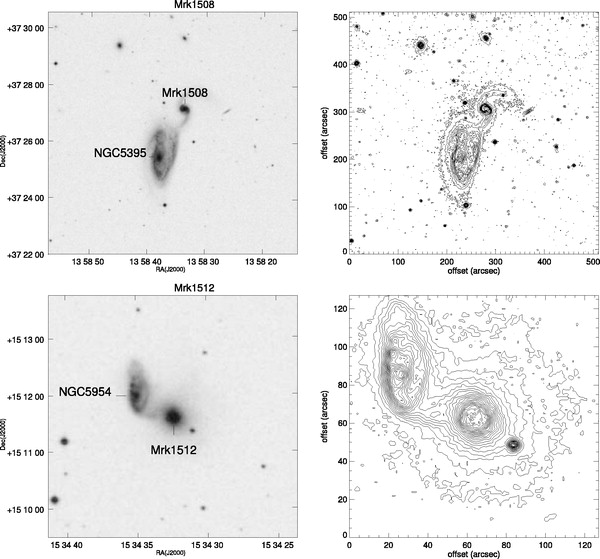
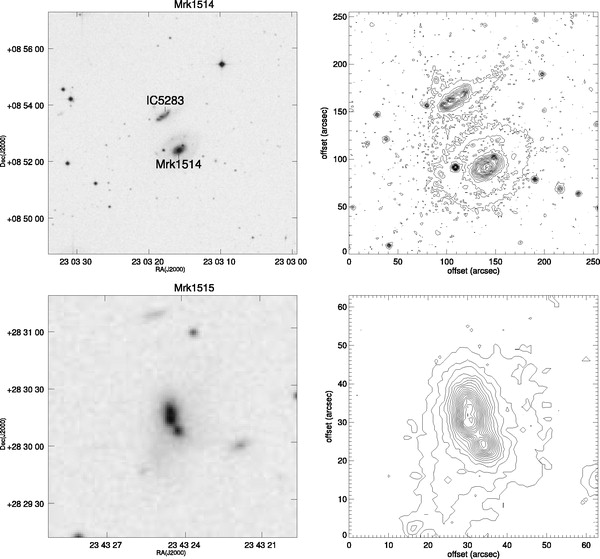
In Figure Set 13 we have created gray-scale
representations and contour diagrams of the Fpg-band
images of Markarian galaxies in interaction and merging systems. These
images are presented in plates of two images each, comprising 210
Markarian galaxies. The contour levels are in arbitrary units. The
lowest contour level was chosen at the about
3  level of the local
background. The contour interval is constant, but different in each
case; usually it is between 10% - 30% of the local background. The
interval was chosen in order to best illustrate both the inner and outer
structure of the galaxy. In the same fashion field size (and thus
magnification) was selected individually for each system to clearly
illustrate its morphological structure.
level of the local
background. The contour interval is constant, but different in each
case; usually it is between 10% - 30% of the local background. The
interval was chosen in order to best illustrate both the inner and outer
structure of the galaxy. In the same fashion field size (and thus
magnification) was selected individually for each system to clearly
illustrate its morphological structure.
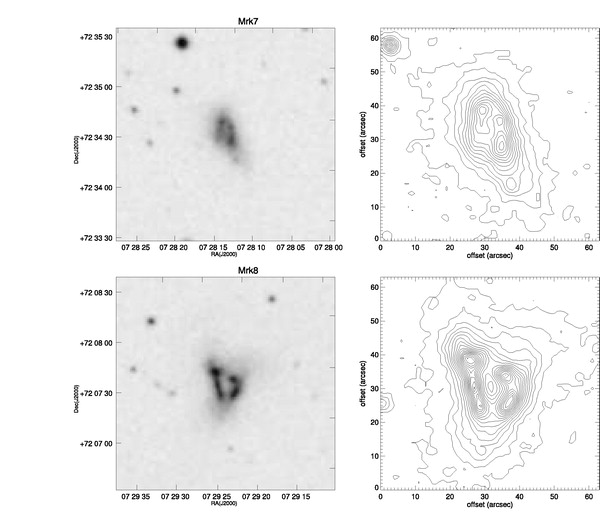 |
Figure Set 13. F-Band Images of Markarian Galaxies |
| Figure 13.2, 13.3, 13.4, 13.5, 13.6, 13.7, 13.8, 13.9, 13.10, 13.11, 13.12, 13.13, 13.14, 13.15, 13.16, 13.17, 13.18, 13.19, 13.20, 13.21, 13.22, 13.23, 13.24, 13.25, 13.26, 13.27, 13.28, 13.29, 13.30, 13.31, 13.32, 13.33, 13.34, 13.35, 13.36, 13.37, 13.38, 13.39, 13.40, 13.41, 13.42, 13.43, 13.44, 13.45, 13.46, 13.47, 13.48, 13.49, 13.50, 13.51, 13.52, 13.53, 13.54, 13.55, 13.56, 13.57, 13.58, 13.59, 13.60, 13.61, 13.62, 13.63, 13.64, 13.65, 13.66, 13.67, 13.68, 13.69, 13.70, 13.71, 13.72, 13.73, 13.74, 13.75, 13.76, 13.77, 13.78, 13.79, 13.80, 13.81, 13.82, 13.83, 13.84, 13.85, 13.86, 13.87, 13.88, 13.89, 13.90, 13.91, 13.92, 13.93, 13.94, 13.95, 13.96, 13.97, 13.98, 13.99, 13.100, 13.101, 13.102, 13.103, 13.104, 13.105 |
In the Markarian survey, 5 galaxies were identified (Mrk 71, 94, 404, 1039 and 1315) that appear to be giant H II complexes within larger galaxies or even projected on satellites of the primary galaxy (e.g., Mrk 71 and 94). We add to this list another 6 Markarian galaxies (Mrk 59, 86b, 256b, 489b, 1236, and 1379a). Several studies have been carried out on these Markarian galaxies, but the focus has been on the primary galaxy and not the H II complex itself; this has introduced some confusion in the published data. To retain clarity in the database we list these cases separately as H II class objects and Figure 14 shows gray-scale representations of the Fpg-band images of these 11 Markarian galaxies.
 |
 |
 |
Figure 14. Gray-scale representations of the F-band images of Markarian objects, which are giant H II regions within larger galaxies or even projected on satellites of the primary galaxy. |
In
M+89
it is reported that from the list of 1515 Markarian galaxies, 40 objects
that are Galactic stars and Galactic star + galaxy projections were
deleted. It is interesting that of 14 objects, which were classified and
deleted by
M+89
as Galactic star + galaxy
projection cases, 9 have determined spectral classes that show existence
of real or uncertain emission lines. These objects are located mainly at
high Galactic latitudes (|bII|
 20°), and some of them
in the original Markarian lists are described as galaxies, but not as
compact star - like objects (e.g., Mrk 80, 227, 351, 861, 1217). One of
these galaxies Mrk 227 was observed by SDSS, and according to SDSS DR3
it is a strong emission-line galaxy with redshift z = 0.0961. It
is our opinion that this sample of Markarian galaxies is interesting by
itself and needs more attention. The anonymous referee has postulated
that some of these objects may be unresolved super-star clusters
(SSCs). To stress the importance of this sample of Markarian galaxies,
we do not delete them from the database and present them in
Figure 15.
20°), and some of them
in the original Markarian lists are described as galaxies, but not as
compact star - like objects (e.g., Mrk 80, 227, 351, 861, 1217). One of
these galaxies Mrk 227 was observed by SDSS, and according to SDSS DR3
it is a strong emission-line galaxy with redshift z = 0.0961. It
is our opinion that this sample of Markarian galaxies is interesting by
itself and needs more attention. The anonymous referee has postulated
that some of these objects may be unresolved super-star clusters
(SSCs). To stress the importance of this sample of Markarian galaxies,
we do not delete them from the database and present them in
Figure 15.
 |
Figure 15. Gray-scale representations and contour diagrams of the F-band images of 20 Markarian galaxies that by spectral observations were classified as Galactic stars but obviously have diffuse structure and are UV galaxies with projected Galactic stars. Contour levels and axis labels are as in Figure 1. |
| Figure 15b, 15c, 15d, 15e, 15f, 15g, 15h, 15i, 15j, |
The authors thank the referee whose suggestions and remarks contributed significantly to improve the paper. A. R. P. acknowledges the hospitality of the Space Telescope Science Institute during his stay as visiting scientist supported by the Director's Discretionary Research Found. This research has made use of NASA/IPAC Extragalactic Database (NED), which is operated by the Jet Propulsion Laboratory, California Institute of Technology, under contract with the National Aeronautics and Space Administration and HYPERLEDA (Leon-Meudon Extragalactic Database). Two Micron All Sky Survey (2MASS), which is a joint project of the University of Massachusetts and the Infrared Processing and Analysis Center, funded by the National Aeronautics and Space Administration and the National Science Foundation. The Digitized Sky Survey was produced at the Space Telescope Science Institute under US Government grant NAG W-2166. The images of this survey are based on photographic data obtained using the Oschin Schmidt Telescope on Palomar Mountain and the UK Schmidt Telescope. The plates were processed into the present digital form with the permission of these institutions. The Second Palomar Observatory Sky Survey (POSS-II) was made by the California Institute of Technology with funds from the National Science Foundation, the National Aeronautics and Space Administration, the National Geographic Society, the Sloan Foundation, the Samuel Oschin Foundation, and the Eastman Kodak Corporation. The California Institute of technology and Palomar Observatory operate the Oschin Schmidt Telescope. Funding for the creation and distribution of the SDSS Archive has been provided by the Alfred P. Sloan Foundation, the Participating Institutions, the National Aeronautics and Space Administration, the National Science Foundation, the US Department of Energy, the Japanese Monbukagakusho, and the Max Planck Society. For image processing, both the IDL language (available from Research Systems, Inc.) and the ADHOC software (developed by Jacques Boulesteix, Marseille Observatory, France) were intensively used.
