Copyright © 2005 by Annual Reviews. All rights reserved
| Annu. Rev. Astron. Astrophys. 2005. 43:
677-725 Copyright © 2005 by Annual Reviews. All rights reserved |


2.1. Luminosities: Basic Relations
The calculation of high-redshift source properties from the observation
of molecular emission lines requires care with respect to the cosmology
assumed. This is important when comparing published source properties,
as different cosmologies can lead to significantly different values for
properties such as luminosity, size, mass. In this
review we have assumed a cosmology with
 m = 0.3,
 =
0.7, and H0 = 70 km s-1 Mpc-1.
=
0.7, and H0 = 70 km s-1 Mpc-1.
The CO line luminosity can be expressed in several ways. From
energy conservation, the monochromatic luminosity, observed flux
density, and luminosity distance are related by
 rest
L(rest) =
4
rest
L(rest) =
4  DL2
obs
S(obs), yielding
DL2
obs
S(obs), yielding
 |
(1) |
where the CO line luminosity, LCO, is measured
in L ; the
velocity integrated flux, SCO
; the
velocity integrated flux, SCO
 v, in Jy km
s-1; the
rest frequency, rest =
obs (1 + z),
in GHz; and the luminosity distance, DL, in Mpc.
1
v, in Jy km
s-1; the
rest frequency, rest =
obs (1 + z),
in GHz; and the luminosity distance, DL, in Mpc.
1
The CO line luminosity is often expressed
(Solomon et al. 1997)
in units of
K km s-1pc2 as the product of the
velocity integrated source brightness temperature, Tb
v,
and the source area,
s
DA2, where
s
is the solid angle subtended by the source.
The observed integrated line intensity, ICO =
 Tmbdv, measures the beam diluted brightness
temperature, which decreases with redshift, Tb
v
s =
ICO
s ⋆ b
(1 + z), where
s ⋆ b
is the solid angle of the source
convolved with the telescope beam. Then the line luminosity
L'CO = Tb
v
s
DA2 =
s ⋆ b
DL2 ICO (1 +
z)-3, or
Tmbdv, measures the beam diluted brightness
temperature, which decreases with redshift, Tb
v
s =
ICO
s ⋆ b
(1 + z), where
s ⋆ b
is the solid angle of the source
convolved with the telescope beam. Then the line luminosity
L'CO = Tb
v
s
DA2 =
s ⋆ b
DL2 ICO (1 +
z)-3, or
 |
(2) |
where L'CO is measured in K km
s-1 pc2,
s ⋆ b
in arcsec2,
DL in Mpc, and ICO in K km
s-1 . If the source is much smaller than the beam, then
s ⋆ b
 b.
b.
The line luminosity, L'CO, can also be expressed for a
source of any size in terms of the total line flux,
L'CO = (c2 / 2k)
SCO
v
obs-2
DL2 (1 + z)-3, or
 |
(3) |
Because L'CO is proportional to brightness temperature, the L'CO ratio for two lines in the same source is equal to the ratio of their intrinsic brightness temperatures averaged over the source. These ratios provide important constraints on physical conditions in the gas. For thermalized optically thick CO emission the intrinsic brightness temperature and line luminosity are independent of J and of rest frequency. For example, L'CO (J = 3-2) = L'CO (J = 1-0).
By observing CO emission from higher J transitions for
high- redshift galaxies researchers can
maintain the same approximate observed frequency as redshift increases.
Equations 2 and 3 show that for fixed line luminosity
(L'CO) and a fixed observed
frequency (or a fixed beam
size), the observed integrated line intensity and the integrated flux
do not scale as the inverse square of luminosity distance
(DL-2), but rather as
(1 + z)3 DL-2 . This
substantial negative K-correction
(Solomon, Downes &
Radford 1992a,
b)
is one of the reasons the relatively clear 3-mm atmospheric window,
with instruments developed for observation of CO(1-0) in the local
Universe, has been the most important
wavelength band for observations of CO from EMGs at
z  2.
2.
A significant fraction of the EMGs are gravitationally imaged by an intervening galaxy. The luminosities L and L' calculated without correction for the magnification by the gravitational lens are, therefore, only apparent luminosities. If a model of the gravitational lens is available, the intrinsic luminosities can be calculated from Lint = Lapp / µ and L'int = L'app / µ, where µ is the area magnification factor of the gravitational lens. Wiklind & Alloin (2002) have reviewed gravitational lensing of EMGs.
2.2. From CO Luminosity to Molecular Mass
Observation of emission from CO rotational transitions is the dominant means of tracing interstellar molecular clouds, which consist almost entirely of molecular hydrogen, H2. Molecular hydrogen rather than atomic hydrogen is the principal component of all interstellar clouds with density n > 100 cm-3 owing to a balance between formation on dust and self-shielding of H2 from photodissociation (Solomon & Wickramasinghe 1969) by the interstellar radiation field. This transition from atomic to molecular hydrogen at a moderate interstellar density means that all dense clouds are molecular. Molecular clouds are the raw material for star formation and a critical component in the evolution of galaxies. The first generation of stars must have formed, in the absence of heavy elements, from HI with only trace amounts of H2 available to provide essential cooling. However, the huge IR luminosity seen in ULIRGs and EMGs is clearly emitted by interstellar dust, and we can expect all dense, dusty clouds to be molecular. H2 has strongly forbidden rotational transitions, and the H2 vibration-rotation lines require high temperature to be produced, for example, by UV excitation or shocks. In the absence of these special circumstances, the H2 is invisible.
CO emission is the best tracer of molecular hydrogen for two reasons. It
is a very stable molecule and the most abundant molecule after
H2. Second, a weak dipole
moment (µe = 0.11 Debye) means that CO rotational
levels are excited and thermalized by collisions with H2 at
relatively low molecular hydrogen
densities. Strong CO emission from interstellar gas dominated by
H2 is ubiquitous. The critical density necessary to produce
substantial excitation of a rotational transition is given approximately
by n(H2) A/C
where A is the Einstein coefficient for spontaneous decay and C is the
collisional rate coefficient. The A coefficient scales as
µ2
3 where
µ is the dipole moment and
(J, J - 1) =
2BJ for a simple rotational ladder, is the frequency of the
transition . In practice the critical density is lowered by line
trapping for CO emission and for emission from other optically thick
tracers such as HCN and CS. The full multi level excitation problem must
be solved usually using the LVG (large velocity gradient) approximation
(Scoville and Solomon
1974;
Goldreich and Kwan 1974).
The effective density for strong CO emission ranges from n(H2)
300 cm-3
for J = (1-0) to
3000 cm-3
for J = (4-3) or (5-4). Of course the higher J transitions
also require a minimum kinetic temperature for collisional excitation.
For high-z galaxies there is another obvious requirement for strong CO emission. The large quantities of dust and molecular gas observed in EMGs clearly indicate not only ongoing star formation but also substantial enrichment by previous star formation. Researchers have known for some time that many quasar emission line regions show substantial metallicity; EMGs have not only a high metallicity, but also a huge mass of enriched interstellar matter much larger and more extensive than that of a quasar emission line region.
The H2 mass-to-CO luminosity relation can be expressed as
 |
(4) |
where M(H2) is defined to include the mass of
He, so that M(H2) = Mgas,
the total gas mass, for molecular clouds. For the Galaxy, three
independent analyses yield the
same linear relation between the gas mass and the CO line luminosity:
(a) correlation of optical/IR
extinction with 13CO in nearby dark clouds
(Dickman 1978);
(b) correlation of the flux of
 rays, produced by cosmic ray
interactions with protons, with the CO line flux for the Galactic
molecular ring
(Bloemen et al. 1986,
Strong et al. 1988);
and (c) the observed relations between virial mass
and CO line luminosity for Galactic giant molecular clouds (GMCs)
(Solomon et al. 1987),
corrected for a solar circle radius of
8.5 kpc. All these methods indicate that in our Galaxy,
rays, produced by cosmic ray
interactions with protons, with the CO line flux for the Galactic
molecular ring
(Bloemen et al. 1986,
Strong et al. 1988);
and (c) the observed relations between virial mass
and CO line luminosity for Galactic giant molecular clouds (GMCs)
(Solomon et al. 1987),
corrected for a solar circle radius of
8.5 kpc. All these methods indicate that in our Galaxy,

 Mgas / L'CO =
4.6 M(K km
s-1 pc2)-1
(Solomon & Barrett
1991).
(Some authors use X rather than
as a symbol for this
conversion factor, even though X by convention relates H2 column
density and line-integrated CO intensity.)
Mgas / L'CO =
4.6 M(K km
s-1 pc2)-1
(Solomon & Barrett
1991).
(Some authors use X rather than
as a symbol for this
conversion factor, even though X by convention relates H2 column
density and line-integrated CO intensity.)
For a single cloud or an ensemble of nonoverlapping clouds, the gas mass determined from the virial theorem, Mgas, and the CO line luminosity, L'CO, are related by
 |
(5) |
where m' is the mass of an H2 molecule multiplied by
1.36 to account for He,
n(cm-3) is the average H2 number density in
the clouds, and Tb(K) is the
intrinsic (rest-frame) brightness temperature of the CO line.
Mgas is in
M and
L'CO is in K km s-1 pc2
(Dickman, Snell &
Schloerb 1987;
Solomon et al. 1987).
This is the physical basis for deriving gas mass from CO luminosity. The
existence of gravitationally bound clouds is confirmed by the agreement
between determined
from application of the virial theorem, using measured velocity
dispersions and sizes for the Milky Way clouds, and
determined from the
totally independent methods (a) and (b) discussed above.
Use of the Milky Way value for the molecular gas mass to CO luminosity
ratio, =
4.6 M(K km
s-1 pc2)-1, overestimates the gas mass
in ULIRGs and probably in
EMGs. After high-resolution maps were produced for a few ULIRGs
(Scoville, et al. 1991)
it became apparent that the molecular gas mass calculated using the
Milky Way value for was
comparable to and in some cases greater than the dynamical mass of the
CO-emitting region. This contradiction led to a new model
(Downes, Solomon &
Radford 1993;
Solomon et al. 1997)
for CO emission in ULIRGs. Unlike Galactic clouds or gas distributed in
the disks of galaxies, most of the CO emission in the
centers of ULIRGs may not come from many individual virialized clouds,
but from a filled intercloud medium, so
the linewidth is determined by the total dynamical mass in the region
(gas and stars), that is,
V2
= G Mdyn / R . The CO luminosity
depends on the dynamical mass as well as the gas mass. The CO line
emission may trace a
medium bound by the total potential of the galactic center, containing
a mass Mdyn consisting
of stars, dense clumps, and an interclump medium; the interclump medium
containing the CO emitting gas with mass
Mgas.
Defining f
Mgas / Mdyn ,
the usual CO to H2 mass relation becomes
(Downes, Solomon & Radford 1993)
 |
 |
and
 |
(6) |
where  is the gas
density averaged over the whole volume.
The quantity
L'CO
measures the geometric mean of total mass and gas mass. It
underestimates total mass and overestimates gas mass.
Hence if the CO emission in ULIRGs comes from
regions not confined by self-gravity, but instead from an intercloud
medium bound by the potential of the galaxy, or from molecular gas
in pressure, rather than gravitational equilibrium, then the usual
relation Mgas / L'CO
= must be changed. The
effective is
lower than 2.6n1/2 / Tb.
is the gas
density averaged over the whole volume.
The quantity
L'CO
measures the geometric mean of total mass and gas mass. It
underestimates total mass and overestimates gas mass.
Hence if the CO emission in ULIRGs comes from
regions not confined by self-gravity, but instead from an intercloud
medium bound by the potential of the galaxy, or from molecular gas
in pressure, rather than gravitational equilibrium, then the usual
relation Mgas / L'CO
= must be changed. The
effective is
lower than 2.6n1/2 / Tb.
Extensive high-resolution mapping of CO emission from ULIRGs shows that
the molecular gas is in rotating disks or rings. Kinematic models
(Downes & Solomon
1998)
in which most of the CO flux comes from a
moderate density warm intercloud medium have been used to account for
the rotation curves, density distribution, size, turbulent velocity,
and mass of these molecular rings. Gas masses were derived from a model
of radiative transfer rather than the use of a standard conversion
factor. The models yield gas masses of ~ 5 × 10⁹
M,
approximately five times lower than the standard method, and a ratio
Mgas / L'CO
0.8 M (K km
s-1 pc2)-1. The ratio of gas to
dynamical mass Mgas / Mdyn
1/6
and a maximum ratio of gas to total mass surface density
µ / µtot = 1/3. This effective
conversion factor =
0.8 M (K km
s-1
pc2)-1 for ULIRGs has been adopted for EMGs by
many observers of high-z CO emission and we use it throughout
this review. However, until a significant number of EMGs are observed
with sufficient angular resolution to enable a calibration of
, the extrapolation in the
use of = 0.8 to EMGs
from ULIRGs must be regarded as tentative.
2.3. Classification of the EMGs
The list of 36 EMGs reported in the literature at the time of this
review are given in Table 1, together with their
derived properties. The gas masses were calculated using the luminosity
of the lowest available CO transition and
= 0.8 (see
Section 2.2). All quantities assume the cosmology
adopted for this review.
Appendices 1,
2, and
3 at the end of this
article give the observed properties from which the quantities in
Table 1 were calculated.
2
The overwhelming majority of these detections were made with the IRAM
interferometer. Lists of EMGs have been constructed by
Cox et al. (2002),
Carilli et al. (2004),
Hainline et al. (2004),
and Beelen
(http://www.astro.uni-bonn.de/~beelen/database.xml).
The sources are
listed in all tables and appendices in order of redshift. No blind
survey for high-z CO emission has been done because of its
prohibitive cost in observing time with present instruments. Were such a
blind survey to be done eventually by ALMA, it could
result in additional types of EMGs. Figure 1
shows the number of EMGs by
type as a function of redshift. Despite the selection effects that attend
the detection of EMGs, one can see that the current flux-limited sample
broadly reflects the epoch where most star
formation in the Universe is currently thought to occur.
| EMG | Redshift | Transition | L'(app.) | LFIR(app.) | Lens | L'(int.) | LFIR(int.) | Mgas | Mdust | SFR |  SF SF |
| z | (1010 L'*) a | (1012
L) |
Mag. | (1010 L'*) a | (1012
L) |
(1010
M) |
(108
M) |
(M
y-1) |
(106 y) | ||
| SMM J02396 | 1.062 | CO 2-1 | 5.1 ± 0.5 | 16.3 | 2.5 | 2.0 | 6.5 | 1.6 | 975 | 16 | |
| Q0957+561 | 1.414 | CO 2-1 | 0.9 ± 0.5 | 14 | 1.6 | 0.6 | 6 | 0.4 | 2.5 | 900 | 4 |
| HR10 | 1.439 | CO 1-0 | 6.5 ± 1.1 | 6.5 | ? | - | - | 5.2µ-1 | 6.8µ-1 | ||
| IRAS F10214 | 2.286 | CO 3-2 | 11.3 ± 1.7 | 60 | 17 | 0.7 | 3.6 | 0.6 | 540 | 11 | |
| SMM J16371 | 2.380 | CO 3-2 | 3.0 ± 0.6 | - | ? | - | - | 2.4µ-1 | |||
| SMM J16368 | 2.385 | CO 3-2 | 6.9 ± 0.6 | 16 | ? | - | - | 5.5µ-1 | |||
| 53W002 | 2.393 | CO 3-2 | 3.6 ± 0.4 | - | 1 | 3.6 | - | 2.9 | |||
| SMM J16366 | 2.450 | CO 3-2 | 5.6 ± 0.9 | 20 | ? | - | - | 4.5µ-1 | |||
| SMM J04431 | 2.509 | CO 3-2 | 4.5 ± 0.6 | 13 | 4.4 | 1.0 | 3 | 0.8 | 450 | 18 | |
| SMM J16359 | 2.517 | CO 3-2 | 18.9 ± 0.8 | 45 | 45 | 0.4 | 1 | 0.3 | 2 | 150 | 20 |
| Cloverleaf | 2.558 | CO 3-2 | 44 ± 1 | 59 | 11 | 4.0 | 5.4 | 3.2 | 1.5 | 810 | 40 |
| SMM J14011 | 2.565 | CO 3-2 | 9.4 ± 1.0 | 20 | 5-25 | 0.4-1.9 | 0.8-4.0 | 0.3-1.5 | 0.13-0.65 | 120-600 | 25 |
| VCV J1409 | 2.583 | CO 3-2 | 7.9 ± 0.7 | 35 | ? | - | - | 6.3µ-1 | 38µ-1 | ||
| LBQS 0018 | 2.620 | CO 3-2 | 5.4 ± 0.9 | 33 | ? | - | 4.3µ-1 | ||||
| MG0414 | 2.639 | CO 3-2 | 9.2 | 32 | ? | - | 7.4µ-1 | ||||
| MS1512-cB58 | 2.727 | CO 3-2 | 1.4 ± 0.3 | 3.1 | 32 | 0.043 | 0.1 | 0.03 | 15 | 20 | |
| LBQS 1230 | 2.741 | CO 3-2 | 3.0 ± 1.0 | 36 | ? | - | - | 2.4µ-1 | 11µ-1 | ||
| RX J0911.4 | 2.796 | CO 3-2 | 11.3 ± 4.3 | 51 | 22 | 0.52 | 2.3 | 0.4 | 345 | 12 | |
| SMM J02399 | 2.808 | CO 3-2 | 12.2 ± 1.6 | 11 | 2.5 | 4.9 | 4.4 | 3.9 | 6-8 | 660 | 59 |
| SMM J04135 | 2.846 | CO 3-2 | 22 ± 5 | 31 | 1.3 | 17 | 24 | 13.0 | 18 | 3600 | 36 |
| B3 J2330 | 3.092 | CO 4-3 | 3.4 ± 0.8 | 28 | 1 | 3.4 | 28 | 2.7 | 1950 | 14 | |
| SMM J22174 | 3.099 | CO 3-2 | 3.7 ± 0.9 | 12 | ? | - | 3.0 | 1800 | 17 | ||
| MG 0751 | 3.200 | CO 4-3 | 16 ± 1 | 49 | 17 | 1.0 | 2.9 | 0.8 | 435 | 18 | |
| SMM J09431 | 3.346 | CO 4-3 | 3.2 ± 0.3 | 20 | 1.2 | 2.7 | 12 | 2.2 | 1800 | 12 | |
| SMM J13120 | 3.408 | CO 4-3 | 5.2 ± 0.9 | 12 | ? | - | 4.2µ-1 | ||||
| TN J0121 | 3.520 | CO 4-3 | 5.4 ± 1.0 | 7 | 1 | 5.4 | 7 | 4.3 | 1050 | 41 | |
| 6C1908 | 3.532 | CO 4-3 | 5.2 ± 1.0 | 9.8 | 1 | 5.2 | 9.8 | 4.2 | 1470 | 29 | |
| 4C60.07b | 3.791 | CO 1-0 | 8.7 ± 1.7 | 13 | 1 | 8.7 | 13 | 7.0 | 1950 | 36 | |
| 4C60.07r | 3.791 | CO 1-0 | 5.2 ± 0.6 | 1 | 5.2 | 4.2 | |||||
| 4C60.07b | 4-3 | 6.0 ± 0.9 | 1 | 6.0 | |||||||
| 4C60.07r | 4-3 | 3.0 ± 0.2 | 1 | 3.0 | |||||||
| 4C41.17R | 3.796 | CO 4-3 | 4.3 ± 0.5 | 20 | 1 | 4.3 | 20 | 3.4 | 4.6 | 3000 | 11 |
| 4C41.17B | 3.796 | CO 4-3 | 2.2 ± 0.5 | 1 | 2.2 | 1.8 | |||||
| APM 08279 | 3.911 | CO 1-0 | 9.1 ± 2.7 | 200 | 7 | 1.3 | 29 | 1.0 | 5.8 | 4350 | 2 |
| PSS J2322 | 4.119 | CO 1-0 | 12 ± 5 | 23 | 2.5 | 5.0 | 9.3 | 4.0 | 1800 | 22 | |
| BRI 1335N | 4.407 | CO 2-1 | 3.3 ± 1.1 | ? | - | - | 2.6µ-1 | ||||
| BRI 1335S | 4.407 | CO 2-1 | 4.8 ± 1.1 | ? | - | - | 3.8µ-1 | ||||
| BRI 1335 | CO 5-4 | 8.2 ± 0.9 | 28 | ? | - | - | 17µ-1 | ||||
| BRI 0952 | 4.434 | CO 5-4 | 2.8 ± 0.3 | 9.6 | 4 | 0.7 | 2.4 | 0.5 | 0.7 | 360 | 19 |
| BR 1202N | 4.692 | CO 2-1 | 5.2 ± 1.0 | ? | - | 7 | |||||
| BR 1202S | 4.695 | CO 2-1 | 4.6 ± 0.8 | ? | - | ||||||
| BR 1202 | CO 4-3 | 7.6 ± 1.5 | 71 | ? | - | - | 19µ-1 | ||||
| TN J0924 | 5.203 | CO 1-0 | 8.2 ± 1.6 | 1 | 8.2 | 6.6 | |||||
| SDSS J1148 | 6.419 | CO 3-2 | 2.6 ± 0.6 | 27 | ? | - | - | 2.1 | 2.4µ-1 | ||
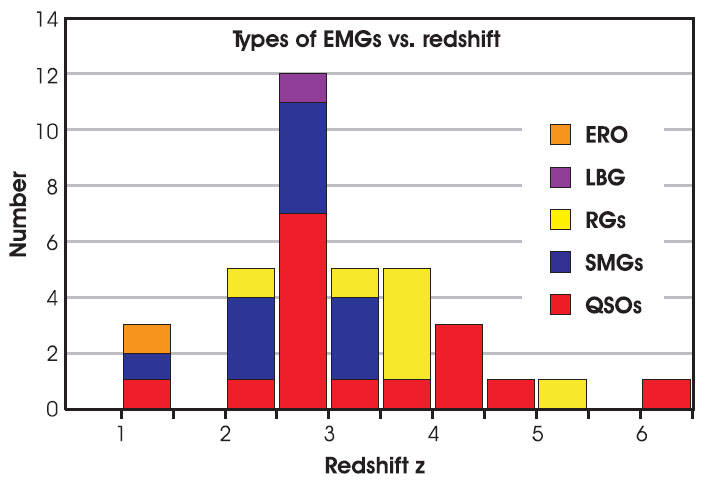 |
Figure 1. Distribution in redshift of the 36 known EMGs: 16 quasi-stellar objects (QSOs), 11 submillimeter galaxies (SMGs), 7 radio galaxies (RGs), one Lyman Break galaxy (LBG), and one extremely red object (ERO). Despite the large selection effects of the flux-limited sample, the distribution broadly reflects the current understanding of when most of the star formation in the Universe occured. |
With recent improvements in
millimeter bolometers, large numbers of quasi-stellar objects (QSOs)
have been observed in 1.2-mm continuum emission.
Approximately 30% of the bright QSOs at all redshifts z > 2
are strong millimeter/submillimeter continuum
emitters with a typical inferred rest-frame luminosity of
LFIR ~ 1013
L
(Izaak et al 2002,
Omont et al. 1996a).
The percentage of submillimeter detections is higher (60%) for
gravitationally lensed quasars
(Barvainis & Ivison
2002).
Identifying the redshift appropriate for a CO emission search can be
difficult because the molecular gas in the host galaxy may have a
significantly different redshift from the broad optical emission line
region of the QSO. A key question for the EMGs identified with QSOs is
whether the FIR luminosity is powered by rapid star formation
(starbursts) in the molecular clouds or by the active galactic nucleus
(AGN) that may be accreting molecular gas.
In SMGs, unlike the optically selected quasars, the total luminosity is completely dominated by their (rest-frame) FIR emission. The surveys at 850 µm, primarily carried out with the Submillimetre Common-User Bolometer Array (SCUBA) instrument on the James Clerk Maxwell Telescope (JCMT) have found several hundred galaxies, or about 1 arcmin-1 (see, for example, Scott et al. 2002). They represent a substantial part of the FIR background and may contribute as much as half of all star formation at high z. Although many SCUBA galaxies harbor active galactic nuclei (AGNs), the AGNs contribute only a small fraction of the bolometric luminosity, which is dominated by star formation (Alexander et al. 2004). Only a small subset of about 15 blank-field submillimeter sources have been observed in CO emission.
A relatively small proportion (19%) of EMGs are identified with radio galaxies. Radio galaxies are a rare population and are not selected for being gravitationally lensed. However, seven IR-luminous radio galaxies have been observed in CO emission, and these include some of the more interesting examples.
The identification of a set of EMGs with LBGs would be significant in that it would tie the EMGs to a huge population of early Universe objects. However, only a single LBG has been detected in CO emission (Baker et al. 2004). The low CO line luminosity of this object compared with the other EMGs suggests that LBGs form a different class of early Universe galaxies, something that remains to be confirmed using ALMA.
This section presents and discusses EMGs by type and historically within each type.
2.4.1. IRAS F10214
In 1991, IRAS FSC10214+4724 was shown to be an extraordinarily luminous
high-redshift IR source
(Rowan-Robinson et
al. 1991).
With a redshift of z = 2.3 it was by far the most
luminous IR galaxy yet found, more than 30 times as luminous as
local ULIRGs. Shortly after IRAS F10214 was identified, the first
high-z CO emission was searched for and found in
the (3-2), (4-3), and (6-5) lines
(Brown & Vanden Bout
1991,
1992;
Solomon, Downes &
Radford 1992a).
Allowing for the negative K-correction,
Solomon, Downes &
Radford (1992b)
found the CO line luminosity, L'CO, calculated
from the flux measured at the IRAM 30m Telescope, to be 100 times less
than first estimated, but still about an order of
magnitude greater than that in any galaxy in the local Universe, yielding a
molecular gas mass of 1011
M, equal to the
baryonic mass of an entire large
galaxy. (Agreement between the 12-m and 30-m measured fluxes was
obtained with new observations at the 12-m by
Radford et al. (1996)).
The strong CO(6-5)
line, originating from a rotational level 116 K above the ground state,
and the (6-5)/(3-2) line ratio indicates the presence of moderately
dense gas substantially warmer than most of the molecular mass in Milky
Way GMCs or normal spiral galaxies.
Optical and near-IR spectroscopy show both narrow and broad emission line systems, with the narrow lines indicating a Seyfert 2 nucleus (Lawrence et al. 1993) and the broad lines observed in polarized light indicating the presence of an obscured quasar (Goodrich et al. 1996).
High-resolution optical and near-IR imaging (Broadhurst & Leh'ar 1995, Graham & Liu 1995, Matthews et al. 1994) clearly show that F10214 is gravitationally lensed. The 2.2-µm image shows a compact 0.7" diameter source superposed on a weaker 1.5" arc. CO maps of the (6-5) line with the IRAM interferometer show an elongated structure that was modeled as a CO arc convolved with the interferometer beam and fit to the CO data (Downes, Solomon & Radford 1995). From the length of the CO arc, the apparent CO luminosity, the linewidth, and the intrinsic brightness temperature of the line (deduced from line ratios), Downes, Solomon & Radford (1995) derived a magnification µ = 10 fv, where fv is the velocity filling factor, or fraction of the full line width intercepted by a typical line of sight. This magnification reduced the intrinsic CO line luminosity and molecular mass to that of local ULIRGs. The radius of the molecular ring was found to be 600 / fv pc, much larger than that of the AGN torus and similar to that in ULIRGs, but much less than that of a full galactic disk. The magnification for the FIR radation was 13, and for the mid-IR it was 50.
Recent improved high-resolution maps of CO(3-2), (6-5), and
(7-6) (Downes & Solomon, manuscript in preparation) show
that the size of the lensed CO image is 1.6" ×
 0.3" (2.7 ×
0.5 kpc). More importantly, a
velocity gradient is observed along the arc and line profiles
show two distinct kinematic components at the east and west sides,
demonstrating that the molecular emission originates in a rotating disk
around the quasar. Positions, sizes, and
linewidths are the same in all three lines, indicating that they
originate in the same volume with the same kinematic distribution. The
line ratios indicate a mean emission-weighted kinetic
temperature of 50 K and a mean H2 density of 3000
cm-3. A search for 13CO
emission yields a ratio of 12CO/13CO
21, which is similar to
high values found in ULIRGs but higher than those of nearby spiral
galaxies, indicating a modest opacity for 12CO. The
true size of the molecular ring, the CO luminosity, molecular mass, and
the excitation of the CO
ladder all look similar to those observed in local ULIRGs.
0.3" (2.7 ×
0.5 kpc). More importantly, a
velocity gradient is observed along the arc and line profiles
show two distinct kinematic components at the east and west sides,
demonstrating that the molecular emission originates in a rotating disk
around the quasar. Positions, sizes, and
linewidths are the same in all three lines, indicating that they
originate in the same volume with the same kinematic distribution. The
line ratios indicate a mean emission-weighted kinetic
temperature of 50 K and a mean H2 density of 3000
cm-3. A search for 13CO
emission yields a ratio of 12CO/13CO
21, which is similar to
high values found in ULIRGs but higher than those of nearby spiral
galaxies, indicating a modest opacity for 12CO. The
true size of the molecular ring, the CO luminosity, molecular mass, and
the excitation of the CO
ladder all look similar to those observed in local ULIRGs.
Vanden Bout, Solomon &
Maddalena (2004)
observed strong HCN(1-0) emission from F10214 with an intrinsic line
luminosity similar to that in local ULIRGs such as Mrk 231 and
Arp 220. HCN emission traces dense gas
generally associated with the star-forming cores of GMCs (see
Section 3.1). The very high ratio of HCN
to CO luminosities L'CO / L'HCN =
0.18 is characteristic of starbursts in the local
Universe. All galaxies with global HCN/CO
luminosity ratios greater than 0.07 were found to be luminous
(LFIR > 1011
L) starbursts
(Gao & Solomon 2004).
F10214 contains both a dust-enshrouded quasar
responsible for the mid-IR
luminosity and a much larger molecular ring starburst responsible for a
substantial fraction of the FIR luminosity.
2.4.2. Cloverleaf Hazard et al. (1984) found the quasar H1413+1143 (better known as the Cloverleaf), a broad absorption line QSO at a redshift of z = 2.55. It was subsequently identified optically as a lensed object with four bright image components (Magain et al. 1988). Barvainis, Antonucci & Coleman (1992) discovered strong FIR and submillimeter radiation from the Cloverleaf, indicating a substantial dust component with a FIR spectral energy distribution (SED) similar to that of IRAS F10214. This was the first indication that some bright optical high-z quasars also are extremely IR luminous.
Redshifted strong CO(3-2) emission was observed using both the IRAM 30-m Telescope and Plateau de Bure Interferometer (Barvainis et al. 1994) with an apparent line luminosity about three times greater than that from F10214. Barvainis et al. (1997) observed three additional rotational lines (4-3), (5-4), and (7-6) were observed at the IRAM 30m Telescope and their line ratios used to constrain the physical conditions of the gas and the CO to H2 conversion factor. These measurements showed L'CO (4-3) > L'CO (3-2), indicating a high kinetic temperature and low optical depths. More recent measurements (Weiß et al. 2003) show a higher (3-2) flux and a lower line ratio (4-3)/(3-2) indicative of lower kinetic temperatures and subthermal excitation. The Cloverleaf CO emission lines have a higher flux density than do the lines from any other high-z source, owing to both powerful intrinsic line luminosities and magnification. As a result, they can be successfully imaged at high angular resolution. The lensing also magnifies the scale of the emission making it possible to deduce true source size at scales below the instrumental resolution.
Using the millimeter array at the Owens Valley Radio Observatory (OVRO), Yun et al. (1997) obtained an interferometric map of the Cloverleaf in which the CO(7-6) emission was partially resolved. They used Hubble Space Telescope (HST) images to model a lens with an elliptical potential and an external sheer. This model constrained the intrinsic size of the CO(7-6) source, which has a radius of approximately 1100 pc. Separation of the red and blue line wings showed a kinematic structure consistent with a rotating disk. Alloin et al. (1997) obtained a high-resolution map (0.5'') with the IRAM interferometer that clearly resolved the emission into four spots similar to the lensed optical radiation. Figure 2 shows an image of the CO(7-6) emission contructed by Venturini & Solomon (2003) from their data. A model based on HST and Very Large Array (VLA) images gave an upper limit to the source radius of approximately 1200 pc. Kneib et al. (1998) used enhanced IRAM CO(7-6) images and HST images to construct two lens models using a truncated elliptical mass distribution with an external shear (galaxy + cluster). From the separation of the kinematic components and the HST-based lens model they deduced a CO radius of only 100 pc and a magnification of 30. This size scale is characteristic of an AGN torus.
 |
Figure 2. Image of the Cloverleaf in CO(7-6) emission taken with the IRAM interferometer (constructed by Venturini & Solomon 2003 from the data of Alloin et al. 1997). The high observing frequency of 226 GHz provides the angular resolution (0.5") needed to construct a gravitational lens model based on CO data. |
Venturini and Solomon
(2003)
fit a two-galaxy lensing model directly to the IRAM CO(7-6) map
rather than to the optical HST image. The fit obtained by minimizing
the difference between the map produced by the lensed model and the IRAM
CO(7-6) image yielded a source with
disklike structure and a characteristic radius of 800 pc, a
value similar to that of the
CO-emitting regions present in nearby starburst ULIRGs. The model
reproduces the geometry as well as the brightness of the four images of
the lensed quasar. The large size of the CO source seems to rule out a
scenario in which the molecular gas is
concentrated in a very small region around the central AGN. With the
magnification of 11 found from this model and the CO(3-2) flux given by
Weiß et
al. (2003),
the total molecular mass is 3.2 × 10¹⁰
M, with a
molecular surface density of 104
M pc-2.
Weiß et al. (2003)
argue that using L'CO (3-2) rather than
L'CO (1-0) has only a 10% effect on the
calculated molecular mass. The dynamical mass of the rotating disk is
Mdyn sin2i = 2.5 ×
1010 M.
HCN emission traces dense gas generally associated
with the star-forming cores of GMCs.
Strong HCN(1-0) emission has been observed from the Cloverleaf
(Solomon et al. 2003)
with an intrinsic line luminosity slightly higher than that in local
ULIRGs, such as Mrk 231 and Arp 220, and 100 times greater than that of
the Milky Way. To put this in perspective, the intrinsic HCN luminosity
of the Cloverleaf is 10 times greater than the CO
luminosity of the Milky Way, indicating the presence of 1010
M of dense
star-forming molecular gas.
The molecular and IR luminosities for the Cloverleaf show that the
large mass of dense molecular gas indicated by the HCN luminosity could
account for a substantial fraction (from star formation), but not all,
of the IR luminosity from this quasar. If Arp 220 is used as a standard for the luminosity ratio
LFIR / L'HCN, star formation in the
dense molecular gas could account for 5 × 10¹²
L , or about
20% of the total intrinsic IR luminosity. Using the highest ratio for a
ULIRG gives an upper limit of 40%.
The model by (Weiß et al. (2003) of the IR spectral energy distribution of the Cloverleaf has two distinct components: one with a warm dust temperature Td = 115 K responsible for the mid-IR, and the other much more massive component with Td = 50 K that produces the FIR. The model FIR luminosity, 22% of the total, may correspond to the luminosity generated by star formation and the mid-IR to heating by the AGN. Using the model LFIR yields LFIR /L'HCN = 1700, comparable to that of ULIRGs and only a factor of 2 higher than that for normal spiral galaxies (Gao & Solomon (2004). The star formation rate per solar mass of dense gas is then similar to that in ULIRGs and only slightly higher than that in normal spirals.
2.4.3. VCV J1409+5628
This EMG is an optically luminous radio-quiet quasar with the
strongest 1.2-mm flux density found in the survey by
Omont et al. (2003).
It has been observed in both CO(3-2) and CO(7-6) emission
(Beelen et al. 2004).
The line luminosity of L'CO(app.) = (7.9 ±
0.7) × 1010 K km s-1 pc2 leads
to a gas mass of Mgas = 6.3 × 10¹⁰
µ-1
M,
which is ~ 20% of Mdyn for reasonable
inclinations. If the extent of the radio continuum,
from a VLA image at 1.4 GHz, represents the extent of the CO emission,
the molecular gas is confined to a torus or disk of diameter 1-5
kpc. This is similar both to the molecular gas extents
inferred from lens models of F10214 and the Cloverleaf and to what is observed in ULIRGs.
2.4.4. PSS J2322+1944
This EMG is an IR-luminous quasar. The extent of its
molecular gas has been inferred from a remarkable gravitationally
lensed image of the CO emission - a so-called Einstein Ring.
Carilli et al. (2003)
studied this lensed system on
sub-kiloparsec scales with the 0.6" resolution
of the VLA at 43 GHz, where the CO(2-1)
line from this z = 4.12 object is redshifted. The VLA image is
shown in Figure 3. The data are
consistent with a dynamical mass of Mdyn = 3 ×
1010 sin-2i
M and
confinement of the molecular gas in a disk of diameter 2.2 kpc. The
radio continuum is co-spatial with the
molecular gas and the star formation rate is ~ 900
M
year-1. PSS J2322+1944 is the
fourth EMG to be observed in [C I] emission. This object provides
strong evidence for the presence of active star formation in the host
galaxy of a luminous high-redshift quasar.
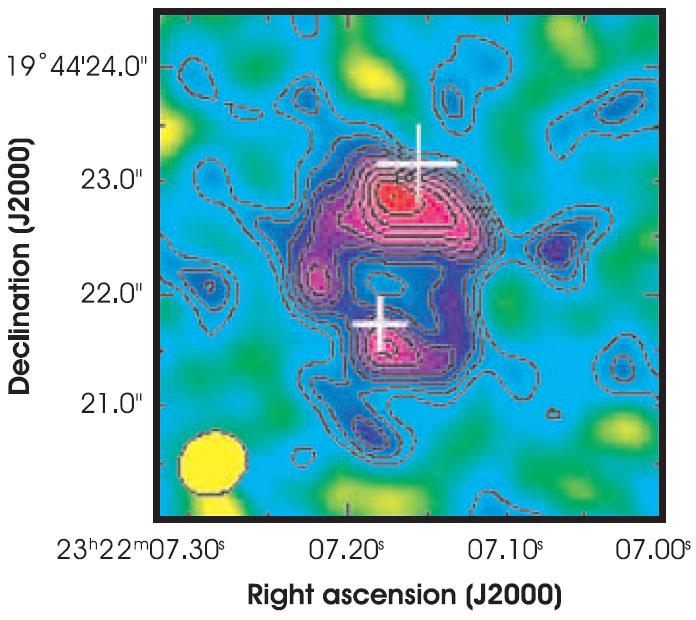 |
Figure 3. The Einstein Ring in PSS 2322, observed in CO(2-1) emission using the VLA at a resolution of 0.6" (Carilli et al. 2003). |
2.4.5. BR 1202-0725
This is an optically bright radio-quiet quasar, the third EMG to be
discovered
(Omont et al. 1996b),
and the first to show multiple components. Whether these two
components, separated by 4", are companion objects or the
result of gravitational lensing remains an issue. High-resolution imaging
Carilli et al. 2002a)
using the VLA of the CO(2-1) emission has shown that the
southern component is roughly twice as massive as the northern
component, and there is a significant difference in the velocity widths
of the CO lines of the two components. This finding provides evidence
against the presence of a gravitational lens. However, the total
molecular gas mass exceeds the
dynamical mass of the system unless an unreasonably low value of
is used to
calculate Mgas. Magnification by a gravitational lens
would allow for more reasonable
values of .
2.4.6. APM 08279+5245 This extremely luminous broad absorption line quasar was accidently discovered in a survey for cool carbon stars (Irwin et al. 1998). The high redshift of z = 3.9 would have made it the most luminous known object in the Universe were it not for the magnification of a gravitational lens (Egami et al. 2000). The magnification at optical wavelengths can be as large as µ = 100; for CO emission it is much less, µ = 7 (Downes et al. 1999, Lewis et al. 2002). The CO (4-3) and (9-8) emission was first observed in APM08279 with the IRAM interferometer Downes et al. 1999). The strong (9-8) emission indicates the presence of hot dense gas with a kinetic temperature of approximately 200 K. The observed ratio of LFIR / L'CO is twice that of other EMGs. In addition to the central molecular emission region, observed in four CO transitions, high-resolution images of the CO(2-1) emission with the VLA reveal two emission regions lying to the north and northeast, 2-3" distant from the central region (Papadopoulos et al. 2001). If real, these could be companion galaxies. The nuclear CO(1-0) emission is imaged in a (partial) Einstein Ring (Lewis et al. 2002).
2.4.7. SDSS J1148+5251
This is the most distant known quasar, with a redshift of
z = 6.42. It was shown to be an EMG via the observations of CO(3-2)
emission using the VLA,
and CO(6-5) and CO(7-6) emission using the IRAM interferometer
(Bertoldi et al. 2003b,
Walter et al. 2003).
The CO observations imply a mass of molecular gas
Mgas = 2.1 ×
1010 µ-1
M. The thermal
dust emission
(Bertoldi et al. 2003a)
leads to a star formation rate of ~ 3000 µ-1
M
year-1. This is clear evidence for the presence of vast
amounts of molecular gas, composed of heavy elements, only ~ 850
million years following the Big
Bang. High-resolution (0.17" ×
0.13" 1 kpc)
imaging of the CO(3-2) emission using the VLA
(Walter et al. 2004),
shown in Figure 4, suggest that
this source may be a merger of two galaxies.
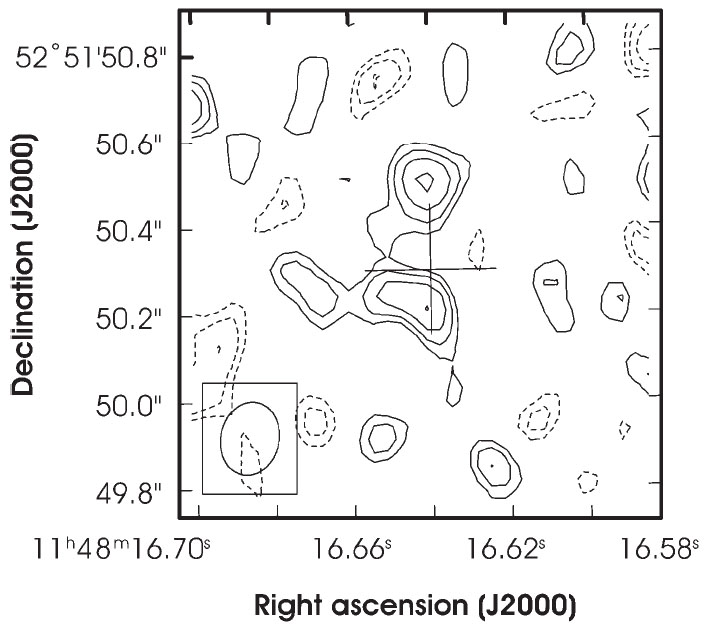 |
Figure 4. SDSS J1148, a quasar at z = 6.4 imaged in CO(3-2) emission using the VLA at a resolution of 0.17" × 0.13" (Walter et al. 2004). This system is a possible merger of two components that resemble the ULIRGs of the more local Universe. The presence of CO in this system is evidence for substantial enrichment in heavy metals ~ 850 million years after the Big Bang. |
2.4.8. SMM J02399-0136
This SMG was the first SCUBA source identified as an EMG
(Frayer et al. 1999),
using OVRO. It is the brightest galaxy detected in an early SCUBA
survey of rich lensing clusters
(Smail, Ivison & Blain
1997).
J02399 harbors an AGN
(Ivison et al. 1998).
The observed integrated line strength of the CO(3-2) line, with the
observed CO redshift of z = 2.808, leads to
L'CO(app) = 12 × 1010
K km s-1 pc2. Correction for a cluster
lens magnification of
µ = 2.5 yields L'CO (int) = 4.9
× 1010 K k ms-1 pc2. This is
comparable to CO luminosities
for ULIRGs, and was the first evidence that SCUBA sources identified
as EMGs may be similar in nature to ULIRGs. Higher resolution
observations of the CO emission at IRAM confirmed the OVRO detection
(Genzel et al. 2003).
These data were fitted to a rotating disk model very similar but
larger in size than that seen in ULIRGs: a molecular gas mass
Mgas = 3.9 × 10¹⁰
M confined
within a radius of 8 kpc. This source remains one
of few EMGs with the potential for molecular gas to be extended in a
disk with radius larger than 2 kpc.
2.4.9. SMM J14011+0252
This SMG was the second SCUBA source from the Lensing Cluster Survey
(Smail, Ivison & Blain
1997)
to be detected in CO emission; it has been heavily observed since
being identified as an EMG. There is no evidence for the presence of
an AGN in J14011. The detection of CO(3-2) emission
(Frayer et al. 1999)
at OVRO was followed by more interferometry to
determine the location of the CO source among the 850-µ m
peaks in the SCUBA image and its extent. From combined OVRO and
Berkeley-Illinois-Maryland Association (BIMA) observations it was argued
(Ivison et al. 2001)
that the CO emission was extended on a scale of diameter 20 kpc,
assuming a cluster magnification of µ = 2.5, well beyond
what is seen in ULRIGs. Higher signal-to-noise observations at IRAM
(Downes & Solomon
2003)
did not confirm this extent, as the CO emission is
confined to an observed disk of only 2.2", or a
diameter 7 kpc for a
magnification of 2.5.
2.4.10 SMM 16359+6612
This is a somewhat lower luminosity
(LFIR = 1012
L)
SMG that nevertheless has been observed in CO(3-2) emission aided by
a gravitational lens that provides a total magnification factor of
µ = 45. The image obtained with the IRAM Interferometer
(Kneib et al. 2005a),
together with spectra of the three image components,
is shown in Figure 5. CO
observations of SMM J16359 have also been reported by
Sheth et al. (2004).
This is the third
SMG reported to have spatially resolved CO emission. Here, the quality
of the data together with the lens model of
Kneib et al. (2004b)
leads to an inferred disk size of 3 × 1.5 kpc.
Whereas the FIR luminosity is comparable to that of Arp 220, the CO luminosity is approximately half that
of Arp 220. The mass inferred from the CO luminosity is
30% or 60% of the calculated dynamical mass for a ring-disk structure or
a merger, respectively.
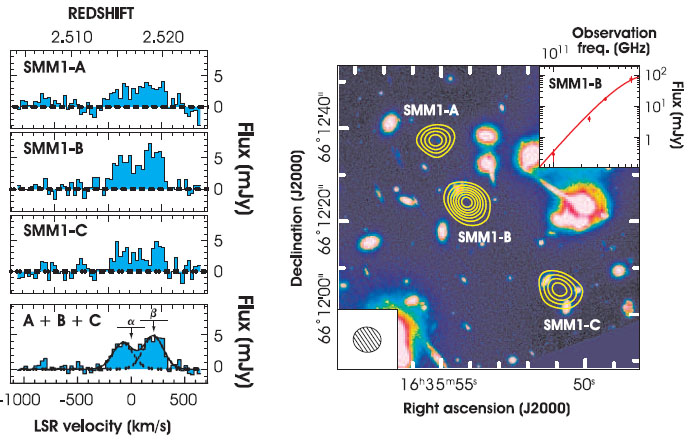 |
Figure 5. The lower panel shows
SMM J16359
in CO(3-2) emission that has been triply imaged by a gravitational lens
(Kneib et al. 2004a).
The total magnification is µ = 45, making
possible this observation of CO in a somewhat less luminous SMG. The CO
contours are superimposed on an HST image of Abell 2218, and show good
registration with their optical counterparts. The synthesized CO beam
( ~ 6") is shown in the lower left corner. The SED in the range
450-3000 µm is shown in the upper right corner
(Kneib et al. 2004b).
The upper panel shows the CO spectra from each image together with the
combined spectrum. The redshifts deduced from HST imaging and
H |
2.4.11. 4C41.17
This is one of only seven radio galaxies to be observed in CO
emission. High-z radio galaxies (HzRGs) have been difficult to
detect in CO emission because
the candidates searched are not gravitationally lensed and the observed
peak CO flux densities are small (~ 2 mJy).
Stevens et al. (2003)
have argued that HzRGs and their companions,
revealed in deep 850-µm images, form central cluster
ellipticals. Four of the seven HzRG examples cited by
Stevens et al. (2003),
including 4C41.17, are also EMGs. A
position-velocity plot of the CO(4-3) emission
(De Breuck et al. 2005),
clearly reveals two components. Both are gas-rich systems, each with
Mgas ~ 3 × 10¹⁰
M.
Their velocity separation leads to a dynamical mass
Mdyn ~ 6 ×
1011 sin-2 i
M, for
the potential binding the components. The system could be two gas-rich
galaxies merging to form a massive cD elliptical galaxy.
1 The rough dependence of the luminosity
distance on redshift can be seen from the following:
DL = DA
(1 + z)2, where DA is the angular
size distance. For the cosmology assumed in this review,
DA rapidly increases with
redshift, reaching a peak value at z
1.6, and then declines
roughly as (1 + z)-1 for larger z. So for
redshifts larger than z ~ 2, DL grows roughly
as (1 + z). A calculator for computing
luminosity and angular size distances in any cosmology can be found at
http://www.astro.ucla.edu/~wright/CosmoCalc.html.
Back.
2
Appendix 1 lists
coordinates, redshift, galaxy type and magnification for each EMG.
Appendix 2 gives velocity
integrated flux densities
(Sv),
linewidths as full width at half-maximum (FWHM)
( v),
peak line flux densities (S), line luminosities (L') for
the CO transitions observed in the
EMGs, and inferred molecular gas masses. The observed quantities
listed are those reported in the references cited, after adjustment for
the cosmology assumed in this review. Where lens
models exist, intrinsic luminosities are listed, calculated using the
magnifications given in Appendix 1.
In addition to CO,
data for detections of HCN are listed, as well as for CI whose
fine-structure lines originate from interstellar molecular gas.
Appendix 3 gives the observed
continuum flux densities at various wavelengths of
the EMGs, together with the inferred FIR luminosity, including the
intrinsic luminosity where it is possible to correct for lens
magnification. Brackets indicate the measurements that were included in
the calculation of the listed luminosity values cited. Frequently,
only a single measurement is used to estimate the luminosity, together
with a set of assumptions, so the values listed
should be regarded with caution.
Back.
 , are in
close agreement with those of the CO emission peaks.
, are in
close agreement with those of the CO emission peaks.