


The "monochromatic" continuum fluxes are derived from the LWS spectra by fitting a 2-5 µm linear baseline through the spectra surrounding the wavelengths 52 µm, 57 µm, 63 µm, 88 µm, 122 µm, 145 µm, 158 µm, and 170 µm. Continuum fluxes are measured only for the well-calibrated LWS spectra when spectra are available at these wavelengths. Continuum fluxes could not be derived in some L02 observations that had no spectra at these wavelengths. If the observations were affected by changes in the responsivity and dark current caused by warm-ups in the long wavelength detectors, no continuum flux is derived. These continuum fluxes and associated uncertainties are listed in Table 2. Because of the uncertainty of off-axis continuum contributions in extended sources, only fluxes for galaxies unresolved by the LWS beam are listed.
| Galaxy | 170 µm | 158 µm | 145 µm | 122 µm | 88 µm | 63 µm | 57 µm | 52 µm |
| (Jy) | (Jy) | (Jy) | (Jy) | (Jy) | (Jy) | (Jy) | (Jy) | |
| NGC 0185 | 2.00 ± 0.5 | 1.5 ± 0.2 | 1.6 ± 0.2 | 2.8 ± 0.3 | ||||
| UGC 00545 | 4.8 ± 0.5 | 5.8 ± 0.6 | ||||||
| MCG+12-02-001 | 27.80 ± 2.1 | 28.9 ± 3.1 | 28.7 ± 2.3 | 30.1 ± 2.7 | 37.4 ± 4.4 | 30.2 ± 2.8 | 24.8 ± 2.2 | 21.8 ± 2.0 |
| IC 1613 | 1.6 ± 0.2 | 1.7 ± 0.2 | 2.2 ± 0.3 | |||||
| NGC 0449 | 4.4 ± 0.6 | 2.9 ± 0.3 | 2.4 ± 0.3 | 5.2 ± 0.5 | 2.4 ± 1.3 | |||
| UGC 00852 | 6.30 ± 4.2 | 1.3 ± 1.0 | 3.7 ± 0.7 | 4.3 ± 0.7 | ||||
| NGC 0520 | 29.60 ± 2.8 | 33.0 ± 4.3 | 39.4 ± 4.2 | 48.7 ± 3.7 | 57.7 ± 7.6 | 44.4 ± 4.6 | 37.9 ± 3.4 | 30.7 ± 2.8 |
| NGC 0625 | 8.80 ± 1.6 | 3.5 ± 0.6 | 5.9 ± 1.0 | 4.0 ± 0.6 | 5.5 ± 0.8 | |||
| NGC 0660 | 75.60 ± 7.6 | 92.0 ± 9.2 | 91.5 ± 9.2 | 106.3 ± 10.6 | 110.0 ± 11.2 | 80.3 ± 8.0 | 70.1 ± 7.1 | 60.4 ± 6.1 |
| Mrk 573 | 1.1 ± 0.2 | 1.8 ± 0.3 | 2.0 ± 0.2 | 3.7 ± 0.5 | 8.4 ± 0.9 | |||
| III Zw 35 | 12.50 ± 1.2 | 5.3 ± 0.6 | 8.2 ± 0.8 | 10.4 ± 1.0 | 9.9 ± 1.3 | 18.4 ± 1.7 | 16.2 ± 1.5 | 8.5 ± 1.0 |
| NGC 0685 | 3.0 ± 0.5 | |||||||
| NGC 0693 | 10.7 ± 2.3 | 7.6 ± 1.0 | 11.0 ± 0.9 | 14.5 ± 1.5 | ||||
| NGC 0695 | 15.50 ± 1.4 | 18.5 ± 1.5 | 14.9 ± 1.3 | 19.3 ± 2.4 | 12.6 ± 1.2 | |||
| UGC 01449 | 7.40 ± 1.2 | 6.9 ± 1.6 | 6.9 ± 0.7 | 8.1 ± 0.7 | 8.2 ± 0.9 | |||
| NGC 0814 | 1.30 ± 0.2 | 4.1 ± 1.0 | 4.2 ± 0.3 | 14.6 ± 1.5 | ||||
| NGC 0986 | 28.20 ± 2.5 | 39.8 ± 5.8 | 37.0 ± 3.4 | 46.4 ± 3.0 | 44.1 ± 5.5 | 26.1 ± 2.7 | 25.6 ± 2.2 | 23.0 ± 2.1 |
| NGC 1022 | 22.50 ± 2.0 | 24.0 ± 3.3 | 21.0 ± 2.4 | 26.0 ± 2.4 | 36.7 ± 4.3 | 27.1 ± 2.5 | 24.6 ± 2.3 | 23.3 ± 2.0 |
| UGC 02238 | 18.80 ± 1.8 | 23.8 ± 2.9 | 18.4 ± 1.9 | 17.2 ± 1.4 | 24.4 ± 2.4 | 17.3 ± 1.8 | 7.4 ± 1.4 | |
| NGC 1155 | 2.6 ± 0.5 | 2.4 ± 0.3 | 2.2 ± 0.2 | 4.1 ± 0.4 | ||||
| NGC 1156 | 5.30 ± 0.5 | 17.0 ± 2.1 | 7.4 ± 0.7 | 8.2 ± 0.7 | 2.1 ± 0.2 | |||
| NGC 1222 | 8.00 ± 0.9 | 10.8 ± 2.2 | 11.4 ± 1.1 | 12.9 ± 1.1 | 20.4 ± 2.0 | 20.2 ± 1.8 | ||
| UGC 02519 | 5.50 ± 0.9 | 8.1 ± 1.8 | 7.9 ± 0.8 | 7.7 ± 0.7 | 6.3 ± 0.6 | |||
| NGC 1266 | 10.10 ± 1.0 | 14.8 ± 4.8 | 13.3 ± 1.3 | 16.7 ± 1.3 | 21.6 ± 2.7 | 18.5 ± 1.8 | 15.5 ± 1.4 | |
| NGC 1275 | 4.50 ± 0.6 | 7.8 ± 0.9 | 7.5 ± 0.8 | 6.4 ± 0.5 | 7.3 ± 1.0 | 12.1 ± 1.2 | 10.7 ± 1.0 | 11.5 ± 1.2 |
| NGC 1317 | 2.60 ± 0.3 | 7.5 ± 1.5 | 5.1 ± 0.5 | |||||
| NGC 1326 | 10.30 ± 1.0 | 13.6 ± 1.0 | 13.0 ± 1.2 | |||||
| IC 1953 | 2.00 ± 0.3 | 8.4 ± 1.0 | 7.3 ± 0.6 | 13.2 ± 1.6 | 11.5 ± 1.2 | |||
| NGC 1377 | 5.8 ± 0.8 | 4.2 ± 0.4 | 11.3 ± 1.3 | 13.6 ± 1.3 | ||||
| NGC 1385 | 20.20 ± 1.7 | 23.3 ± 4.3 | 26.8 ± 3.0 | 27.9 ± 2.2 | 28.9 ± 3.5 | 23.7 ± 2.2 | 19.9 ± 1.6 | |
| UGC 02855 | 66.80 ± 5.7 | 67.3 ± 8.9 | 57.6 ± 4.6 | 64.2 ± 4.9 | 59.4 ± 7.6 | 37.8 ± 3.7 | 22.2 ± 1.9 | 17.7 ± 1.6 |
| NGC 1482 | 55.70 ± 4.8 | 50.5 ± 4.1 | 52.7 ± 4.5 | 61.7 ± 7.4 | 40.7 ± 4.1 | 37.3 ± 3.2 | 30.4 ± 2.6 | |
| NGC 1546 | 13.70 ± 1.3 | 16.6 ± 3.8 | 22.7 ± 2.1 | 23.1 ± 1.9 | 18.6 ± 2.5 | 9.4 ± 0.9 | 4.5 ± 0.7 | |
| NGC 1569 | 27.10 ± 2.2 | 31.0 ± 5.5 | 30.9 ± 3.3 | 31.8 ± 2.6 | 53.2 ± 6.1 | 51.9 ± 4.8 | 44.1 ± 3.8 | 42.7 ± 3.7 |
| 3C 120 | 9.90 ± 1.0 | 8.0 ± 1.0 | 5.1 ± 0.5 | 4.0 ± 0.3 | 4.0 ± 0.5 | 2.4 ± 0.3 | ||
| NGC 1614 | 12.50 ± 1.2 | 16.3 ± 2.2 | 20.3 ± 1.9 | 25.0 ± 2.1 | 49.2 ± 4.9 | 43.1 ± 4.4 | 30.7 ± 3.0 | 25.6 ± 2.6 |
| NGC 1672 | 40.20 ± 3.6 | 47.9 ± 5.5 | 44.8 ± 5.1 | 54.1 ± 4.4 | 60.5 ± 7.5 | 40.5 ± 3.9 | 30.6 ± 2.6 | |
| IRAS 05189-2524 | 4.20 ± 0.5 | 6.6 ± 0.9 | 5.0 ± 0.5 | 6.9 ± 0.6 | ||||
| UGCA 116 | 7.90 ± 1.6 | 11.7 ± 1.4 | 10.7 ± 1.1 | 10.5 ± 0.9 | 9.7 ± 1.2 | 10.4 ± 1.0 | 8.5 ± 0.9 | 4.9 ± 0.6 |
| UGC 03426 | 2.70 ± 0.4 | 2.2 ± 0.3 | 5.7 ± 0.7 | 8.3 ± 0.8 | ||||
| NGC 2146 | 124.90 ± 3.5 | 138.3 ± 4.2 | 139.4 ± 1.8 | 192.1 ± 1.7 | 250.1 ± 6.2 | 183.4 ± 3.2 | 160.6 ± 2.8 | 134.7 ± 3.2 |
| IC 450 | 5.4 ± 0.7 | 4.7 ± 0.5 | 3.7 ± 0.4 | |||||
| NGC 2388 | 17.30 ± 1.5 | 26.2 ± 3.2 | 22.9 ± 2.5 | 24.7 ± 2.1 | 33.9 ± 4.3 | 20.9 ± 2.1 | 20.5 ± 1.7 | |
| IC 2554 | 24.60 ± 3.6 | 26.2 ± 4.2 | 25.3 ± 4.2 | 30.1 ± 6.0 | 37.3 ± 6.0 | 22.3 ± 3.0 | 19.8 ± 2.7 | 15.6 ± 2.2 |
| ESO 317-G023 | 17.50 ± 3.0 | 26.7 ± 5.3 | 23.7 ± 5.8 | 23.5 ± 3.6 | 27.5 ± 4.4 | 20.8 ± 3.0 | 14.2 ± 1.9 | |
| NGC 3256 | 43.90 ± 7.9 | 92.6 ± 19.1 | 101.2 ± 29.7 | 130.5 ± 27.8 | 165.3 ± 29.0 | 130.2 ± 19.0 | 97.9 ± 13.1 | 91.3 ± 12.2 |
| IRAS F10565+2448 | 11.50 ± 1.3 | 10.1 ± 1.6 | 8.4 ± 1.0 | 9.3 ± 0.7 | 23.2 ± 2.2 | 14.0 ± 1.5 | ||
| NGC 3583 | 19.60 ± 2.1 | 18.7 ± 2.7 | 17.2 ± 1.6 | 12.0 ± 1.1 | ||||
| NGC 3620 | 53.80 ± 8.0 | 66.0 ± 11.1 | 55.4 ± 9.8 | 71.7 ± 12.7 | 83.6 ± 15.1 | 56.3 ± 7.8 | 56.8 ± 8.2 | 45.4 ± 6.5 |
| NGC 3683 | 18.80 ± 2.1 | 23.8 ± 3.4 | 22.0 ± 2.6 | 25.8 ± 2.0 | 34.4 ± 4.4 | 15.7 ± 1.6 | 9.0 ± 0.9 | |
| NGC 3690 | 60.70 ± 6.3 | 58.6 ± 7.5 | 65.7 ± 5.3 | 86.4 ± 7.9 | 140.6 ± 19.9 | 150.8 ± 14.6 | 142.3 ± 13.1 | 128.8 ± 12.3 |
| NGC 3705 | 8.70 ± 0.8 | 15.5 ± 2.6 | 9.5 ± 1.1 | 3.8 ± 0.4 | ||||
| NGC 3885 | 7.90 ± 1.2 | 13.8 ± 3.4 | 10.1 ± 1.8 | 12.7 ± 2.6 | 23.7 ± 4.0 | 15.0 ± 1.8 | 7.5 ± 1.1 | |
| NGC 3949 | 18.60 ± 1.9 | 13.3 ± 2.4 | 12.9 ± 1.7 | 17.6 ± 1.6 | 17.3 ± 2.3 | 11.6 ± 1.1 | 10.6 ± 0.9 | |
| NGC 4027 | 14.40 ± 2.6 | 18.9 ± 4.3 | 15.4 ± 2.9 | 20.8 ± 3.6 | 12.8 ± 1.8 | 11.2 ± 1.4 | ||
| NGC 4041 | 21.30 ± 1.8 | 24.9 ± 3.4 | 25.7 ± 2.5 | 26.0 ± 2.2 | 34.6 ± 4.6 | 17.4 ± 1.8 | 14.6 ± 1.3 | 11.6 ± 1.1 |
| NGC 4102 | 50.50 ± 4.7 | 53.9 ± 6.8 | 49.6 ± 5.7 | 63.3 ± 7.1 | 84.2 ± 10.9 | 58.4 ± 5.5 | 52.3 ± 5.0 | 35.9 ± 3.5 |
| IRAS 12071-0444 | 2.4 ± 1.6 | |||||||
| NGC 4151 | 3.00 ± 1.0 | 3.1 ± 1.0 | 2.8 ± 0.7 | 4.4 ± 0.5 | 3.7 ± 1.0 | 8.9 ± 2.2 | 8.1 ± 1.7 | 8.8 ± 2.4 |
| VCC 66 | 5.50 ± 0.9 | 6.4 ± 1.0 | 2.0 ± 0.4 | |||||
| NGC 4189 | 6.50 ± 3.4 | 11.4 ± 1.4 | 6.5 ± 0.5 | 4.6 ± 2.5 | ||||
| VCC 92 | 13.30 ± 1.3 | 14.2 ± 2.1 | 5.9 ± 0.6 | |||||
| NGC 4194 | 10.30 ± 1.0 | 17.8 ± 2.3 | 14.5 ± 1.3 | 17.6 ± 1.8 | 28.7 ± 3.8 | 31.6 ± 3.1 | 23.1 ± 1.9 | |
| PG 1211+143 | 4.7 ± 1.6 | |||||||
| NGC 4222 | 6.7 ± 0.9 | |||||||
| VCC 460 | 7.30 ± 0.7 | 9.8 ± 1.2 | 8.8 ± 0.8 | 9.5 ± 0.9 | ||||
| NGC 4294 | 8.40 ± 6.7 | 10.0 ± 2.8 | 4.2 ± 0.7 | 6.1 ± 3.1 | ||||
| NGC 4299 | 6.80 ± 4.7 | 7.6 ± 1.3 | 3.6 ± 0.4 | |||||
| NGC 4374 | 2.80 ± 0.4 | 2.6 ± 0.4 | 6.7 ± 0.8 | |||||
| VCC 857 | 3.30 ± 0.4 | 5.2 ± 0.6 | ||||||
| VCC 873 | 13.30 ± 1.5 | 17.1 ± 2.5 | 14.5 ± 1.2 | 6.7 ± 0.7 | ||||
| NGC 4414 | 55.90 ± 5.5 | 54.6 ± 7.9 | 58.7 ± 6.0 | 67.3 ± 5.5 | 59.9 ± 8.0 | 30.0 ± 3.1 | 24.7 ± 2.1 | 21.7 ± 1.8 |
| NGC 4418 | 14.20 ± 2.3 | 20.2 ± 3.6 | 14.3 ± 2.3 | 23.7 ± 4.1 | 46.2 ± 7.0 | 55.3 ± 7.8 | 41.4 ± 6.3 | 50.2 ± 7.6 |
| VCC 1003 | 6.30 ± 0.6 | 4.2 ± 0.6 | 5.2 ± 0.5 | |||||
| VCC 1043 | 11.40 ± 1.0 | 10.8 ± 1.5 | 10.1 ± 0.9 | 3.6 ± 0.4 | ||||
| VCC 1158 | 1.5 ± 0.2 | |||||||
| VCC 1253 | 0.8 ± 0.1 | |||||||
| NGC 4490 | 28.20 ± 3.1 | 31.2 ± 4.7 | 21.7 ± 3.3 | 26.2 ± 2.2 | 32.9 ± 4.5 | 22.0 ± 2.2 | 22.3 ± 2.2 | 15.3 ± 1.5 |
| VCC 1326 | 1.60 ± 0.3 | 3.3 ± 0.5 | 2.9 ± 0.3 | |||||
| VCC 1412 | 2.40 ± 0.3 | 2.2 ± 0.3 | ||||||
| NGC 4519 | 5.00 ± 0.5 | 7.4 ± 1.1 | 5.1 ± 0.7 | 3.7 ± 0.4 | ||||
| NGC 4522 | 7.90 ± 3.5 | 9.7 ± 1.2 | 4.8 ± 0.6 | |||||
| VCC 1727 | 8.00 ± 1.3 | 10.6 ± 1.9 | ||||||
| VCC 1813 | 2.7 ± 0.5 | |||||||
| VCC 1972 | 16.60 ± 2.5 | 19.6 ± 3.3 | 13.3 ± 2.4 | 7.2 ± 1.1 | ||||
| VCC 1987 | 22.70 ± 2.4 | 25.4 ± 3.5 | ||||||
| NGC 4691 | 14.30 ± 1.7 | 21.9 ± 3.4 | 17.0 ± 2.6 | 19.2 ± 1.6 | 23.2 ± 3.7 | 26.7 ± 2.4 | 19.9 ± 2.0 | |
| VCC 2070 | 3.8 ± 0.6 | |||||||
| NGC 4713 | 4.00 ± 0.4 | 11.0 ± 1.5 | 6.9 ± 0.7 | 4.9 ± 0.5 | ||||
| Mrk 231 | 15.30 ± 1.6 | 16.1 ± 2.2 | 16.0 ± 1.7 | 19.5 ± 1.7 | 34.1 ± 4.4 | 42.9 ± 4.0 | 37.2 ± 3.6 | 32.4 ± 3.2 |
| IC 3908 | 15.50 ± 2.4 | 19.8 ± 3.4 | 18.0 ± 3.1 | 16.6 ± 2.9 | 25.8 ± 4.1 | 15.5 ± 2.3 | ||
| IC 860 | 5.40 ± 0.9 | 14.3 ± 2.5 | 12.8 ± 2.3 | 11.0 ± 2.0 | 24.8 ± 3.8 | 22.2 ± 3.2 | 21.8 ± 3.1 | |
| IC 883 | 13.70 ± 1.5 | 14.7 ± 2.2 | 16.0 ± 1.8 | 17.3 ± 1.6 | 34.1 ± 4.3 | 22.3 ± 2.3 | ||
| ESO 173-G015 | 63.80 ± 5.8 | 76.4 ± 5.4 | 85.6 ± 4.1 | 104.9 ± 4.6 | 122.5 ± 6.9 | 105.7 ± 4.5 | 95.7 ± 6.0 | 80.1 ± 6.4 |
| Mrk 273 | 8.30 ± 1.0 | 8.4 ± 1.0 | 12.5 ± 1.3 | 15.4 ± 1.3 | 22.6 ± 2.3 | 24.9 ± 2.5 | 22.3 ± 2.0 | |
| IC 4329A | 2.4 ± 0.3 | 3.5 ± 0.4 | 7.4 ± 0.7 | |||||
| Mrk 463 | 1.0 ± 0.2 | 5.4 ± 0.5 | 2.0 ± 0.2 | |||||
| NGC 5430 | 8.10 ± 1.5 | 10.0 ± 1.9 | 10.2 ± 1.7 | 15.7 ± 2.9 | 9.8 ± 1.4 | |||
| NGC 5433 | 9.70 ± 1.0 | 11.6 ± 1.9 | 10.1 ± 1.0 | 10.4 ± 0.8 | 3.3 ± 0.4 | |||
| Circinus | 230.70 ± 5.1 | 259.8 ± 6.4 | 291.1 ± 3.9 | 365.5 ± 3.5 | 452.0 ± 12.3 | 360.8 ± 6.6 | 329.0 ± 7.9 | 293.1 ± 8.8 |
| NGC 5643 | 34.40 ± 3.3 | 34.3 ± 1.4 | 29.1 ± 1.1 | 25.1 ± 0.8 | 17.9 ± 1.4 | 17.8 ± 2.3 | 18.3 ± 2.5 | |
| NGC 5713 | 41.30 ± 7.1 | 34.9 ± 6.0 | 29.9 ± 4.8 | 35.7 ± 6.5 | 40.3 ± 7.4 | 33.3 ± 5.0 | 29.1 ± 3.8 | 23.2 ± 3.0 |
| I Zw 92 | 1.5 ± 1.1 | 3.3 ± 1.2 | ||||||
| NGC 5786 | 15.60 ± 2.2 | 19.8 ± 3.4 | 11.9 ± 2.2 | 12.5 ± 2.1 | 7.4 ± 1.2 | |||
| NGC 5866 | 4.40 ± 0.7 | 18.1 ± 3.0 | 14.1 ± 2.7 | 16.4 ± 3.0 | 7.2 ± 1.0 | |||
| CGCG 1510.8+0725 | 16.40 ± 1.4 | 23.9 ± 2.8 | 21.5 ± 1.9 | 28.0 ± 2.4 | 40.0 ± 4.0 | 28.6 ± 2.9 | 28.6 ± 2.4 | 19.5 ± 1.7 |
| IRAS 15250+3609 | 3.00 ± 1.5 | 4.4 ± 1.6 | ||||||
| NGC 5937 | 11.60 ± 1.1 | 17.9 ± 2.1 | 18.0 ± 1.7 | 20.4 ± 1.8 | 23.2 ± 3.0 | 8.1 ± 0.8 | 11.6 ± 1.0 | 9.8 ± 1.0 |
| NGC 5953 | 15.50 ± 1.4 | 17.9 ± 2.1 | 17.2 ± 1.8 | 17.0 ± 1.3 | 21.2 ± 2.6 | 16.9 ± 1.7 | 15.5 ± 1.4 | 15.7 ± 1.5 |
| Arp 220 | 77.10 ± 6.7 | 84.5 ± 8.5 | 100.2 ± 10.1 | 118.4 ± 9.5 | 151.4 ± 18.7 | 148.1 ± 15.0 | 134.2 ± 11.8 | 120.9 ± 10.8 |
| NGC 5962 | 21.50 ± 3.1 | 25.6 ± 4.1 | 17.7 ± 3.4 | 19.5 ± 3.7 | 9.1 ± 1.3 | 4.6 ± 0.9 | ||
| IC 4545 | 10.50 ± 5.2 | 11.3 ± 1.3 | 1.9 ± 1.4 | |||||
| IC 4595 | 19.00 ± 3.3 | 20.2 ± 5.2 | 16.9 ± 2.8 | 15.7 ± 2.8 | 7.4 ± 1.1 | |||
| NGC 6217 | 18.20 ± 2.1 | 22.6 ± 2.8 | 14.0 ± 1.2 | 14.0 ± 1.4 | ||||
| UGC 10445 | 3.8 ± 0.7 | |||||||
| NGC 6156 | 34.70 ± 2.9 | 37.4 ± 3.2 | 35.4 ± 2.8 | 35.6 ± 2.3 | 31.7 ± 4.0 | 20.0 ± 2.0 | 18.2 ± 1.5 | 17.8 ± 1.6 |
| CGCG 025-007 | 3.30 ± 2.6 | 3.1 ± 1.2 | 4.3 ± 0.4 | |||||
| NGC 6221 | 55.40 ± 10.0 | 62.7 ± 10.3 | 54.2 ± 10.7 | 70.0 ± 12.4 | 51.7 ± 7.1 | |||
| NGC 6240 | 11.50 ± 2.1 | 16.8 ± 2.8 | 17.9 ± 3.1 | 20.8 ± 3.7 | 25.8 ± 4.0 | 23.5 ± 3.4 | 27.5 ± 4.0 | 16.5 ± 2.5 |
| NGC 6286 | 20.90 ± 2.2 | 24.9 ± 3.4 | 21.9 ± 2.1 | 18.9 ± 1.8 | 21.6 ± 2.7 | 11.5 ± 1.0 | 10.1 ± 1.2 | |
| IRAS 17208-0014 | 26.40 ± 3.2 | 24.3 ± 2.9 | 27.0 ± 2.5 | 31.5 ± 2.6 | 48.5 ± 4.9 | 41.9 ± 3.9 | 31.6 ± 2.7 | 40.7 ± 4.9 |
| IC 4662 | 4.10 ± 0.4 | 6.6 ± 1.8 | 7.1 ± 1.0 | 6.8 ± 0.6 | 10.7 ± 1.3 | 12.4 ± 1.3 | 8.5 ± 1.0 | |
| NGC 6503 | 42.70 ± 3.4 | 48.6 ± 1.5 | ||||||
| Ark 535 | 1.9 ± 1.0 | 2.6 ± 0.3 | ||||||
| 3C 368 | 4.10 ± 0.5 | 1.8 ± 0.2 | ||||||
| NGC 6574 | 27.80 ± 2.7 | 30.6 ± 1.5 | 31.3 ± 0.8 | 30.1 ± 0.8 | 27.3 ± 2.1 | 18.7 ± 1.5 | 17.8 ± 2.2 | 17.6 ± 2.5 |
| [HB89] 1821+643 | 1.5 ± 0.2 | |||||||
| NGC 6764 | 9.20 ± 1.7 | 10.2 ± 1.7 | 8.1 ± 1.4 | 7.8 ± 1.5 | 9.3 ± 1.6 | 8.7 ± 1.1 | 12.0 ± 1.7 | 11.4 ± 1.7 |
| IRAS 19254-7245 | 6.10 ± 1.1 | 8.2 ± 1.2 | 2.0 ± 0.3 | 5.2 ± 0.9 | 7.6 ± 1.2 | 8.7 ± 1.2 | 8.1 ± 1.5 | |
| IRAS 19297-0406 | 10.90 ± 1.6 | 12.3 ± 0.6 | 9.1 ± 2.4 | |||||
| NGC 6810 | 29.00 ± 2.6 | 33.3 ± 1.2 | 30.9 ± 0.7 | 32.8 ± 0.9 | 32.8 ± 3.5 | 21.5 ± 1.4 | 17.5 ± 2.6 | 14.9 ± 2.9 |
| NGC 6824 | 15.10 ± 1.9 | 16.7 ± 1.6 | 17.8 ± 1.5 | 17.5 ± 1.2 | 12.5 ± 2.3 | 7.6 ± 1.3 | 5.2 ± 0.7 | 4.1 ± 0.6 |
| Cygnus A | 7.20 ± 1.3 | 5.8 ± 0.9 | ||||||
| IC 5020 | 10.70 ± 3.3 | 7.2 ± 1.0 | 5.4 ± 0.6 | |||||
| Mrk 509 | 1.00 ± 0.3 | 2.4 ± 0.4 | 3.7 ± 0.5 | 8.4 ± 0.8 | ||||
| NGC 6958 | 2.7 ± 0.4 | 1.8 ± 0.2 | 1.7 ± 0.2 | 1.8 ± 0.2 | ||||
| IC 5063 | 2.3 ± 2.0 | 1.9 ± 0.5 | 3.8 ± 0.7 | 6.4 ± 1.9 | 7.8 ± 3.0 | |||
| IRAS 20551-4250 | 4.63 ± 1.3 | 5.4 ± 0.8 | 6.0 ± 0.7 | 7.7 ± 0.7 | 22.6 ± 2.4 | 18.3 ± 1.8 | 20.4 ± 1.9 | |
| NGC 7217 | 37.30 ± 5.3 | |||||||
| NGC 7218 | 9.90 ± 1.8 | 11.3 ± 2.9 | 7.6 ± 1.3 | 10.1 ± 1.8 | 8.0 ± 1.1 | 3.5 ± 0.8 | ||
| IRAS 22491-1808 | 6.10 ± 1.1 | 3.3 ± 1.0 | ||||||
| NGC 7418 | 23.10 ± 3.4 | 20.8 ± 3.6 | 8.9 ± 1.6 | 6.4 ± 1.1 | ||||
| IC 1459 | 2.40 ± 0.4 | 1.7 ± 0.2 | ||||||
| NGC 7469 | 28.90 ± 4.4 | 25.8 ± 3.9 | 26.0 ± 4.7 | 33.0 ± 6.1 | 35.7 ± 4.8 | 32.4 ± 4.3 | 29.3 ± 3.9 | |
| IRAS 23128-5919 | 5.70 ± 0.8 | 6.1 ± 1.3 | 4.6 ± 0.5 | 6.0 ± 0.7 | 15.2 ± 1.6 | 9.0 ± 1.1 | 10.9 ± 1.0 | |
| NGC 7552 | 75.40 ± 13.7 | 84.4 ± 13.6 | 91.5 ± 15.2 | 103.7 ± 18.8 | 128.6 ± 22.1 | 95.4 ± 12.9 | 79.0 ± 11.8 | 63.7 ± 9.6 |
| NGC 7582 | 61.10 ± 6.3 | 53.7 ± 7.8 | 60.0 ± 6.4 | 69.1 ± 6.7 | 88.6 ± 10.9 | 63.9 ± 6.2 | 53.1 ± 5.1 | 42.8 ± 4.1 |
| IC 5325 | 20.6 ± 7.0 | 17.2 ± 3.1 | 13.9 ± 2.5 | 8.3 ± 1.3 | ||||
| NGC 7714 | 8.40 ± 2.0 | 7.9 ± 1.3 | 6.3 ± 1.0 | 8.9 ± 1.6 | 13.5 ± 2.6 | 13.8 ± 2.3 | 17.1 ± 2.3 | 14.2 ± 2.1 |
| IRAS F23365+3604 | 9.20 ± 1.1 | 7.1 ± 0.9 | 5.6 ± 0.6 | 12.0 ± 1.2 | ||||
| NGC 7771 | 39.00 ± 3.3 | 39.9 ± 6.5 | 38.4 ± 4.3 | 40.3 ± 3.3 | 42.3 ± 5.2 | 20.9 ± 2.1 | 15.9 ± 1.3 | 16.3 ± 1.5 |
| Mrk 331 | 12.40 ± 1.2 | 24.7 ± 2.9 | 19.8 ± 1.9 | 20.2 ± 1.7 | 33.0 ± 3.9 | 23.0 ± 2.2 | 13.9 ± 1.3 | 11.2 ± 1.0 |
Since the L02 observations do not have much overlap between detectors, it is difficult to properly estimate the dark current, and thus the continuum, for faint sources. In order to test the consistency of the continuum of the L02 observations, the continuum data are compared with observations of the 158 µm and 63 µm lines for galaxies that had a pointing at the same position in both the L01 and L02 AOTs. The continuum flux is taken from the linear baseline that is used for the fit to the lines at 158 µm and 63 µm for these observations. The continuum in the L02 observations accurately reproduces the continuum measured in the L01 AOT to within 5% for continuum fluxes down to 10 Jy. The continuum correlation between the two AOTs holds for fluxes below 10 Jy, but the dispersion in this relation increases by a factor of two. Thus, the L02 continuum appears to be consistent with the L01 continuum although some uncertainties exist from the dark or gain calibration due to the lack of overlapping spectra from adjacent detectors.
The continuum uncertainties quoted in Table 2, typically 15-20%, are a combination of the measurement and calibration uncertainties. In most observations, the calibration uncertainties are the dominant source of uncertainty in the continuum fluxes, but in the low flux limit (< 10 Jy), the measurement uncertainties become dominated by uncertainties in the dark current. The detector dark currents are of the same order as the continuum in this flux regime. The effect of these uncertainties in the dark current for continuum levels below 10 Jy is described below in Sections 4.1 and 4.2. Although the comparisons to IRAS and ISOPHOT data show an excellent overall agreement with the LWS continuum fluxes within the LWS 20% uncertainties down to fluxes below 10 Jy, the dispersion in these relationships increases by as much as a factor of two below 10 Jy. Although there may be large uncertainties, the measured continuum fluxes below 10 Jy are included in Table 2 because there are no biases in the agreement of the LWS fluxes with IRAS and ISOPHOT in this low-flux limit.
4.1. Comparison with IRAS 60 and 100 µm Data
An extensive comparison of the LWS continuum fluxes and IRAS catalog fluxes was carried out for galaxies unresolved by the LWS. The following criteria were applied to this study: 1) galaxies must have an IRAS Point-Source Catalog detection, 2) the far-infrared emission must be concentrated within the 75" LWS beam, and 3) LWS data must exist in the vicinity of 60 µm and 100 µm wavelengths to be used for a continuum estimation. Using these three criteria, 41 galaxies were observed in the L01 AOT and 104 galaxies in the L02 AOT.
For L01 observations, the 60 µm and 100 µm
continua are estimated by performing synthetic photometry with an
algorithm provided in ISAP. This photometry is performed on the spectra
by integrating across the IRAS passbands. The 60 µm
and 100 µm flux densities are then derived using the
IRAS assumption that the source spectral energy distribution is
of the form  f = constant. For the
comparison at 60 µm a correction must be introduced because
the LWS does not cover the entire IRAS 60 µm filter
(43-197 µm vs. 27-87 µm). The galaxies used for
this comparison span a wide range of 60 µm / 100
µm ratios (0.2-1.4), so the amount of the integrated flux in
the IRAS 60 µm filter missed by the LWS varies
depending on the shape of the infrared spectral energy distribution of
the galaxy.
Dale & Helou (2002)
present a sequence of galaxy
spectral energy distributions sorted across a range of 60
µm / 100 µm ratios. Using these models, the amount
of the total integrated flux in the IRAS 60 µm filter
missed by the LWS between 27 µm and 43 µm varies
from 3% to 7% for these 60 µm/100 µm
ratios. This correction based on the 60 µm / 100
µm ratio of the galaxy is applied to the LWS 60
µm fluxes derived from L01 observations.
f = constant. For the
comparison at 60 µm a correction must be introduced because
the LWS does not cover the entire IRAS 60 µm filter
(43-197 µm vs. 27-87 µm). The galaxies used for
this comparison span a wide range of 60 µm / 100
µm ratios (0.2-1.4), so the amount of the integrated flux in
the IRAS 60 µm filter missed by the LWS varies
depending on the shape of the infrared spectral energy distribution of
the galaxy.
Dale & Helou (2002)
present a sequence of galaxy
spectral energy distributions sorted across a range of 60
µm / 100 µm ratios. Using these models, the amount
of the total integrated flux in the IRAS 60 µm filter
missed by the LWS between 27 µm and 43 µm varies
from 3% to 7% for these 60 µm/100 µm
ratios. This correction based on the 60 µm / 100
µm ratio of the galaxy is applied to the LWS 60
µm fluxes derived from L01 observations.
For L02 observations, synthetic photometry cannot be used because of the gaps between the multiple short scan spectra. Instead, a monochromatic flux is estimated by fitting a linear baseline to a 2-5 µm slice of spectra surrounding the wavelengths 60 µm and 100 µm. The L02 60 µm and 100 µm monochromatic continuum fluxes must also have a secondary correction applied because these monochromatic fluxes cannot be directly compared to the IRAS fluxes. Since the fluxes derived from the L02 observations are taken by fitting a linear baseline through the IRAS filter central wavelengths, the assumption would be that the flux at these wavelengths is equal to the flux over the entire IRAS passband for galaxies of these 60 µm/100 µm colors. A calculation of the difference between the monochromatic fluxes, estimated by fitting a linear baseline to the spectra at 60 µm and 100 µm and the synthetic photometry fluxes from integrating over the IRAS filters, is done using a set of pointed observations in which the same sky position on a galaxy was observed in both the L01 and L02 AOTs. The monochromatic fluxes overestimate the integrated spectral photometry on average by 11% at 60 µm and 9% at 100 µm. The monochromatic L02 fluxes are corrected for these overestimations from using linear fits to the spectra.
After these two corrections are applied, the background is estimated using IRSKY and then removed from the LWS data. Figure 8 shows a comparison of the LWS and IRAS data. The LWS error bars are a combination of the uncertainties associated with the baseline fit to the line and the pipeline calibration uncertainties. The IRAS error bars are taken directly from the IRAS Point Source Catalog as given by NED. The LWS fluxes are, on average, 1% lower and 2% higher than IRAS at 60 µm and 100 µm, respectively, for IRAS fluxes above 10 Jy, a remarkable agreement. Below 10 Jy, the dispersion increases from 20% to 50%, not surprising since the dark current is comparable to 10 Jy for these sources. Both the L01 and L02 continuum fluxes show similar offsets and dispersions in the LWS-IRAS comparison.
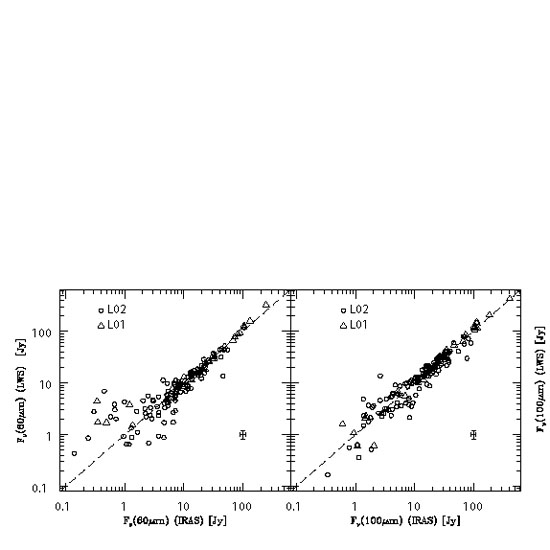 |
Figure 8. Comparison of LWS continuum fluxes to the IRAS fluxes at 60 µm and 100 µm. Triangles (circles) are continuum fluxes from L01 (L02) observations. A typical error bar is plotted in the lower right of each plot. The LWS error bar is calculated from the combination of the systematic and measured flux uncertainties and represents an average 20% uncertainty. The IRAS flux error bar is taken from the IRAS Point Source Catalog and represents an average 10% uncertainty. The dashed line is the one-to-one correlation. |
4.2. Comparison with ISOPHOT 170 µm Continuum Data
For galaxies where the infrared continuum peaks near 60 µm, the continuum level at 170 µm is a factor of 2 or more lower compared to the peak. For galaxies with 60 µm flux densities less than 10 Jy, the detection limit of the LWS may be reached, and the reliability of the 170 µm continuum is once again subject to uncertainties in the dark current. Using published fluxes from ISOPHOT pointed observations at 180 µm (Klaas et al. 2001) and 170 µm Serendipity Survey (Stickel et al. 2000), 25 galaxies constrained to the LWS beam are compared to 170 µm fluxes measured by the LWS.
Both ISOPHOT studies referenced above utilized the broad C_160 filter. Therefore, two corrections must be applied to the LWS monochromatic fluxes. These monochromatic fluxes are compared to 170 µm fluxes derived by integrating over the ISOPHOT C_160 filter using the synthetic photometry algorithm in ISAP. On average, the monochromatic LWS fluxes are 11% higher than their synthetic counterparts, and this correction is applied to the LWS monochromatic fluxes. The second correction applied adjusts for the difference in wavelength spanned by the LWS and ISOPHOT C_160 filter (43-197 µm vs. 100-240 µm). The flux missed by the LWS in the ISOPHOT filter depends upon the spectral shape of the galaxy, and this flux is estimated by assuming the Dale & Helou (2002) spectral shape of a galaxy for a given 60 µm / 100 µm ratio. Typically, this correction is approximately 3% for the range of 60 µm / 100 µm ratios of these galaxies.
The total correction applied to LWS flux densities is approximately 14%, and Figure 9 is the resulting plot of this comparison. The ISOPHOT and LWS flux densities track each other well between 1 and 100 Jy, particularly if just ISOPHOT Pointed data are considered, although the dispersion increases significantly below 10 Jy. This effect is due to the large uncertainties in the dark current at this wavelength and flux regime. The ISOPHOT Serendipity Survey (SS) flux densities are systematically a bit high compared to the LWS data. Serendipitous Survey sources were observed as they streamed by the instrument field-of-view; the fluxes reconstructed from the glancing scans may have been slightly overestimated. Considering the differences in beam size and calibration between the LWS and ISOPHOT instruments, the 30% overall agreement is consistent with the uncertainties of the two instruments at this wavelength.
 |
Figure 9. Comparison of LWS continuum fluxes to ISOPHOT Serendipity Survey fluxes (Stickel et al. 2000) at 170 µm for galaxies unresolved by the LWS. Filled circles are measurements from L01 observations and open triangles are from L02 observations. The ISOPHOT error bars represent 40% calibration uncertainties quoted by Stickel et al. (2000) and the LWS error bars represent 30% calibration uncertainties at 170 µm. The dashed line is the one-to-one correlation. |
4.3. Comparison with Models of Galaxy Infrared Spectral Energy Distributions
The data for the subset of galaxies smaller than the LWS aperture discussed in the previous section are compared to a semi-empirical model for the infrared spectral energy distributions of normal star-forming galaxies between 3 and 1100 µm (Dale et al. 2001; Dale & Helou 2002). The comparison of the LWS and model flux densities provides a consistency check of the LWS continuum flux densities, especially at the longer wavelengths where few continuum measurements from other observatories exist. The model is based on the combination of emission curves for large and very small grains and aromatic feature carriers for varying interstellar radiation fields, and are combined assuming a variable power-law distribution of dust mass over heating intensity. The model is constrained by IRAS and ISO observations of a sample of 60 normal, star-forming galaxies (Dale et al. 2000). According to this model, a sequence of global star formation activity level is formed as galaxies are sorted according to their 60 µm/100 µm ratio; the IRAS 60 µm/100 µm ratios are used in conjunction with the models to predict the LWS continuum levels at various wavelengths. The observed LWS continuum agrees with the predicted model flux densities (anchored by 60 and 100 µm IRAS photometry) for these galaxies to within 25% at 52 µm, 57 µm, 63 µm, 88 µm, 122 µm, 145 µm, 158 µm, and 170 µm and is presented in Figure 10. The spectral energy distribution models and the comparison with the LWS continuum are explored further in Dale & Helou (2002).
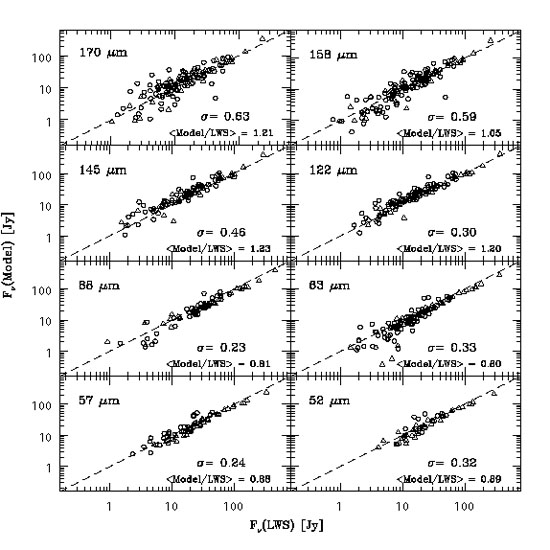 |
Figure 10. Comparison of the LWS continuum fluxes of galaxies unresolved by the LWS beam and the Dale & Helou (2002) model prediction for eight far-infrared wavelengths. Triangles (circles) represent continuum fluxes taken from a fully sampled L01 (fitted L02 line) spectrum. The dashed line is the one-to-one correlation. |
