


All spectral lines in this paper are unresolved
( v ~ 1500
km s-1). Thus, the line fluxes are calculated assuming the
line profile to be dominated by a Gaussian instrumental profile
(FWHM = 0.29 µm for
v ~ 1500
km s-1). Thus, the line fluxes are calculated assuming the
line profile to be dominated by a Gaussian instrumental profile
(FWHM = 0.29 µm for
 < 93
µm, 0.60 for
> 80
µm; for wavelengths between 80 and 93
µm, the spectral resolution depends on which of the two
overlapping detectors (SW5, LW1) the line was measured). A Gaussian has
been shown to fit the LWS instrumental profiles to within 2%
(Gry et al. 2003).
Example line scans from this sample with various
signal-to-noise ratios are displayed with a Gaussian fit in
Figure 11. A detected line in this sample
is defined as one that has a peak flux at the
3
< 93
µm, 0.60 for
> 80
µm; for wavelengths between 80 and 93
µm, the spectral resolution depends on which of the two
overlapping detectors (SW5, LW1) the line was measured). A Gaussian has
been shown to fit the LWS instrumental profiles to within 2%
(Gry et al. 2003).
Example line scans from this sample with various
signal-to-noise ratios are displayed with a Gaussian fit in
Figure 11. A detected line in this sample
is defined as one that has a peak flux at the
3 or higher
confidence level. The statistical uncertainty associated with each line
is
f(rms),
the spectral
resolution times the root mean square variations in the flux density of
the local continuum. The dominant uncertainty for most observations is
the systematic flux uncertainty that is taken from the pipeline
processing. This uncertainty is a combination of the dark current,
illuminator, and Uranus model calibration uncertainties. The total
uncertainty is calculated by adding the statistical and systematic
uncertainties in quadrature. The total uncertainty is typically between
10% and 20% of the line flux measurement, depending on the quality of
the observation. In the case of non-detections,
3 upper limits
are calculated by multiplying the local statistical uncertainty describe
above by 3. 4 The data for
galaxies from previous studies are included as a subset of the larger
sample presented here, but are independently reduced in the manner
described in Section 3. In general, the line
fluxes presented here agree with literature values to within 30%. The
lines, rest wavelengths, and transitions for this sample are listed in
Table 3.
or higher
confidence level. The statistical uncertainty associated with each line
is
f(rms),
the spectral
resolution times the root mean square variations in the flux density of
the local continuum. The dominant uncertainty for most observations is
the systematic flux uncertainty that is taken from the pipeline
processing. This uncertainty is a combination of the dark current,
illuminator, and Uranus model calibration uncertainties. The total
uncertainty is calculated by adding the statistical and systematic
uncertainties in quadrature. The total uncertainty is typically between
10% and 20% of the line flux measurement, depending on the quality of
the observation. In the case of non-detections,
3 upper limits
are calculated by multiplying the local statistical uncertainty describe
above by 3. 4 The data for
galaxies from previous studies are included as a subset of the larger
sample presented here, but are independently reduced in the manner
described in Section 3. In general, the line
fluxes presented here agree with literature values to within 30%. The
lines, rest wavelengths, and transitions for this sample are listed in
Table 3.
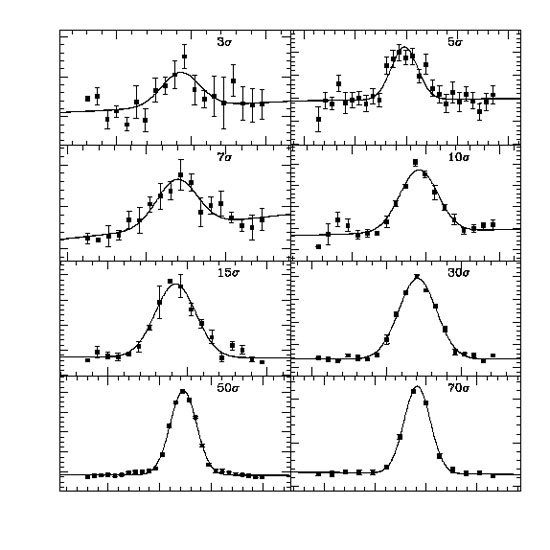 |
Figure 11. Examples of the [C II] 158 µm line found in this sample. This figure is a representative selection of varying signal-to-noise detections and shows how well a Gaussian with the effective instrumental width fits the line data. Error bars are taken from the uncertainty in the averaging of the spectral scans in each bin. |
| Line | Wavelength (µm) | Transition |
| [OIII] | 51.82 | 3P2
 3P1
3P1 |
| OHa | 52.93/53.06 | 2 3/2
J=11/2
23/2
J=9/2 3/2
J=11/2
23/2
J=9/2 |
| 53.26/53.35 | 21/2
J= 3/2
23/2
J=3/2 | |
| [NIII] | 57.32 | 2P3/2
2P1/2 |
| H2O | 58.70 | o-H2O 432-321 |
| [OI] | 63.18 | 3P1
3P2 |
| OHa | 65.13/65.28 | 23/2
J= 9/2
23/2
J=7/2 |
| H2Oa | 66.44 | o-H2O 330-221 |
| 67.09 | p-H2O 331-220 | |
| Unidentified Line | 74.24 | |
| H2O | 75.38 | o-H2O 321-212 |
| OHa | 79.12/79.18 | 21/2
J= 1/2
23/2
J=3/2 |
| OHa | 84.42/84.60 | 23/2
J= 7/2
23/2
J=5/2 |
| [OIII] | 88.36 | 3P1
3P0 |
| H2Oa | 100.91 | o-H2O 514-423 |
| 100.98 | p-H2O 220-111 | |
| H2O | 108.07 | o-H2O 221-110 |
| OHa | 119.23/119.44 | 23/2
J= 5/2
23/2
J=3/2 |
| [NII] | 121.89 | 3P2
3P1 |
| [OI] | 145.53 | 3P0
3P1 |
| [CII] | 157.74 | 2P3/2
2P1/2 |
| OHa | 163.12/163.40 | 21/2
J= 3/2
21/2
J=1/2 |
| COa | 162.81 | J=16 15 |
| a Line detected cannot be accurately identified due to the resolution of the LWS. The line is one or a blend of the listed transitions. | ||
5.1. Far-Infrared Fine Structure Lines
A number of studies have produced models that predict the strength of far-infrared fine structure lines such as [C II] 158 µm, [O I] 145 µm, and [O I] 63 µm as a function of the density and radiation intensity in PDRs (e.g., Tielens & Hollenbach 1985; Wolfire, Tielens & Hollenbach 1990; Hollenbach, Takahashi, & Tielens 1991; Spinoglio & Malkan 1992; Kaufman et al. 1999; Abel et al. 2005; Le Petit et al. 2006; Dopita et al. 2006; Meijerink, Spaans, Israel 2007; Groves et al. 2008). The [C II] 158 µm and [O I] 63 µm lines act as the primary coolants to the dense (n ~ 10-105 cm-3 or more), warm (T ~ 100-1000 K), neutral media. Other far-infrared fine structure lines probed by ISO, such as [N II] 122 µm, [O III] 52 µm and 88 µm, and [N III] 57 µm, are important to understanding H2 regions. From these H2 region lines, the electron densities ne and the effective temperature of the ionizing stars can be determined. The fluxes and associated uncertainties for these seven far-infrared fine structure line measurements are given in Table 4 with the resolved and unresolved subsets noted in the table.
The C+ fine structure transition at 157.74 µm is
the dominant coolant of the neutral interstellar medium and traces
PDRs. Because of the low ionization potential of neutral carbon
(11.26 eV), [C II] 158 µm will emanate from neutral
surface layers of far-ultraviolet illuminated neutral gas
clouds. C+ is also easy to excite
(E / k ~
91 K and ncrit ~ 3 ×
103 cm-3) and therefore cools the warm,
neutral gas
(Tielens & Hollenbach
1985;
Wolfire et al. 1990).
In addition to PDRs, significant contributions to [C II] 158 µm
emission can arise from ionized gas in diffuse H1 and H2 regions,
although it is unclear how much [C II] 158 µm comes from
these regions
(Madden et al. 1993,
1997;
Petuchowski & Bennett
1993;
Heiles 1994;
Sauty, Gerin & Casoli
1998;
Malhotra et al. 2001;
Contursi et al. 2002;
Sauvage, Tuffs, &
Popescu 2005).
[C II] 158 is detected in 153 unresolved galaxies and
3 upper limits are
determined in another 17 galaxies in the unresolved subset of
galaxies. [C II] 158 µm is detected in all 46 galaxies in
the resolved sample.
5.1.2. [O I] 63 µm & [O I] 145 µm
Neutral oxygen has two fine structure transitions at 63 µm
and 145 µm and has an ionization potential of
13.62 eV. Atomic oxygen is only found in neutral regions and exists
deeper into clouds than C+. [O I] 63 µm becomes
the main coolant in warmer and denser environments (T >
200 K and n > 105 cm-3) due to
its higher excitation energies and critical densities
(E / k ~
228 K; ncrit ~ 8.5 ×
105 cm-3 for [O I] 63 µm at
T ~ 100 K and
E / k
~ 325 K; ncrit ~ 1
× 105 cm-3 for [O I] 145 µm
at T ~ 100 K). The [O I] 63 µm line may be
particularly strong in the X-ray dissociated regions surrounding active
galactic nuclei
(Maloney, Hollenbach,
& Tielens 1996;
Dale et al. 2004).
In this sample, the [O I] transitions are always observed in
emission except in the ultraluminous infrared galaxy Arp 220, where
the 63 µm line is observed in absorption. The case of
Arp 220 is discussed as part of a progression of
emission and absorption line characteristics in a spectroscopic survey
of infrared bright galaxies
(Fischer et al. 1999)
and its absorption spectrum is discussed in detail in
González-Alfonso et
al. (2004).
In the
unresolved galaxy sample, the [O I] 63 µm line is detected
in 93 galaxies with 3
upper limits available for an additional
25, while in the resolved galaxy sample it is detected in 28 galaxies
with 3 upper limits
available for an additional three
galaxies. In the unresolved galaxy sample, the much fainter [O I] 145
µm line is detected in 20 galaxies and
3 upper limits
are measured for another 15. In the resolved galaxy sample, the [O I]
145 µm line is detected in nine galaxies and
3 upper
limits are available for another two resolved systems.
Neutral nitrogen has an ionization potential of 14.53 eV. One of
the brighter lines of singly-ionized nitrogen, the [N II] 122
µm line has a critical electron density of 3.1 ×
102 cm-3. The [N II] 122 µm
transition arises only in diffuse, ionized H2 regions. The Cosmic
Background Explorer (COBE) and the Kuiper Airborne
Observatory provided the first astronomical detections of the [N II]
122 µm line
(Wright et al. 1991;
Colgan et al. 1993).
This sample greatly expands the number of extragalactic [N II] detections
from earlier studies
(Malhotra et al. 2001).
The [N II] 122
µm line is detected in 38 unresolved galaxies and
3
upper limits are measured for an additional 41 of the galaxies in the
unresolved subset. For the resolved subset of galaxies, [N II] is
detected in 16 galaxies and
3 upper limits are
reported for another two.
An ionizing energy of 35.12 eV is required to create O++ from
singly-ionized oxygen. Due to this high ionization potential, the
[O III] 52 µm and 88 µm transitions occur in H2
regions. Using the methodology of
Rubin et al. (1994),
the ratio of these two lines, [O III] 88 µm / [O III] 52
µm, can be used to derive the average electron density
ne of these regions within galaxies
(Duffy et al. 1987;
Carral et al. 1994;
Lord et al. 1996;
Fischer et al. 1996;
Colbert et al. 1999;
Unger et al. 2000;
Malhotra et al. 2001;
Hunter et al 2001).
The [O III] 88
µm line is detected in 52 galaxies and
3 upper limits
are available for 14 galaxies in the unresolved subset. The [O III] 88
µm line is detected in 16 galaxies in the resolved galaxy
sample while 3 upper
limits are available for an additional
galaxy in the resolved subset. The lower signal-to-noise [O III] 52
µm line is detected in 11 unresolved galaxies with
3
upper limits for another 22 available, whereas the [O III] 52
µm line is detected in five resolved galaxies and there are
an additional six 3
upper limits for the resolved galaxy subset.
N+ has a high ionization potential of 47.45 eV and therefore,
the 57 µm transition of N++ is only found in the
ionized H2 regions of the galaxies in this sample. The ratio [N III] 57
µm / [N II] 122 µm provides a measure of the
effective temperature Teff
(Rubin et al. 1994).
The LWS allowed a more detailed study of the faint [N III] 57
µm line since there are few detections of this line in the
literature
(Duffy et al. 1987;
Malhotra et al. 2001).
For the unresolved
subset of galaxies, the [N III] 57 µm line is detected in
nine galaxies and 3
upper limits are available for another 24
galaxies. The [N III] 57 µm line is detected in two resolved
galaxies and 3 upper
limits are determined for six additional galaxies resolved by the LWS
aperture.
Molecular line fluxes are reported in Table 5 for several of the brightest galaxies observed in this sample with IRAS 60 µm fluxes typically higher than 100 Jy. Molecular lines are observed in both emission and absorption for these galaxies.
| Galaxy | TDTa | R.A. | Dec. | OH | HO | OH | HO | unidentified | HO | OH | OH | HO | HO | OH | OH/CO} |
| (J2000.0) | (J2000.0) | 53 µm | 59 µm | 65 µm | 67 µm | 74 µm | 75 µm | 79 µm | 84 µm | 101 µm | 108 µm | 119 µm | 163 µm | ||
| NGC 0253 | 24701103b | 00 47 33.3 | -25 17 18 | 11.76c | |||||||||||
| NGC 0253 | 56901708b | 00 47 33.3 | -25 17 18 | 7.12c | 11.63c | ||||||||||
| NGC 0253 | 79900508b | 00 47 33.3 | -25 17 18 | 2.24 | |||||||||||
| NGC 0891 | 61100256b | 02 22 33.0 | +42 20 55 | 1.11c | |||||||||||
| NGC 0891 | 61401144b | 02 22 33.2 | +42 20 58 | 1.33c | |||||||||||
| NGC 106882000605 | 02 42 40.6 | -00 00 48 | 1.36 | ||||||||||||
| NGC 1068 | 82000704 | 02 42 40.6 | -00 00 48 | 1.32 | 1.31 | ||||||||||
| NGC 1068 | 82001106 | 02 42 40.6 | -00 00 48 | 1.24 | 1.60 | ||||||||||
| M 82 | 18000501b | 09 55 52.4 | +69 40 46 | 7.88c | |||||||||||
| M 82 | 65800502b | 09 55 52.2 | +69 40 46 | 8.17c | |||||||||||
| M 82 | 65800611b | 09 55 52.2 | +69 40 46 | ~8.45c | |||||||||||
| Mrk 231 | 05100540 | 12 56 14.6 | +56 52 24 | 1.10c | |||||||||||
| Mrk 231 | 18001306 | 12 56 14.2 | +56 52 24 | 1.09c | 0.31c | ||||||||||
| Mrk 231 | 60300241 | 12 56 14.2 | +56 52 24 | 0.65c | ~0.34c | ||||||||||
| NGC 4945 | 08101705b | 13 05 26.2 | -49 28 15 | 13.15c | |||||||||||
| NGC 4945 | 28000440b | 13 05 26.5 | -49 27 54 | 7.44c | 11.62c | ||||||||||
| Arp 220 | 27800202 | 15 34 57.2 | +23 30 11 | 4.30c | 1.85c | 1.40c | 3.09c | 2.01c | 2.75c | 0.38 | |||||
| Arp 220 | 61001559 | 15 34 57.2 | +23 30 11 | 0.68c | 0.76c | 0.40 | |||||||||
| Arp 220 | 64000801 | 15 34 57.2 | +23 30 11 | 5.31c | 2.10c | 1.37c | 1.68c | 2.34c | 2.29c | ||||||
| Arp 220 | 64000916 | 15 34 57.2 | +23 30 11 | 4.62c | 1.55c | 1.36c | 1.00c | 2.97c | ~2.84c | 0.40 | |||||
| Notes - Units of right ascension are hours, minutes, and seconds, and units of declination are degrees, arcminutes, and arcseconds. Line fluxes are in units of 10-15 W m-2. Upper limits are also available via L01 range scans, e.g., Arp 220 and Mrk 231. | |||||||||||||||
| a TDT is the ISO observation number. It has the form RRRSSSOO where RRR=revolution number, SSS=sequence number within the revolution, and OO=observation number within an observer's proposal. | |||||||||||||||
| b Observation considered an extended source in this paper. May require an extended source correction. | |||||||||||||||
| c Flux measured is in absorption rather than emission. | |||||||||||||||
Water (H2O) has been reported in two galaxies in this sample. The unresolved 101 µm ortho-para-H2O pair is found in absorption for NGC 4945. All five H2O transitions reported in this paper are observed in absorption in Arp 220. Detailed analysis of the far-infrared H2O lines in Arp 220 and Mrk 231 are presented in González-Alfonso et al. (2004, 2008).
Six transitions of Hydroxyl (OH) have been detected in this sample. The OH 53 µm transition is measured in absorption and the 163 µm transition in emission for NGC 253 and Arp 220. All galaxies in Table 5 show OH from the ground level at 119 µm, and with the exception of the archetypical Seyfert 2 galaxy NGC 1068, this transition is measured in absorption. In fact, the OH lines detected for NGC 1068, at 79, 119, and 163 µm, are observed in emission, suggesting a unique excitation environment (Spinoglio et al. 2005). The ultraluminous Seyfert 1 galaxy Mrk 231 shows an absorption line spectrum very similar to that of the ultraluminous galaxy Arp 220. The multiple OH detections in NGC 253, NGC 1068, Mrk 231, and the megamaser galaxies IRAS 20100-4156 and III Zw 35 have been previously reported and analyzed in detail (Bradford et al. 1999; Kegel et al. 1999; Goicoechea, Martín-Pintado, & Cernicharo 2005; Spinoglio et al. 2005; González-Alfonso et al. 2008). In Arp 220, all six transitions of OH reported in this paper are detected. A detailed analysis of the far-infrared absorption spectrum of Arp 220 and the implications for understanding the "[C II] 158 µm deficit" (see Section 6.1, Luhman et al. 2003) is discussed in González-Alfonso et al. (2004).
An unidentified emission line at 74.24 µm, also reported in NGC 7027 (Liu et al. 1996) and RWC 103 (Oliva et al. 1999), is detected in NGC 1068. The line flux and associated uncertainty for this line is listed in Table 5.
5.4. Serendipitous Galactic [C II] 158 µm
The Far-Infrared Absolute Spectrophotometer (FIRAS) on the COBE satellite conducted an unbiased survey of the far-infrared emission from our Galaxy. The FIRAS spectral line survey included the emission lines from [C II] 158 µm, [N II] 122 µm and 205 µm, [C1] 370 µm and 609 µm, and CO J = 2-1 through J = 5-4 with a resolution of 7 and were first reported by Wright et al. (1991). The [C II] 158 µm line had sufficient strength to be mapped by FIRAS, and Bennett et al. (1994) present detailed maps of this emission line. The all-sky maps of the [C II] 158 µm line show the highest concentration at low Galactic latitudes (|b| < 20°). The cosecant relation provided by Bennett et al. (1994) for Galactic [C II] 158 µm emission based on COBE data is
 |
(1) |
nominally applicable for |b| > 15°.
There are approximately 40 galaxies in this sample that reside at low Galactic latitudes of |b| < 20°. Galactic [C II] 158 µm contamination for low Galactic latitude galaxies can be a concern, particularly if they have recessional velocities smaller than the velocity resolution of the LWS (|v| < 1500 km s-1). The impact of Galactic [C II] 158 µm contamination in such systems can be directly addressed via off-galaxy/sky observations made in concert with the targeted extragalactic observations. Table 6 lists six galaxies with |v| < 1500 km s-1 for which sky observations are available. These off-galaxy positions were typically carried out 4-6 away from the targeted extragalactic direction. The level of Galactic [C II] 158 µm contamination is between 10% and 25% of the total [C II] 158 µm in the LWS aperture for these six galaxies. The [C II] 158 µm line fluxes listed in Table 4 for these six galaxies have had the foreground Milky Way [C II] 158 µm from Table 6 removed.
| Galaxy | TDTa | l | b | cz | Galactic | Galactic | extragalactic | contaminationf |
| (°) | (°) | (km s-1) | predictionb | observationc | observationd | (%) | ||
| IC 10 | 45700606 | 118.89 | -3.23 | -344 | 25.38 | 20.73 ± 0.48 | 70.93g | 23.4 |
| 45700607 | 119.06 | -3.45 | 23.76 | 12.44 ± 0.48 | ||||
| Maffei 2 | 85800683e | 136.48 | -0.55 | -17 | 148.97 | 27.47 ± 0.87 | 112.62 | 24.4 |
| NGC 1156 | 65300185 | 156.37 | -29.28 | 375 | 2.92 | 2.51 ± 0.58 | 17.54 | 14.3 |
| UGC 02855 | 62902697 | 136.91 | +12.33 | 1202 | 6.70 | 4.85 ± 0.58 | 50.51 | 9.6 |
| NGC 1569 | 64600490 | 143.61 | +11.31 | -104 | 7.29 | 8.22 ± 0.86 | 65.99 | 12.5 |
| 3C 120 | 80901988 | 190.37 | -27.40 | 9896 | 3.11 | 3.95 ± 0.29 | 3.66 | 0 |
| NGC 1614 | 85501010 | 204.45 | -34.38 | 4778 | 2.53 | 4.44 ± 0.39 | 21.80 | 0 |
| NGC 3620 | 27600982 | 297.19 | -14.32 | 1680 | 5.78 | 3.47 ± 0.39 | 20.93 | 0 |
| UGCA 332 | 25700705 | 310.84 | +50.49 | 2107 | 1.85 | 0.87 ± 0.10 | 0.66 | 0 |
| ESO 173-G015 | 30601434 | 307.77 | +5.04 | 3006 | 16.28 | 21.80 ± 2.22 | 48.70 | 0 |
| NGC 6821 | 31900733 | 32.89 | -14.83 | 1525 | 5.59 | 3.49 ± 0.58 | 9.43 | 0 |
| NGC 6946 | 45100131 | 95.80 | +12.14 | 48 | 6.80 | 2.69 ± 0.49 | 20.58g | 13.1 |
| Note. - [CII] 158 µm intensities are in 10-6 ergs cm-2 s-1 sr-1 assuming a 75" aperture diameter. | ||||||||
| a TDT is the ISO observation number. It has the form RRRSSSOO where RRR=revolution number, SSS=sequence number within the revolution, and OO=observation number within an observer's proposal. | ||||||||
| b Milky Way [CII] 158 µm predicted by Equation 1. | ||||||||
| c Milky Way [CII] 158 µm measured by ISOLWS. | ||||||||
| d [CII] 158 µm measured for external target galaxy. | ||||||||
| e Observation considered an extended source in this paper. May require an extended source correction. | ||||||||
| f Percent of observed [CII] arising from the Milky Way. This foreground contamination has been removed from the [CII] fluxes listed in Table 4 for these galaxies. | ||||||||
| g An average value measured in the LWS aperture from multiple observations. | ||||||||
Equation 1 provides another method for estimating the Galactic [C II] 158 µm contamination for galaxies with |v| < 1500 km s-1. To enhance the comparison between LWS observations and predictions from the COBE relation, an additional six galaxies have been added to Table 6, galaxies with recessional velocities large enough such that Milky Way [C II] 158 µm contamination is not an issue. The maps at 100 µm and the LWS line spectra containing both Galactic C+ and extragalactic C+ for three higher redshift galaxies are presented in Figure 12. The C+ line associated with each target galaxy is located at the redshift of the galaxy, whereas the foreground Milky Way C+ is at the rest wavelength of 157.74 µm. The [C II] 158 µm intensities predicted from Equation 1 agree with the observations to within a factor of 2 for all galaxies in Table 6 except Maffei 2, which lies a half degree from the Galactic plane. For the remaining dozen or so galaxies with |v| < 1500 km s-1 and |b| < 20° that lack off-galaxy/sky observations, the contamination from Milky Way [C II] 158 µm is predicted from Equation 1 to be no more than 25%. For the 55 higher latitude (|b| > 20°) galaxies with |v| < 1500 km s-1 and no off-source observation, any Milky Way [C II] 158 µm contamination is likely much less than 10%.
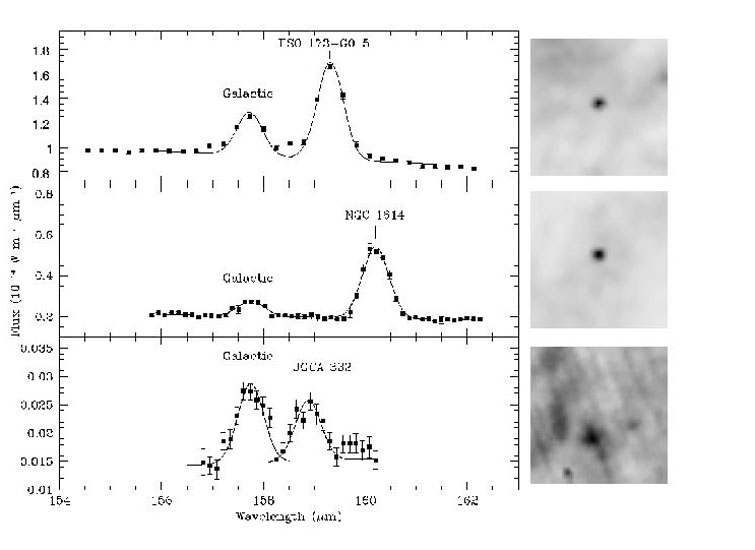 |
Figure 12. Three LWS spectra with both Milky Way [C II] 158 µm and C+ emission at the redshift of the observed galaxy is plotted along with the corresponding 1° × 1° IRAS 100 µm images. The LWS observation for each galaxy was located at the center of each IRAS image. The line through the spectra is a best fit using a linear baseline and two instrumental width Gaussians. |
The four high latitude detections of Galactic [C II] 158 µm listed in Table 6 may either be due to the warm ionized medium (Petuchowski & Bennett 1993) or high latitude molecular clouds (Magnani et al. 1996). The IRAS Sky Survey Atlas images at 60 µm and 100 µm reveal extended Galactic emission in the same direction as the four high latitude [C II] 158 µm detections. Reach et al. (1998) describe the location of the UGCA 332 observation as a high latitude warm infrared excess H2 region around the nearby B star Spica using far-infrared (60-240 µm) data from the COBE Diffuse Infrared Background Experiment and the Leiden-Dwingeloo H1 survey (Hartmann & Burton 1997), and the spectrum for this object in Figure 12 confirms the foreground nature of this line emission.
