


In this section the trends in the far-infrared fine structure line fluxes are examined for the subset of 181 galaxies unresolved by the LWS beam. Line-to-line and line-to-far-infrared ratios are examined across a broad range of 60 µm / 100 µm and FIR/B values. The 60 µm / 100 µm ratio is an indicator of the dust heating intensity in galaxies, which is related to the star formation activity in a galaxy. The FIR/B ratio compares the luminosity reprocessed by dust to that of escaping starlight, indicating star formation activity along with the effects of extinction. The intent here is to identify major trends or lack thereof, as opposed to carrying out a detailed physical analysis with model comparisons.
Previous studies
(Malhotra et al. 1997,
2001;
Luhman et al. 1998,
2003;
Leech et al. 1999;
Negishi et al. 2001)
of the [C II] 158
µm / FIR ratio for galaxies reveal a trend with dust
heating intensity as measured by 60 µm/100 µm
and/or FIR/B. Figure 13 shows
this trend for the 181 unresolved galaxies, a trend that broadly holds
for all morphological types. A [C II] / FIR ratio that decreases
from 1% to 0.1% with increasingly warm infrared color is typical of
normal and starburst galaxies, confirming earlier studies based on
smaller samples
(Crawford et al. 1985;
Stacey et al. 1991;
Malhotra et al. 1997,
2001;
Luhman et al. 2003;
Verma et al. 2005).
As the dust
temperature increases for the most actively star-forming galaxies in
this sample (60 µm / 100 µm
 0.8), the
[C II] / FIR ratio reaches levels as low as 0.01%. The elliptical
galaxies NGC 6958 and NGC 1052 are a factor of 2-5 lower than
typical values of [C II] / FIR for normal galaxies as first
reported by
Malhotra et al. (2000).
However, the remaining early-type
galaxies (ellipticals and lenticulars) appear to have [C II] / FIR
ratios similar to those of the other morphological types. [C II] 158
µm emission in irregular galaxies is higher relative to the
[C II] 158 µm emission in spiral galaxies of the same
far-infrared color temperature shown in
Figure 13, as was also noted by
Hunter et al. (2001).
0.8), the
[C II] / FIR ratio reaches levels as low as 0.01%. The elliptical
galaxies NGC 6958 and NGC 1052 are a factor of 2-5 lower than
typical values of [C II] / FIR for normal galaxies as first
reported by
Malhotra et al. (2000).
However, the remaining early-type
galaxies (ellipticals and lenticulars) appear to have [C II] / FIR
ratios similar to those of the other morphological types. [C II] 158
µm emission in irregular galaxies is higher relative to the
[C II] 158 µm emission in spiral galaxies of the same
far-infrared color temperature shown in
Figure 13, as was also noted by
Hunter et al. (2001).
 |
Figure 13. The ratio of [C II] 158 µm to far-infrared continuum is plotted against the IRAS 60 µm/100 µm and FIR/B ratios for galaxies unresolved by the LWS. Galaxies of spiral (T = 0-9), lenticular (T = -3,-2,-1), elliptical (T = -6,-5,-4), irregular (T = 10,11,90), peculiar (T = 99), and unknown morphology are respectively plotted as circles, diamonds, squares, stars, and asterisks. AGN are indicated by filled symbols. Regardless of morphology, the [C II] 158 µm / FIR ratio decreases as the 60 µm / 100 µm and FIR/B ratios increase. |
There is a large spread in the [C II]/FIR ratio for a given 60 µm/100 µm and FIR/B ratio. Despite this, there are several observed trends in the [C II]/FIR shown in Figure 13 and several possible explanations for these trends in galaxies.
The [C II]/FIR peaks for normal, star-forming galaxies with a 60 µm / 100 µm ratio of 0.3-0.6 and FIR/B ratio between 0.01 and 1, consistent with the earlier studies mentioned above. These galaxies may have a higher fraction of intermediate-mass stars that are efficient at producing ultraviolet and [C II] 158 µm line emission, thus, causing the peak for these galaxies. Alternatively, the high [C II]/FIR values for at least the early-types may simply due to a dearth of far-infrared emission.
The [C II]/FIR ratios for quiescent galaxies below a 60 µm / 100 µm ratio of 0.3 and FIR/B ratio of 0.1 are, on average, similar to or slightly less than those for normal, star-forming galaxies. There is some evidence for lower [C II]/FIR ratios in the quiescent galaxies of the Virgo Cluster as suggested in this study and Leech et al. (1999). Quiescent galaxies with this range of 60 µm / 100 µm and FIR/B have a larger old low-mass stellar population than normal galaxies, and produce less ultraviolet and [C II] 158 µm line emission, possibly causing a decrease in the observed [C II]/FIR ratio.
The [C II]/FIR decreases with increasing 60 µm / 100 µm and FIR/B ratio (Malhotra et al. 1997, 2001). This trend has been seen within our Galaxy (Nakagawa et al. 1995; Bennett et al. 1994) and is not surprising for a sample of galaxies spanning a large range of 60 µm / 100 µm and FIR/B ratios. Galaxies with 60 µm/100 µm ratios greater than 0.6 and FIR/B ratios greater than unity have increasingly warmer dust temperatures, most likely due to more extreme star formation. These actively star-forming galaxies have a large proportion of massive O stars that produce hard ultraviolet radiation. Several explanations from previous studies have been offered for the decrease in the [C II]/FIR ratio in galaxies with the warmest dust temperatures. Malhotra et al. (2001) propose that the decrease in [C II]/FIR is due to the dust grains becoming more positively charged and less efficient at heating the gas for high ratios of ultraviolet flux-to-gas density (G0 / n) according to PDR models. Negishi et al. (2001) attribute this decrease in [C II]/FIR to either an increase in the collisional de-excitation of the [C II] 158 µm transition at high densities or a decrease in the ionized component of the [C II] 158 µm emission. For a sample of 15 ultraluminous infrared galaxies Luhman et al. (2003) report a deficiency of [C II] 158 µm, consistent with the decrease in the [C II]/FIR ratio at high 60 µm/100 µm ratios and explain this deficiency as the result of non-PDR contributions to the far-infrared continuum, possibly from dust-bounded ionized regions.
The [O I] 63 µm/FIR ratio for galaxies shows no trend with 60 µm / 100 µm and a decreasing trend with FIR/B as displayed in Figure 14 for the 181 galaxies of the unresolved subset, plotted according to morphological type. An [O I] 63 µm/FIR of 0.05%-1% characterizes these galaxies. Although [C II] 158 µm/FIR tends to decrease with increasing 60 µm / 100 µm, the same is not found for [O I] 63 µm/FIR, consistent with earlier studies by Malhotra et al. (2001) and Negishi et al. (2001). Therefore, as the heating environment in galaxies gets warmer, [C II] 158 µm becomes less dominant while [O I] 63 µm becomes more important in the cooling of the interstellar medium (see Section 6.5).
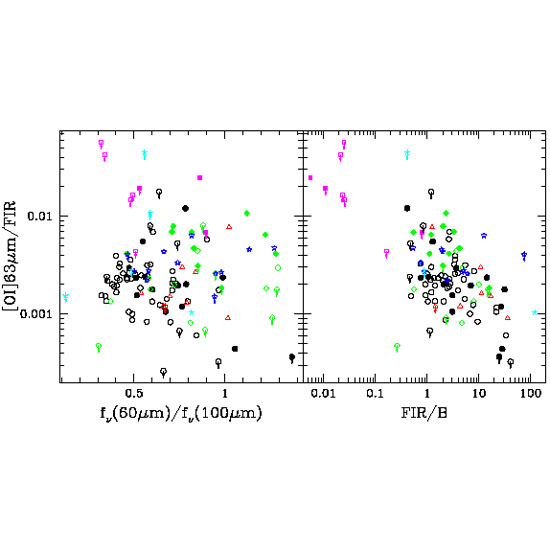 |
Figure 14. The ratio of [O I] 63 µm to far-infrared continuum is plotted against the IRAS 60 µm / 100 µm and FIR/B ratios for galaxies unresolved by the LWS. The [O I] 63 µm/FIR shows no trend with either 60 µm/100 µm or FIR/B. The symbols are the same as those in Figure 13. |
The [N II] 122 µm/FIR ratio for galaxies reveals a trend with dust temperature as measured by the 60 µm / 100 µm ratio (Malhotra et al. 2001). The [N II] 122 µm/FIR for the 181 galaxies of the unresolved subset in this sample, plotted according to morphological type, is presented in Figure 15. A [N II] 122 µm/FIR of 0.01%-0.1% characterizes these galaxies. The [N II] 122 µm/FIR follows a similar decreasing trend as [C II] 158 µm/FIR with 60 µm / 100 µm and FIR/B as suggested in Figure 15. There is a clear decrease in [N II] 122 µm/FIR as 60 µm / 100 µm and FIR/B increase for spirals and irregulars. For morphologies other than spirals and irregulars, there are few detections of [N II] 122 µm and no trend is discernible. From COBE observations of the Milky Way, a correlation between [C II] 158 µm and [N II] 205 µm was found (Bennett et al. 1994), therefore, it is not surprising that [N II] 122 µm and [C II] 158 µm in galaxies exhibit some of the same characteristics over a broad range of heating environments.
 |
Figure 15. The ratio of [N II] 122 µm to far-infrared continuum is plotted against the IRAS 60 µm/100 µm and FIR/B ratios for galaxies unresolved by the LWS. The [N II] 122 µm/FIR ratio decreases as the 60 µm/100 µm and FIR/B ratios increase, similar to the behavior of [C II] 158 µm/FIR line. The symbols are the same as those in Figure 13. |
The [O III] 88 µm/FIR ratio for the galaxies in the unresolved subset is presented in Figure 16. An [O III] 88 µm/FIR of 0.03%-2% characterizes this sample. While there is a large scatter among the data and a small number of [O III] 88 µm detections above 60 µm / 100 µm ratios of 0.9, there seems to be a weak increasing trend in [O III] 88 µm/FIR as the 60 µm/100 µm ratio increases in Figure 16a. On average, there is relatively more [O III] 88 µm emission in warmer galaxies, presumably due to a higher density of H2 regions in these galaxies. This overall increase in the [O III] 88 µm/FIR ratio is also noted in Negishi et al. (2001) for a smaller set of galaxy observations. In Figure 16b, the [O III] 88 µm/FIR appears to decrease as the FIR/B ratio increases. Malhotra et al. (2001) point out this anticorrelation between [O III] 88 µm/FIR and FIR/B, but they attribute the effect to the observations of two irregular galaxies in their sample. In this study, many new observations of the [O III] 88 µm line are included, and a decreasing trend in [O III] 88 µm/FIR with increasing FIR/B is discovered.
 |
Figure 16. The ratio of [O III] 88 µm to far-infrared continuum is plotted against the IRAS 60 µm / 100 µm and FIR/B ratios for galaxies unresolved by the LWS. The [O III] 88 µm/FIR ratio increases with increasing 60 µm / 100 µm ratio and decreases with increasing FIR/B ratio. The symbols are the same as those in Figure 13. |
6.5. [O I] 63 µm / [C II] 158 µm
In Figures 13 and 14,
[C II] 158 µm/FIR is shown to
decrease with increasing 60 µm/100 µm and
FIR/B while [O I] 63 µm/FIR remained steady with 60
µm/100 µm and FIR/B. In
Figure 17, the [O I] 63 µm / [C II]
158 µm ratio is plotted against 60 µm/100
µm and FIR/B, and a rise in [O I] 63
µm / [C II] 158 µm ratio is found as 60
µm / 100 µm increases for all morphologies but no
conclusive trend in the [O I] 63 µm / [C II] 158
µm ratio is found as FIR/B increases. From
Figure 17a, [O I] 63
µm begins to dominate cooling in the interstellar medium of
warmer galaxies (60 µm/100 µm
0.8), consistent with the
results reported by
Malhotra et al. (2001).
 |
Figure 17. The ratio of [O I] 63 µm / [C II] 158 µm is plotted against the IRAS 60 µm / 100 µm and FIR/B ratios for galaxies unresolved by the LWS. The [O I] 63 µm / [C II] 158 µm ratio increases as the 60 µm / 100 µm ratio increases, but shows no correlation with the FIR/B ratio. The symbols are the same as those in Figure 13. |
6.6. [N II] 122 µm / [C II] 158 µm
The [N II] 122 µm / [C II] 158 µm ratio remains relatively constant across a broad range of 60 µm / 100 µm and FIR/B for all morphological types as shown in Figure 18. The median value of [N II] 122 µm / [C II] 158 µm for this sample is 0.11 when both lines have been detected, consistent with what COBE observed for the Milky Way (Wright et al. 1991; Bennett et al. 1994), but lower than what models predict if [C II] 158 µm were only produced in H2 regions (Rubin 1985). The similar decreasing behaviors in the [C II] 158 µm/FIR and [N II] 122 µm/FIR ratios with increasing 60 µm/100 µm and FIR/B ratios shown in Figures 13 and 15 along with Figure 18 suggests that a significant fraction of [C II] 158 µm arises from H2 regions where N+ originates. Thus, the [N II] 122 µm / [C II] 158 µm ratio, on average, is nearly constant across a broad range of heating environments (Malhotra et al. 2001).
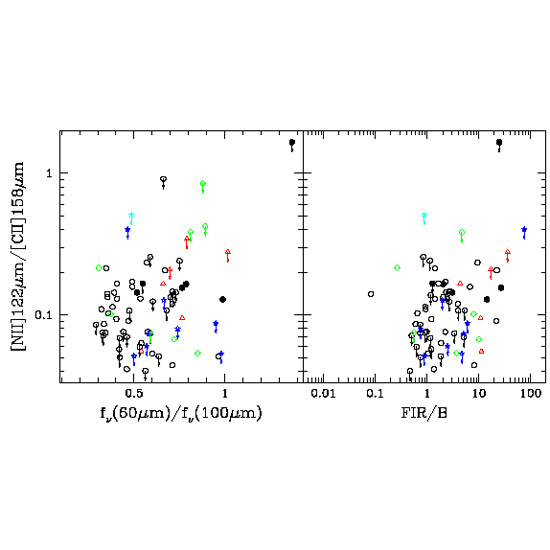 |
Figure 18. The ratio of [N II] 122 µm / [C II] 158 µm is plotted against the IRAS 60 µm/100 µm and FIR/B ratios for galaxies unresolved by the LWS. The symbols are the same as those in Figure 13. |
6.7. [O I] 145 µm / [O I] 63 µm
In general, the [O I] 63 µm line goes optically thick for lower column densities than the [O I] 145 µm line does. The [O I] 145 µm / [O I] 63 µm measures the gas temperature and the optical depth in the 63 µm line and rises as the gas temperature increases (Tielens & Hollenbach 1985; Kaufman et al 1999). There are few [O I] 145 µm line observations presented in this paper, most of low signal-to-noise. The low signal-to-noise [O I] 145 µm line has few detections in this sample. Therefore, the [O I] 145 µm / [O I] 63 µm ratio has no clear trend with the 60 µm / 100 µm or FIR/B ratios as displayed in Figure 19. Hunter et al. (2001) noted an increase in the [O I] 145 µm / [O I] 63 µm with increasing FIR/B ratios between 0.5 and 10 and attributed this increase to an indication of the optical depth effects for [O I] 63 µm.
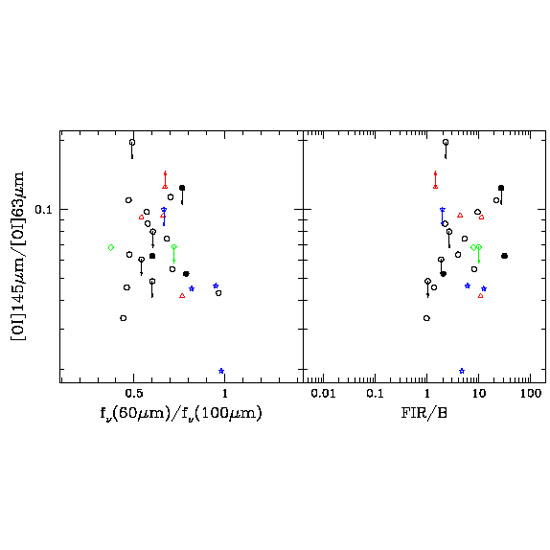 |
Figure 19. The ratio of [O I] 145 µm / [O I] 63 µm is plotted against the IRAS 60 µm / 100 µm and FIR/B ratios for galaxies unresolved by the LWS. The symbols are the same as those in Figure 13. |
6.8. ([O I] 63 µm + [C II] 158 µm) / FIR
The gas heating efficiency of PDRs in galaxies is measured by ([O I] 63 µm + [C II] 158 µm)/FIR (Hollenbach & Tielens 1997) and is plotted against the 60 µm/100 µm ratio and FIR/B for the unresolved subset of galaxies in the sample discussed in this paper in Figure 20. The ([O I] 63 µm + [C II] 158 µm)/FIR ratio shows no trend with 60 µm / 100 µm and a decreasing trend with FIR/B. For a sample of normal galaxies dominated by spirals, Malhotra et al. (2001) noted a decrease in this ratio as 60 µm/100 µm increased. Although the entire sample of galaxies does not appear to decrease in ([O I] 63 µm + [C II] 158 µm)/FIR as the 60 µm/100 µm ratio increases, the spiral galaxies show evidence for a decline in this ratio in warmer dust environments. The decrease in the ([O I] 63 µm + [C II] 158 µm)/FIR with increasing FIR/B is a result of the decrease in [C II] 158 µm emission shown in Figure 13.
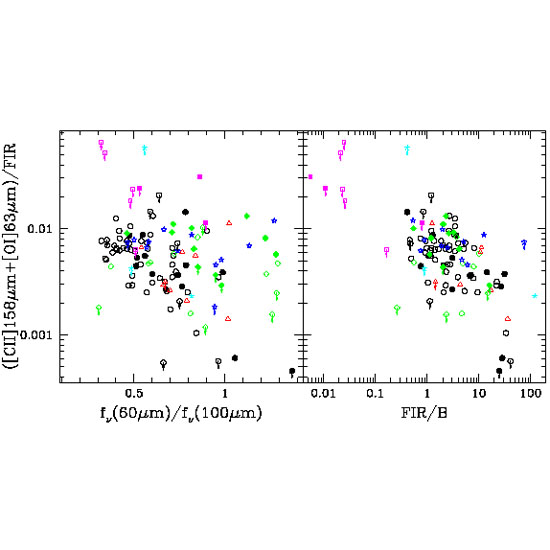 |
Figure 20. The ratio of ([O I] 63 µm + [C II] 158 µm)/FIR is plotted against the IRAS 60 µm / 100 µm and FIR/B ratios for galaxies unresolved by the LWS. The symbols are the same as those in Figure 13. |
6.9. [O III] 88 µm / [C II] 158 µm
In Figures 13a and 16a, a decrease in [C II] 158 µm/FIR and an increase in [O III] 88 µm/FIR emission are shown with increasing 60 µm / 100 µm ratio. Accordingly, the [O III] 88 µm / [C II] 158 µm ratio increases with increasing 60 µm/100 µm ratio, as presented in Figure 21a. This is an interesting correlation since O++ originates in higher density H2 regions than does N+. While the [N II] 122 µm / [C II] 158 µm ratio did not show a correlation with the 60 µm/100 µm ratio in Figure 18a, the [O III] 88 µm / [C II] 158 µm ratio does. This suggests that the contribution to the C+ emission from H2 regions originates in lower density, N+ and O+ regions rather than the highly ionized, more dense O++ regions that produce [O III] 88 µm. In comparison, [C II] 158 µm/FIR and [O III] 88 µm/FIR are shown to decrease with increasing FIR/B ratio in Figures 13b and 16b. In Figure 21b, the [O III] 88 µm / [C II] 158 µm ratio is plotted against the FIR/B ratio. There is evidence for a decreasing trend in [O III] 88 µm / [C II] 158 µm with increasing FIR/B. The irregulars, for example, show a decrease in [O III] 88 µm / [C II] 158 µm due to a larger decrease in [C II] 158 µm than [O III] 88 µm emission with increasing FIR/B ratio. The irregulars also have higher [O III] 88 µm / [C II] 158 µm ratios than most spirals as noted by Hunter et al. (2001) and shown in Figure 21. The higher [O III] 88 µm/[C II] 158 µm ratios observed in irregulars are likely due to stars with higher effective temperatures found in the H2 regions of these galaxies that produce doubly ionized oxygen but little C+.
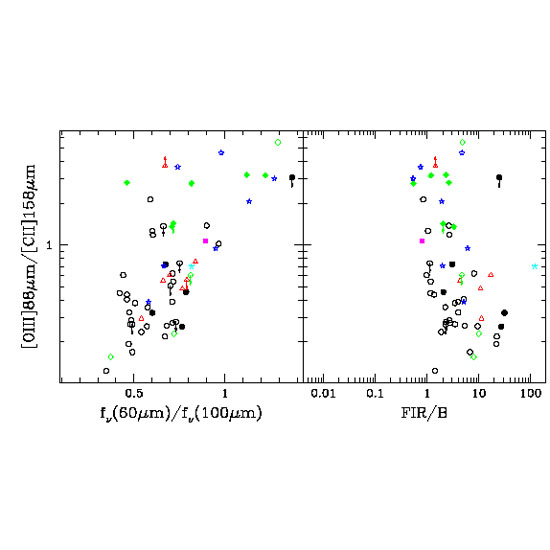 |
Figure 21. The ratio of [O III] 88 µm / [C II] 158 µm is plotted against the IRAS 60 µm / 100 µm and FIR/B ratios for galaxies unresolved by the LWS. The [O III] 88 µm/[C II] 158 µm ratio increases with increasing 60 µm / 100mm ratio, but shows no correlation with FIR/B. The symbols are the same as those in Figure 13. |
6.10. [O III] 88 µm / [O I] 63 µm
In Figure 14, the [O I] 63 µm emission remains relatively constant when normalized to far-infrared across a broad range of interstellar medium environments measured by the 60 µm / 100 µm ratio. The relative drop seen in [C II] 158 µm emission is not observed for [O I] 63 µm. By comparison, [O III] 88 µm/FIR shows a weak, increasing trend with increasing 60 µm/100 µm ratio in Figure 16a. The [O III] 88 µm / [O I] 63 µm ratio is plotted against the 60 µm / 100 µm ratio in Figure 22a. The [O III] 88 µm / [O I] 63 µm ratio has no obvious trend that spans all 60 µm / 100 µm ratios, unlike [O III] 88 µm / [C II] 158 µm. In Figures 14b and 16b, the [O I] 63 µm/FIR ratio shows little trend with FIR/B while the [O III] 88 µm/FIR ratio falls as the FIR/B ratio increased. A slight decline in the [O III] 88 µm / [O I] 63 µm ratio is observed as the FIR/B ratio increases and is shown in Figure 22b. Similar to the [O III] 88 µm / [C II] 158 µm ratio, the [O III] 88 µm / [O I] 63 µm ratio for irregulars decreases noticeably with increasing FIR/B. Irregular galaxies also show an elevated [O III] 88 µm / [O I] 63 µm ratio when compared to spirals as mentioned by Hunter et al. (2001).
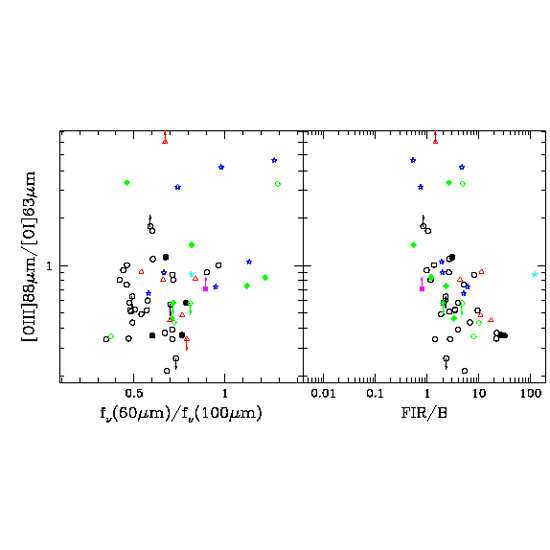 |
Figure 22. The ratio of [O III] 88 µm / [O I] 63 µm is plotted against the IRAS 60 µm/100 µm and FIR/B ratios for galaxies unresolved by the LWS. The symbols are the same as those in Figure 13. |
6.11. [O III] 88 µm / [N II] 122 µm
[O III] 88 µm originates in higher density H2 regions (excitation potential=35 eV), and [N II] 122 µm originates in lower density H2 regions (excitation potential = 14.5 eV). The [O III] 88 µm / [N II] 122 µm ratio is plotted against the 60 µm / 100 µm and FIR/B ratios in Figure 23 for galaxies unresolved by the LWS. Perhaps there are correlations for [O III] 88 µm / [N II] 122 µm with the 60 µm / 100 µm and FIR/B ratios, though too few data are available to have confidence in these trends.
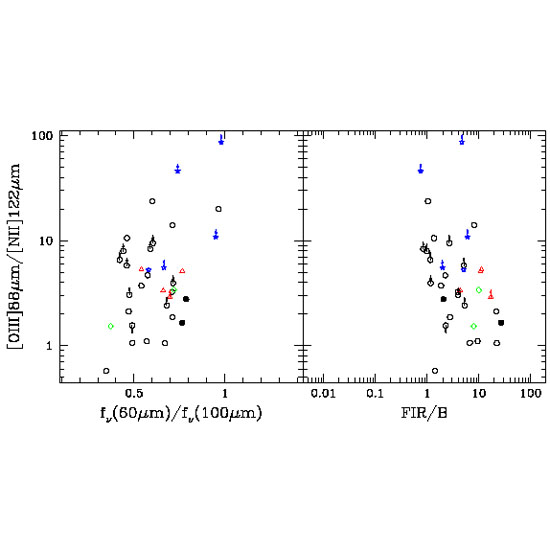 |
Figure 23. The ratio of [O III] 88 µm / [N II] 122 µm is plotted against the IRAS 60 µm / 100 µm and FIR/B ratios for galaxies unresolved by the LWS. The symbols are the same as those in Figure 13. |
