


While we still do not have a velocity-delay map in hand, we certainly know how to get one. More than a dozen years of experience in reverberation mapping have led to a reasonably good understanding of the timescales for response of various lines as a function of luminosity and of how the continuum itself varies with time. On the basis of this information, we have carried out extensive simulations to determine the observational requirements to obtain high-fidelity velocity-delay maps for emission lines in moderate luminosity Seyfert galaxies (quantities that follow are based specifically on NGC 5548, by far the AGN best studied by reverberation). A sample numerical simulation is shown in Figure 6. As described more completely by Horne et al. (2004), the principal requirements are:
 in
NGC 5548 is typically around 20 days, so the
longest timescale to be probed is 2r / c. The duration
should thus be at least ~ 120 days to map the
H-emitting
region. However, since C IV seems to respond twice as fast as
H, the C
IV-emitting region might be mapped in
as little as ~ 60 days. A more important consideration,
however, is detection in the time
series a strong continuum signal, such as a change in
sign of the derivative of the light curve. This produces a similarly
strong emission-line response. We find that ~ 200 days
of observations are required to be certain that such an event
occurs, and to observe its consequences in the emission lines.
in
NGC 5548 is typically around 20 days, so the
longest timescale to be probed is 2r / c. The duration
should thus be at least ~ 120 days to map the
H-emitting
region. However, since C IV seems to respond twice as fast as
H, the C
IV-emitting region might be mapped in
as little as ~ 60 days. A more important consideration,
however, is detection in the time
series a strong continuum signal, such as a change in
sign of the derivative of the light curve. This produces a similarly
strong emission-line response. We find that ~ 200 days
of observations are required to be certain that such an event
occurs, and to observe its consequences in the emission lines.
 600 km s-1). While
higher spectral resolution is always desirable, AGN emission lines
show little additional structure at resolution better than several hundred
kilometers per second. Higher resolution does, however, make it in
principle possible to detect a gravitational redshift (e.g.,
Kollatschy 2004),
providing an independent and complementary measure of the black hole mass.
600 km s-1). While
higher spectral resolution is always desirable, AGN emission lines
show little additional structure at resolution better than several hundred
kilometers per second. Higher resolution does, however, make it in
principle possible to detect a gravitational redshift (e.g.,
Kollatschy 2004),
providing an independent and complementary measure of the black hole mass.
 100). Both
continuum and emission-line flux variations are small on short time
scales, typically no more than a few percent on diurnal
timescales. Excellent relative flux calibration and
signal-to-noise ratios are necessary to make use of the high time
resolution.
100). Both
continuum and emission-line flux variations are small on short time
scales, typically no more than a few percent on diurnal
timescales. Excellent relative flux calibration and
signal-to-noise ratios are necessary to make use of the high time
resolution.
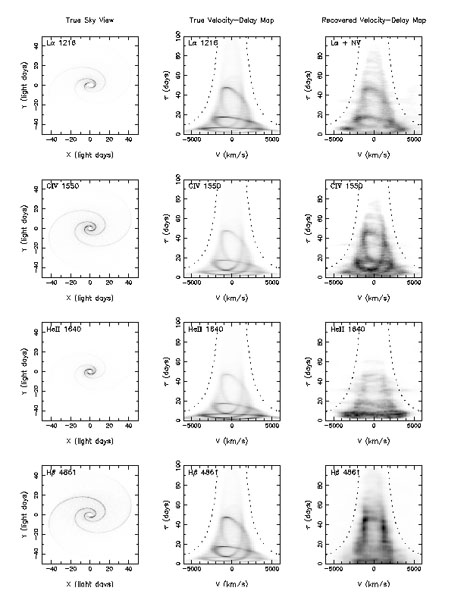 |
Figure 6. Numerical simulations of velocity
- delay map recovery. An arbitrary but complex geometry was chosen
to show that a complicated BLR structure can be recovered.
The left column shows the BLR geometry in four
lines, Ly |
The final point makes it clear that this will be difficult to do with
ground-based observations: it is hard to maintain such high levels of
homogeneity and thus accurate relative flux calibration with a
variable point-spread function, such as one dominated by the effects
of atmospheric seeing. Space-based observations are much more likely
to succeed, and moreover, the ultraviolet part of the spectrum gives
access to the important strong lines
Ly ,
N V
,
N V  1240, Si IV
1400,
C IV 1549, and
He II 1640, all of
which vary strongly.
1240, Si IV
1400,
C IV 1549, and
He II 1640, all of
which vary strongly.
We have carried out a series of simulations assuming specifically observation of NGC 5548 with the Space Telescope Imaging Spectrograph (STIS) on HST. We assume that the typical BLR response times are as observed during the first major monitoring campaign in 1989, as these values appear to be typical. We also assume for practical reasons that we can obtain only one observation per day (mostly on account of restrictions against the use of the STIS UV detectors during orbits when HST passes through the South Atlantic Anomaly) which we must complete in one HST orbit, using the typical time that NGC 5548 is observable per orbit. Furthermore, we included in the simulations nominal spacecraft and instrument safing events of typical duration (generally a few days) and frequency. We also considered the effects of early termination of the experiment due, for example, to a more catastrophic failure. We carried out 10 individual simulations, with each one using a different continuum model; all of the continuum models were "conservative" in the sense that the continuum activity is weaker and less pronounced than it is usually observed to be.
Given our assumptions, we find that all 10 of the simulated experiments succeed within 200 days. For the most favorable continuum behavior, success can be achieved in as little as ~ 60 days, though this is rare, or more commonly in around ~ 150 days. We also find that these results are robust against occasional random data losses.
These generally conservative assumptions argue strongly that velocity-delay maps for all the strong UV lines in NGC 5548 could be obtained in a 200-orbit HST program based on one orbit per day. There are clearly elements of risk associated with the program, the most obvious being early termination on account of a systems failure or a major safing event that would end the time series prematurely. This risk is somewhat mitigated by the conservatism of our simulations; it is possible that the experiment could succeed in much less time. Indeed, if we define "success" as obtaining a velocity-delay map that is stable for 50 days, we find that the probability of success is as high as ~ 90% in 150 days.
Finally, one might also ask about the scientific risk: for example, what if the velocity-delay map, though of high fidelity, cannot be interpreted? In other words, what if the velocity-delay map is a "mess" and has no discernible structure? First of all, this is not a likely outcome since long-term monitoring shows persistent features in emission-line profiles that imply there is some order or symmetry to the BLR. Moreover, even if the BLR turns out to be a "mess" we'll still have learned an important fact about the BLR structure, namely that it is basically chaotic. But the bottom line is that right now we have nearly complete ignorance about the BLR structure. We cannot even assess to any level of confidence how many velocity-delay maps of AGNs we will need to solve the problem until we have obtained at least one velocity-delay map of at least one emission line. Until we have that, our knowledge of the role of the BLR in AGN fueling and outflows will remain based on theoretical speculation alone, historically a very dangerous situation for astrophysicists.
