


Prior to about 1988, there were a large number of observations that suggested that the broad emission lines in Seyferts varied in response to continuum variations and did so on surprisingly short time scales. These early results led to the first highly successful reverberation campaign, carried out in 1988 - 89, combining UV spectra obtained with the International Ultraviolet Explorer (IUE) with ground-based optical observations from numerous observatories. The program ran for over 8 months and achieved time resolution of a few days in several continuum and emission-line time series (Clavel et al. 1991; Peterson et al. 1991; Dietrich et al. 1993; Maoz et al. 1993). A number of important results were produced by this project, including:
 1640
and ~ 10 days for Ly
1640
and ~ 10 days for Ly and
C IV 1549) and the lower
ionization lines respond less rapidly (e.g., ~ 20 days for
H
and
C IV 1549) and the lower
ionization lines respond less rapidly (e.g., ~ 20 days for
H and nearly
30 days for C III] 1909).
The BLR thus shows radial ionization stratification.
and nearly
30 days for C III] 1909).
The BLR thus shows radial ionization stratification.
Optical spectroscopic monitoring of NGC 5548 continued for a total of
13 years, and during the fifth year of the program (1993), concurrent
high-time resolution (daily observations) were made for about 60 days
with IUE and for 39 days with the Faint Object Spectrograph on
Hubble Space Telescope
(Korista et al. 1995).
Over time, it became clear that the
H
emission-line lag is a dynamic quantity, it varies with time and
is dependent on the current mean continuum luminosity
(Peterson et al. 2002).
In other words, there is much more nuclear gas on scales of
thousands of gravitational radii than previously thought: at any given
time, most of the emission in any particular line arises primarily in
that gas for which the physical conditions optimally produce that
particular emission line (cf. the "locally optimized cloud" model of
Baldwin et al. 1995).
Peterson et al. (2004)
recently completed a comprehensive
reanalysis of 117 independent reverberation mapping data sets
on 37 AGNs, measuring emission-line lags, line widths,
and black hole masses for all but two of these sources.
Calibration of the reverberation-based
mass scale, as embodied in the scaling factor f in eq. (1), is set
by assuming that AGNs follow the same relationship between black hole
mass and the host-galaxy bulge velocity dispersion (the
MBH -
 *
relationship) seen in quiescent galaxies
(Onken et al. 2004).
The range of measured masses runs from ~ 2 × 10⁶
M
*
relationship) seen in quiescent galaxies
(Onken et al. 2004).
The range of measured masses runs from ~ 2 × 10⁶
M for the
narrow-line Seyfert 1 galaxy NGC 4051 to ~ 1.3 × 10⁹
M
for the quasar PG 1426+015.
The statistical errors in the mass measurements (due
to uncertainties in lag and line-width measurement) are typically only
about 30%. However, the systematic errors, due to scatter in the
MBH -
*
relationship, amount to about a factor of three; this
systematic uncertainty can decreased only by understanding the geometry and
kinematics of the BLR. Figure 5 shows a current
version of the mass-luminosity relationship for AGNs, based on these
reverberation-based black hole masses.
for the
narrow-line Seyfert 1 galaxy NGC 4051 to ~ 1.3 × 10⁹
M
for the quasar PG 1426+015.
The statistical errors in the mass measurements (due
to uncertainties in lag and line-width measurement) are typically only
about 30%. However, the systematic errors, due to scatter in the
MBH -
*
relationship, amount to about a factor of three; this
systematic uncertainty can decreased only by understanding the geometry and
kinematics of the BLR. Figure 5 shows a current
version of the mass-luminosity relationship for AGNs, based on these
reverberation-based black hole masses.
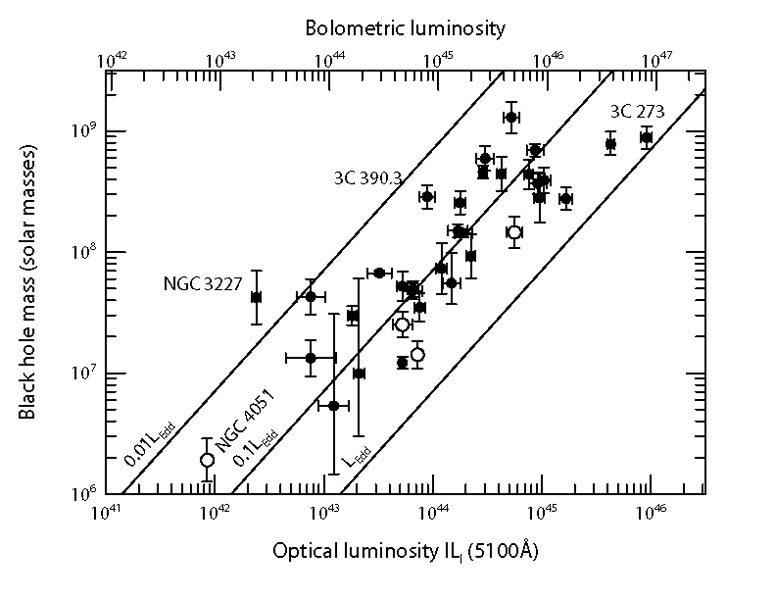 |
Figure 5. Black hole mass vs. luminosity
for 35 reverberation-mapped AGNs. The luminosity scale on the lower
x-axis is log |

 9
9