


A substantial part of the SFDGs have high gas mass fractions. H I masses
range from a few 106
M at
MB ~ -10 (represented in the FIGGS sample) up to a few times
109
M at
MB ~ -20. The relative H I mass fraction varies from about 5%
of the dynamical mass at the high mass end to almost 100% at the low
mass end
(Begum
et al. 2008,
Schombert et al. 2001).
The H I disk thickness increases with decreasing luminosity, reaching a
mean axis ratio of <q> ~ 0.6 in the faintest dI galaxies
(Roychowdhury et al. 2010).
at
MB ~ -10 (represented in the FIGGS sample) up to a few times
109
M at
MB ~ -20. The relative H I mass fraction varies from about 5%
of the dynamical mass at the high mass end to almost 100% at the low
mass end
(Begum
et al. 2008,
Schombert et al. 2001).
The H I disk thickness increases with decreasing luminosity, reaching a
mean axis ratio of <q> ~ 0.6 in the faintest dI galaxies
(Roychowdhury et al. 2010).
In Fig 1 we show the relation between MHI and MB based on 199 galaxies loosely classified as Irregular, 315 LSB galaxies and 224 galaxies classified as BCGs or H II galaxies. The sample has been collected from various publications (van Zee et al. 1997, Lisenfeld and Ferrara 1998, Izotov and Thuan 1999, Burkholder et al. 2001, Hirashita et al. 2002, Salzer et al. 2002, Pustilnik et al. 2002, Geha et al. 2006, Begum et al. 2008, Bergvall et al., unpublished). The classification is therefore not homogeneous and the sample is not in any sense complete. But it displays interesting relations. There is a fairly tight linear relation between H I mass and luminosity for the different types. The MHI / LB varies with more than one magnitude over the luminosity range. The spread in luminosity is not significantly different for the different samples. We also see that the distribution of dIs nicely attaches to the faint end of the BCG distribution. It seems that BCGs are merely scaled up versions of dIs. It raises the question about the bursty character of the BCGs. How many galaxies classified as BCGs really differ significantly from 'normal' SFDGs in terms of SFRs and gas consumption rates? One could have expected that the BCGs, if they are bursting, would have an increased dispersion in luminosity since we would catch the galaxy in different stages of a transient event. But this is not the case. Is it telling s that the BCGs are not bursting but form stars at a sightly higher rate than LSBGs over a long period of time?
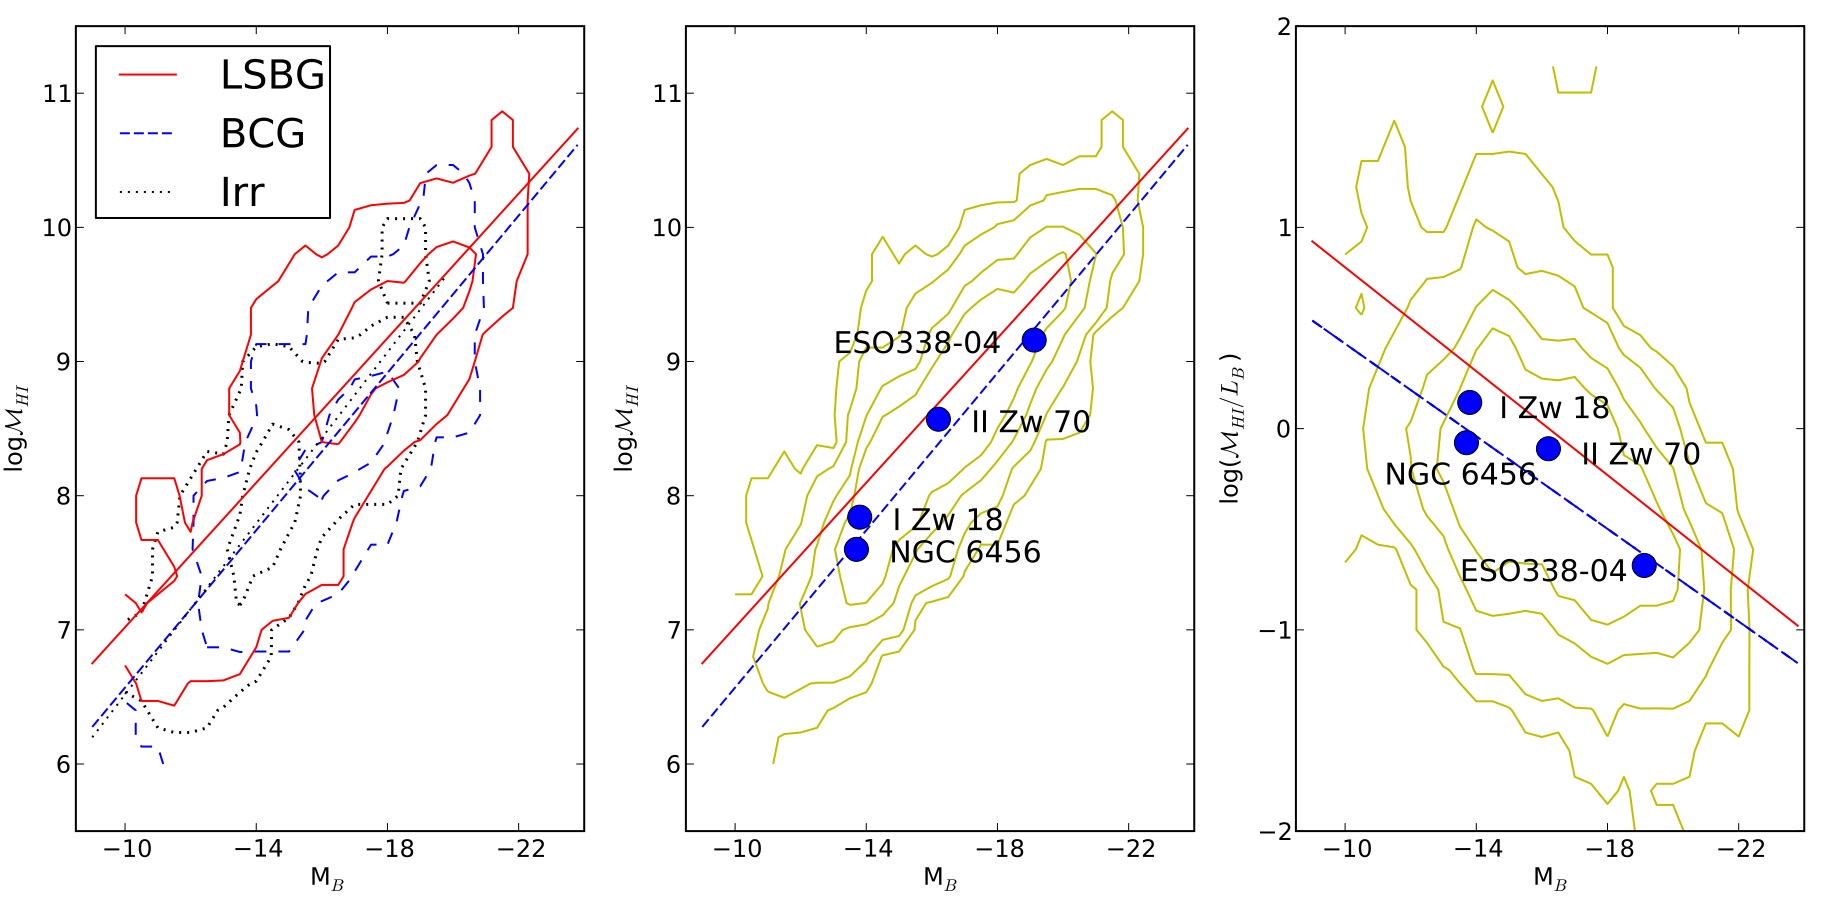 |
Figure 1. Left: Isodensity contours of total H I mass versus absolute B magnitudes for galaxies classified as LSBGs, BCGs and Irrs. The type definition is not strict but varies between different authors (see reference list in running text). Least-square fits to the data sets are shown in solid (LSBGs), dashed (BCGs) and dotted (Irrs). Centre: Isodensity contours for the full sample. Also shown are the previous fits to BCGs (blue) and LSBGs (red) and the positions of four well known BCGs. Right: log(MHI / LB) vs MB. Correlations as before. |
There is an ongoing discussion about the relationships between the morphological types of SFDGs and one important question is how LSBGs and BCGs are related (e.g. Simpson and Gottesman 2000). Both have low metallicities and high gas mass fractions and reside in similar environments (Rosenbaum et al. 2009, Pustil'nik et al. 1995). If BCGs are bursting, clearly their progenitors must be either irregulars or LSBGs. As the galaxy enters the burst, the luminosity would increase, while the H I mass slowly would decrease. The galaxy would move to the right in Fig 1. As we see, the relation for the BCGs is shifted relative to the LSBGs with about one magnitude. Thus, it seems obvious that if LSBGs are the progenitors and the B luminosity roughly can be used as a measure of the SFR, they would increase the SFR with a factor of ~ 2 in the transition. This agrees with results from previous investigations (e.g., Papaderos et al. 1996). However, with such a small change, Occam's razor urges us to primarily consider the case where BCGs always had a higher SFR than the LSBGs. Thus, there is no strong support of starbursts in BCGs from these data. More surprise is found from the positions of three well known BCGs in the diagram, NGC 6456 (see below), I Zw 18, II Zw 70 (Kehrig et al. 2008) and ESO 338-04 (= Tol 1924-416, see below). The galaxies all cluster along the mean line. This is unexpected since they are regarded as strong starbursts and therefore should be separated from the distribution of 'normal' BCGs. We would expect strong starburst BCGs to deviate from their candidate progenitors with 2-3 magnitudes. But the shift is only ~ 1 mag. Extinction effects play a minor role since E(B - V) < 0.05 in all 4 galaxies (Lequeux et al. 1981, Oconnell et al. 1978, Bergvall 1985, McQuinn et al. 2010).
Another clue to the relation between LSBGs and BCGs can be obtained from a study of the spatial distribution of H I. The scalelength versus MHI from small sizes up to a few 10 kpc follows that of a constant surface density. But the scalelength also correlates with surface brightness. In a comparison between BCGs, LSBGs and dI galaxies, van Zee et al. (2001) find that the scalelength of BCGs is systematically smaller than for LSBGs and dIs and roughly corresponds to the optical radius. The central surface density is about a factor of 5 higher. Thus, if LSBGs are progenitors of BCGs, they first must reduce the angular momentum of the gas during the transition phase, in order to increase the H I surface density and thereby the SFR. In a similar discussion, Staveley-Smith et al. (1992) concluded that LSBGs and BCGs as classes probably were unrelated.
An important issue concerns the H2 content. Stars form out of
molecular clouds and it is known that the relative H2 mass
can be substantial in SFGDs. H2 lacks a dipole moment, making
direct observations of H2 extremely difficult. Instead
indirect observations of the associated CO molecule is used. The
H2 mass is then calculated using the CO-to-H2
conversion factor,
 CO. The value
of CO is
however very poorly constrained at low metallicities since the CO line
becomes weaker and also because the radiation field, especially from
starburst regions, tend to dissociate the molecule. The conditions under
which this happens cannot be modelled to high accuracy and consequently
much of our knowledge about the conversion factor is empirical. The
problem becomes evident from observations of galaxies in the local
group.
Leroy
et al. (2011)
find that while M31, M33, LMC and the Milky Way have quite similar
values, CO
can increase with a factor of 5-10 in SMC and NGC 6822. This has serious
implications for models of chemical evolution (see below) and timescales
of gas consumption, a central issue as we discuss starburst dwarfs. The
transition from normal to high values of
CO seems to
take place at a metallicity of 12 + log(O/H) ~ 8.2-8.4. Alternative
means of estimating the H2 mass have been exploited. Much
H2 is residing in photodissociation regions (PDRs). In fact
PDRs may be the dominating phase in starburst nuclei
(Stacey
et al. 1991).
PDRs contain ions of low ionisation potential, like C+,
giving rise to the strong emission line
[C II]
CO. The value
of CO is
however very poorly constrained at low metallicities since the CO line
becomes weaker and also because the radiation field, especially from
starburst regions, tend to dissociate the molecule. The conditions under
which this happens cannot be modelled to high accuracy and consequently
much of our knowledge about the conversion factor is empirical. The
problem becomes evident from observations of galaxies in the local
group.
Leroy
et al. (2011)
find that while M31, M33, LMC and the Milky Way have quite similar
values, CO
can increase with a factor of 5-10 in SMC and NGC 6822. This has serious
implications for models of chemical evolution (see below) and timescales
of gas consumption, a central issue as we discuss starburst dwarfs. The
transition from normal to high values of
CO seems to
take place at a metallicity of 12 + log(O/H) ~ 8.2-8.4. Alternative
means of estimating the H2 mass have been exploited. Much
H2 is residing in photodissociation regions (PDRs). In fact
PDRs may be the dominating phase in starburst nuclei
(Stacey
et al. 1991).
PDRs contain ions of low ionisation potential, like C+,
giving rise to the strong emission line
[C II]  158µ. The emission is strongly correlated with H2
(Crawford
et al. 1985)
and can be used to estimate the H2 mass. As an example we can
have a look at IC 10 where
Madden
et al. (1997)
speculate that, as a consequence of the strong UV field and low
metallicity, small CO cores are formed, surrounded by extensive [C II]
emitting regions containing H2. H2 masses based on
the CO flux would therefore be severely underestimated. A similar
situation may be at hand in the luminous (MB ~ -21) BCG
Haro 11
(Bergvall
et al. 2000).
No doubt the Herschel observatory will provide us with data to further
unveil the interplay between star formation and the ISM.
158µ. The emission is strongly correlated with H2
(Crawford
et al. 1985)
and can be used to estimate the H2 mass. As an example we can
have a look at IC 10 where
Madden
et al. (1997)
speculate that, as a consequence of the strong UV field and low
metallicity, small CO cores are formed, surrounded by extensive [C II]
emitting regions containing H2. H2 masses based on
the CO flux would therefore be severely underestimated. A similar
situation may be at hand in the luminous (MB ~ -21) BCG
Haro 11
(Bergvall
et al. 2000).
No doubt the Herschel observatory will provide us with data to further
unveil the interplay between star formation and the ISM.
Although with some scatter, there is a clear one-to-one relation between SFR and molecular mass (Leroy et al. 2005, Krumholz et al. 2011). In more massive systems one may explain this relation as a coupling between the coolant CO (associated with H2) and conditions for collapse of giant molecular clouds (GMC). In low mass systems though, a more likely explanation seems to be that the transition from predominantly atomic hydrogen to molecular occurs under the same conditions as a dramatic drop in gas temperature that destabilizes clouds and initiates collapse (Krumholz et al. 2011). While the mean ratio between H2 and H I masses increases with metallicity, the scatter is large at low metallicities and there are cases when the H2 mass is more than 10 times higher than the H I mass, like NGC 4630 (Leroy et al. 2005). Another case is perhaps Haro 11, discussed above. Perhaps there is a yet unknown mechanism that stimulates an overproduction of gas in molecular state, leading to a starburst event.