


The name Blue Compact Galaxy was coined by Fritz Zwicky (Zwicky 1965) due to their blue colours and compact appearance on photographic plates. About 10 years later we got access to observational capacities good enough to make it possible to study these galaxies in detail. It was found that indeed the galaxies had high gas masses and low metallicities, as expected if they were young. In 1972-73 Searle, Sargent and Bagnuolo applied a model of the spectral evolution of galaxies on observations of late type galaxies (Searle and Sargent 1972, Searle et al. 1973). Among these were a few of the bluest. Searle et al. addressed the question of youth and concluded that probably the galaxies were not young but experienced short bursts of star formation. Prior to this Larson and Tinsley (1978) came to the conclusion that starbursts were generated by interaction and mergers. According to their study, starburst should be a common phenomenon and a characteristic consequence of close encounters and mergers. This generated a new mode of interpretation of star forming galaxies and in 1980 (Rieke et al. 1980) the word starburst was accepted. A few years later starburst galaxies had become one of the hottest topics in extragalactic astronomy. During the 2000s, about 800 papers per year contain the word starburst in the abstract.
At the same time as this outstanding burst of interest in starbursts
occurred, there was also a growing confusion concerning starbursts. What
was it? How should a starburst be defined? This is a persistent problem
(Knapen
and James 2009).
Classically, it was considered that the star formation rate in a
starburst should be significantly enhanced compared to the normal SFR
for that specific morphological type. Alternatively, the gas consumption
time scale should be significantly smaller than a Hubble time. Gradually
there was a need to subdivide the starburst population into global
starbursts and nuclear starbursts. The latter occur almost exclusively
in normal (non-dwarf) galaxies in a local ~ kpc sized region in the
centre. Many workers use
EW(H ) as a measure of a
starburst. One rather widely used criterion for a starburst is
EW(H)
) as a measure of a
starburst. One rather widely used criterion for a starburst is
EW(H)
 100 Å. According to
models
(Zackrisson et al. 2001)
however, a galaxy with constant SFR will have
EW(H)
100 Å. According to
models
(Zackrisson et al. 2001)
however, a galaxy with constant SFR will have
EW(H)
 100Å after a
Hubble time. Thus the
EW(H) criterion is not
optional. A better starburst indicator is probably the birthrate
parameter, b
(Scalo
1986,
Kennicutt Jr. 1998).
It is defined as the ratio between the present SFR and the mean past
SFR: b = SFR / <SFR>. A galaxy with b
> 3 can be regarded as a mild starburst galaxy while one with
b > 10 is of the 'classical' starburst type. In the study of
star forming galaxies in the SDSS,
Brinchmann et al. (2004)
concluded that about 20% of star formation takes place in galaxies with
b = 2-3. It is a matter of taste if one wants to call this a starburst but
the starburst concept gets very watered-down if all galaxies with b >
2 are to be regarded as starbursts. If we use the strong starburst
criterion, b > 10, only 3% of the star formation takes place
in bursts.
100Å after a
Hubble time. Thus the
EW(H) criterion is not
optional. A better starburst indicator is probably the birthrate
parameter, b
(Scalo
1986,
Kennicutt Jr. 1998).
It is defined as the ratio between the present SFR and the mean past
SFR: b = SFR / <SFR>. A galaxy with b
> 3 can be regarded as a mild starburst galaxy while one with
b > 10 is of the 'classical' starburst type. In the study of
star forming galaxies in the SDSS,
Brinchmann et al. (2004)
concluded that about 20% of star formation takes place in galaxies with
b = 2-3. It is a matter of taste if one wants to call this a starburst but
the starburst concept gets very watered-down if all galaxies with b >
2 are to be regarded as starbursts. If we use the strong starburst
criterion, b > 10, only 3% of the star formation takes place
in bursts.
We (Bergvall et al. 2011, in proc. of 'Star forming dwarf galaxies',
Crete 2008) carried out a similar study as Brinchmann et al. but with
different models and a supplementary set of data of post-starburst
galaxies. We modelled the stellar population simply as a mixture of an
old stellar population and a young burst. In
Fig 3, we show the luminosity function for
different subsamples of SFDGs in SDSS, DR7. As concerns the relative
number of galaxies with
EW(H) > 100Å,
our results agree with the results from the 11HUGS survey, i.e. that
these constitute a few percent of galaxies in the luminosity range -17
 MB < -15. If
we apply b > 3 as a condition for starbursts, we find that it
is fulfilled by < 1% of the sample. We also find that the b
> 3 criterion is almost fulfilled for galaxies with
EW(H) > 100Å at
the low luminosity end of the distribution. As we go towards higher
luminosities the
EW(H) criterion is
loosing relevance as a starburst criterion.
MB < -15. If
we apply b > 3 as a condition for starbursts, we find that it
is fulfilled by < 1% of the sample. We also find that the b
> 3 criterion is almost fulfilled for galaxies with
EW(H) > 100Å at
the low luminosity end of the distribution. As we go towards higher
luminosities the
EW(H) criterion is
loosing relevance as a starburst criterion.
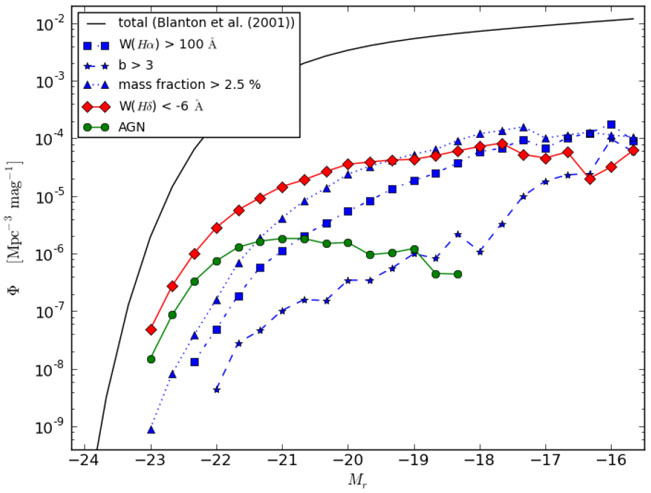 |
Figure 3. The galaxy luminosity function as
based on the SDSS (solid line, from
Blanton et al. 2001).
Also shown are the luminosity functions of galaxies with
EW(H |
It is interesting to compare these results with studies of nearby
galaxies. In the low mass end, the starburst concept more or less looses
its meaning. Stochastic effects dominate the star formation history and
single star forming events can change the galaxy luminosity
significantly. Since the typical dwarf galaxy formed 40% of its stellar
mass at z < 2, a birthrate parameter of b = 3 means that the
SFR increases with a factor of 6 with regard to the mean SFR from z = 2
(3.3 Gyr). Therefore it may be well motivated to redefine the
criterion. Thus, in their study of nearby SFGDs,
McQuinn
et al. (2009),
McQuinn
et al. (2010)
accordingly consider only the latest 6 Gyr when they discuss starburst
properties, b = b /
<b>(0-6Gyr). They also prefer to lower the
condition further and consider the galaxy to be in a starburst condition
if this modified b is > 2. Among their targets, NGC 6456 has
the record, b = 7.6. We added this galaxy to the
Fig. 1. Surprisingly, the galaxy
deviates very little from the mean relation for BCGs. Quinn et
al. derive the star formation history from CMDs. The find that the
duration of the starburst in these 18 galaxies is surprisingly long,
typically 450-650 Myr. This is three times the duration adopted by
Lee et
al. (2009)
and indicates that self-quenching of the starburst is a rare
phenomenon. McQuinn et al. continues to discuss other similar studies of
the duration of starbursts and cite several independent investigations
that arrive at much shorter durations, often < 10 Myr. In
Fig 4 we have a look at the durations we derived
for the SDSS sample. If we apply the
EW(H) > 100Å
criterion, the duration of this period agrees with what McQuinn et
al. found. If we apply the birthrate criterion, the duration we obtain
is inbetween the McQuinn value and the Lee et al. value. What is also
interesting to see in the diagram is that starbursts consume a minute
fraction of the available gas. Mass consumption rates higher than a few
% are only found among the very longlived "bursts".
 |
Figure 4. Results from modelling of SDSS spectra of SFDGs. The model is a simple mixture of an old and young stellar population. The histograms show the resulting ages of the young component under different conditions. The marks indicate starburst durations derived from other groups using other data. Among these are the results from McQuinn et al. (2010) (right pointer), Lee et al. (2009) (dot) and various results arriving at short durations discussed in McQuinn et al. (2009) (left pointer). |
From an historical point of view is becomes clear that the starburst concept now has become rather watered-down. The problem becomes apparent when we go to the most extreme starburst dwarfs where we may have b(0-14 Gyr) > 15-20, i.e. with a specific SFR about 20 times higher than starbursts classified with the weak criterion. SFDGs with b(0-14 Gyr) > 3 are rare, constituting < 1% of all dwarf galaxies. Although these galaxies are involved in a starburst at the moment, it does not necessarily mean that the starburst will influence the evolution of the galaxy significantly. Neither the mass consumption during the burst or the effects of the stellar winds may be important. Let us look at two examples, ESO 338-04 and Haro 11. ESO 338-04 is interacting with a neighboring galaxy (Cannon et al. 2004). It has a b parameter of 11 (Östlin et al. 2001) and produces myriads of clusters/super star clusters (Östlin et al. 1998). The formation of massive star clusters is a common phenomenon in starburst galaxies and is explained as an effect of high pressure (Elmegreen and Efremov 1997). What is surprising is that in Fig 1, the galaxy looks completely normal. Since the b parameter is a comparison between the past star formation and the present, the past star formation may have been very modest. Then we can obtain a high b parameter even if the SFE is normal in relation to the available gas mass.
The other example is Haro 11, mentioned above in connection to the H2 discussions. It has no neighbors but morphologically and kinematically the galaxy appears to be involved in a merger (Östlin et al. 1999, Östlin et al. 2001, Overzier et al. 2008). It has a gas consumption timescale of ~ 100 Myr a birthrate parameter b ~ 15 and is involved in a vigorous global starburst, producing a large number of super star clusters (Adamo et al.2010). The cluster formation efficiency is about 10 times higher than in large spiral galaxies. The FIR SED of Haro 11 is abnormal (Engelbracht et al. 2008). This is probably due to a very young stellar population and suggests that stellar winds should be important. A strong superwind (Bergvall et al. 2006, Grimes et al. 2007) is observed from the central region and Chandra observations (Grimes et al. 2007) confirm that this wind is penetrating the gaseous halo and may open channels to the halo. In this context it is interesting to compare Haro 11 to high redshift galaxies, in particular Lyman break galaxies (Grimes et al. 2007). There have been claims for and against a Lyman continuum leakage in the galaxy (Grimes et al. 2007, Leitet et al., submitted) and therefore Haro 11 may also be a proxy for Lyman continuum galaxies in the era of cosmic reionization. Today there is a strong support for the scenario that SFDGs were the main drivers of the cosmic reionization (e.g., Bouwens et al. 2007, Gnedin 2008, Razoumov and Sommer-Larsen 2010, Bouwens et al. 2011) and there are indications (Ouchi et al. 2009) that the dwarf galaxies at high redshifts are both metal poor, have a flatter IMF and a higher escape rate than local galaxies. But from studies of local metal poor dwarfs that are leaking, we can better understand the physical conditions necessary for leakage.