


An array of observations are now available that provide information, either direct or indirect, on galaxy formation and structure formation in the early Universe. Indirect observations include the large angular-scale polarization in the cosmic microwave background (CMB), recently measured by WMAP, as well as the amplitude and fluctuations of the cosmic near-infrared background (CIB). We will discuss these later, and focus here on the search for discrete sources at the highest redshifts.
Available large telescopes, in space and on the ground,
are capable of taking images of distant
galaxies and/or obtaining spectroscopic data, reaching all the way to the
currently highest-redshift galaxy at z = 8.6
(Lehnert et al. 2010).
There are two main techniques to locate z > 6 galaxies, both based
on the spectral imprint of hydrogen. In the first case, broad-band
photometry aims at identifying absorption breaks due to neutral
hydrogen in the vicinity of the source, and in the second case, narrow-band
techniques target the strong emission in the
Lyman- line
(Stiavelli 2009).
line
(Stiavelli 2009).
3.1. High-redshift Dropout galaxies
Utilizing the exquisite near-IR sensitivity of the newly installed Wide Field Camera 3 (WFC3) on board the HST, deep images of the Hubble Ultra Deep Field (HUDF) and other fields opened up an unprecedented window into the distant Universe (see Figure 2). High-redshift galaxies were identified by the so-called dropout technique, using multi-band imaging (for a recent review, see Robertson et al. 2010).
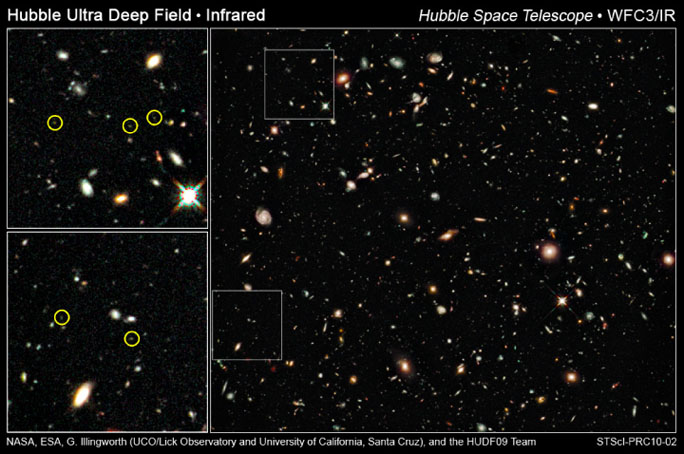 |
Figure 2. Early galaxies in HST's deepest
view of the Universe. The image was taken with the newly installed
WFC3/IR camera, with the positions of newly discovered galaxies at
z |
The galaxy luminosity function (LF) at z ~ 7 was
derived from the combined observations by HST
and large ground-based telescopes
(Bouwens et al. 2010c;
Ouchi et al. 2009;
Castellano et al. 2010).
Wide-field observations using the ground-based telescopes
are important to determine the bright-end of the LF,
whereas HST is able to detect fainter galaxies.
The LF is fit by a Schechter function
which is described by a power-law towards the
faint end such that  L-
(see Figure 3).
The faint-end slope is a critical quantity to
derive the global star formation rate density
and to estimate the ionizing photon budget for hydrogen reionization
(Stiavelli, Fall &
Panagia 2004).
Athough the current data generally suggests a steep power-law
with ~ 1.7-1.9,
it does not yet allow researchers to make a precise determination of
. More data to be aquired
by the Cosmic Assembly Near-Infrared Deep Extragalactic Legacy
Survey 1 (CANDELS)
using HST will reduce the uncertainty in the faint-end
slope substantially.
L-
(see Figure 3).
The faint-end slope is a critical quantity to
derive the global star formation rate density
and to estimate the ionizing photon budget for hydrogen reionization
(Stiavelli, Fall &
Panagia 2004).
Athough the current data generally suggests a steep power-law
with ~ 1.7-1.9,
it does not yet allow researchers to make a precise determination of
. More data to be aquired
by the Cosmic Assembly Near-Infrared Deep Extragalactic Legacy
Survey 1 (CANDELS)
using HST will reduce the uncertainty in the faint-end
slope substantially.
 |
Figure 3. UV luminosity function at z ~ 7. Shown is the number density of sources per unit magnitude vs. the absolute (soft) UV AB magnitude. Left panel: LF at z ~ 7, as derived from HST NICMOS and ground-based observations (large solid red circles), together with other determinations, as labelled in the figure. Overplotted is the best-fit Schechter function (solid red line). Right panel: A comparison of the UV LF at z ~ 7 (solid red circles), with those at z ~ 6 (cyan), z ~ 5 (green), and z ~ 4 (blue). Evidently the LF evolves over the redshift interval considered here. Adopted from Bouwens et al. (2010a). |
The newly-discovered galaxies beyond z ~ 7 appear to be
quite "blue". It is convenient to characterize a galaxy's
stellar population by the UV spectral slope,
 , where
the flux density is: f
, where
the flux density is: f .
The z ~ 7 galaxies show an unusually hard UV continuum
with <
-3, with fainter sources having bluer continuum
(Bouwens et al. 2010b,
c;
Finkelstein et al. 2010).
This is in pronounced contrast with local starburst galaxies
and Lyman-break galaxies at z < 6 that have typically
~ -2.
Interestingly, the steep continua of the z ~ 7 galaxies
can be accounted for by stars with very low metallicities,
Z < 5 × 10⁻⁴
Z
.
The z ~ 7 galaxies show an unusually hard UV continuum
with <
-3, with fainter sources having bluer continuum
(Bouwens et al. 2010b,
c;
Finkelstein et al. 2010).
This is in pronounced contrast with local starburst galaxies
and Lyman-break galaxies at z < 6 that have typically
~ -2.
Interestingly, the steep continua of the z ~ 7 galaxies
can be accounted for by stars with very low metallicities,
Z < 5 × 10⁻⁴
Z (Taniguchi, Shioya &
Trump 2010).
(Taniguchi, Shioya &
Trump 2010).
The star formation history of individual galaxies can be inferred from the mass density of long-lived stars. Infrared observations by the Spitzer Space Telescope provided information on the color, or shape of the spectral energy distribution (SED), of high-z galaxies. The data have been used to estimate the stellar mass and approximate star formation histories of those galaxies (Eyles et al. 2007; Stark et al. 2007; Labbe et al. 2010). Luminous z ~ 7 galaxies have stellar masses of 109-10 solar masses (see Figure 4). Obviously these luminous galaxies are not the first galaxies of our definition, but likely are descendants of the first galaxies. A sample of z ~ 7 galaxies shows evidence of extended star formation over a mean period of 300 Myr (Gonzalez et al. 2010). This is indicative that star formation in these galaxies and their progenitors must have begun at redshifts z > 10 (Mobasher et al. 2005; Wiklind et al. 2008). The z ~ 7 galaxies may thus have preserved the signature of star and galaxy formation in the pre-reionization era.
 |
Figure 4. Stellar mass of high-redshift
galaxies. The colored symbols represent data for LBGs with
characteristic luminosity (L |
There is another population of high-redshift galaxies, characterized by
strong Lyman- line emission.
The LF of the Lyman-
emitters (LAEs) has been obtained by
Hu et al. (2004)
and by
Malhotra & Rhoads
(2004),
and more recently by observations with the Subaru telescope
(Ouchi et al. 2010;
Hu et al. 2010).
The evolution of the LAE LF across a redshift of six
is particularly interesting because the observed
Lyman- luminosity of a
galaxy can be significantly affected by neutral hydrogen in the IGM
(see Figure 5).
The evolution of the IGM density and the neutral fraction can be
imprinted in the apparent LF of LAEs
(Dijkstra, Wyithe &
Haiman 2007;
Iliev et al. 2008;
Dayal, Ferrara &
Gallerani 2008).
Even the local and large-scale velocity field
of the IGM affect the line profile and luminosity of
individual galaxies
(Dijkstra & Wyithe
2010;
Zheng et al. 2010).
Recent observations by
Kashikawa et al. (2006),
Ouchi et al. (2009)
and
Hu et al. (2010)
showed that the LF evolution from z = 5.7 to z = 7
is small. The abundance of LAEs decreases at z > 5.7,
indicating either that there was a slight
change in the neutral fration of the IGM over the time,
or that the galaxies themselves evolved.
Because of radiative transfer effects
for Lyman- photons with
their large absorption and scattering cross-sections,
the relationship between the intrinsic
Lyman-
luminosity and the apparent, i.e., observed, one
is rather involved. The appearance of LAEs depends on density and velocity
structures of the IGM surrounding them
(McQuinn et al. 2007;
Zheng et al. 2010).
LAEs themselves could be sources of reionization, which decrease the
neutral fraction of the IGM in their vicinities.
Interpreting the LF function evolution is thus difficult.
Large-volume cosmological simulations with
Lyman- radiative
transfer will be needed to quantify and more fully understand
this complex interplay.
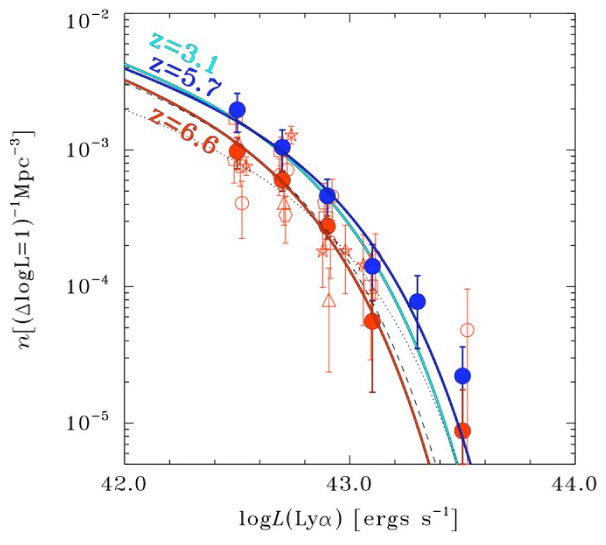 |
Figure 5. Evolution of
Lyman- |
An important question is what the dominant sources of reionization are. The available observations robustly show that the currently probed high-redshift galaxies, presumably the most luminous ones at the respective epochs, are not the dominant sources of reionization. This is evident by simply counting the total number of ionizing photons from the observed galaxies, and comparing them with the critical ionizing photon production rate for reionization (Madau, Haardt & Rees 1999; Robertson et al. 2010). There must have been many more faint galaxies that contributed as reionization sources. Interestingly, even if one integrates the currently estimated LF to the very faint end, the estimated ionizing photon budget still falls short of what is required to reionize the Universe (Ouchi et al. 2009). Apparently, faint galaxies must have had large photon escape fractions, and/or harbored stars with a more top-heavy IMF. Alternatively, there may have been different types of early sources of reionization, such as mini-quasars and massive Pop III stars (Ricotti & Ostriker 2004; Sokasian et al. 2004; Kuhlen & Madau 2005).
1 http://candels.ucolick.org Back.
 7-8 indicated
by the circles in the zooms on the left-hand side. Figure courtesy of
NASA.
7-8 indicated
by the circles in the zooms on the left-hand side. Figure courtesy of
NASA.