


A number of X-ray instruments have been launched above the atmosphere, which is opaque to X-rays, to study X-ray sources in the last 40 years. X-ray telescopes typically reflect X-rays at grazing incidence using mirros coated with a high-Z material. CCDs, proportional counters, and microchannel plates have been used to record the positions of X-ray photons and make low resolution energy measurements. Crystals, reflection and transmission gratings have been used to disperse X-rays and produce high resolution spectra.
Below, we first discuss some of the important characteristics of X-ray telescopes and the relevant instrumentation that is used to study clusters of galaxies in X-rays. Then, we discuss the analysis techniques that are used to interpret the data collected from these satellites.
4.1. X-ray Telescopes and their Relevance to Clusters
X-ray photons from astrophysical sources have been detected by a number of X-ray telescopes. For observations of clusters of galaxies, several instrument characteristics have been important for gaining a complete description of the X-ray emission.
Spectral Resolution: First, the spectral resolution or resolving
power ( /
/
 or
E / E)
affects the ability
to extract useful information from the spectrum. For typical temperatures in
clusters of galaxies, the Fe L complex most strongly constrains the
distribution of temperatures. Merely detecting or not detecting an emission
line from a given charge state from a given ion, places narrow
constraints on
the distributions of temperatures in the plasma. The required resolution to
resolve lines from individual Fe L ions is about 100 at 1 keV. Most X-ray
detectors, which historically have been either proportional counters or
solid-state devices, have been unable to achieve this resolution and
therefore the Fe L complex appears as an unresolved bump in the
spectrum. Proportional counters work by the incoming X-ray being
photoelectrically absorbed an inert gas atom followed by
the measurement of the electrical discharge induced by the cascade Auger
electrons and the further release of fluorescent X-rays. They typically
achieve resolution near 20%. CCD devices work by the X-ray
creating a photo-electron in the silicon, which creates a electron-hole pair
cascade through ionization. The electrons drift to a set of surface contacts
due to an electric field and the number of electrons is used to measure
the energy of the incident X-ray. These typically have resolving powers
near 10 or 20 at 1 keV. These devices can, however, measure an average
temperature accurately from the shape of the continuum, which is
sensitive to the bremsstrahlung emission, or from the centroid of the Fe
L complex. These instruments, however, have difficulty contraining the
distribution of temperatures composing a single spectrum.
or
E / E)
affects the ability
to extract useful information from the spectrum. For typical temperatures in
clusters of galaxies, the Fe L complex most strongly constrains the
distribution of temperatures. Merely detecting or not detecting an emission
line from a given charge state from a given ion, places narrow
constraints on
the distributions of temperatures in the plasma. The required resolution to
resolve lines from individual Fe L ions is about 100 at 1 keV. Most X-ray
detectors, which historically have been either proportional counters or
solid-state devices, have been unable to achieve this resolution and
therefore the Fe L complex appears as an unresolved bump in the
spectrum. Proportional counters work by the incoming X-ray being
photoelectrically absorbed an inert gas atom followed by
the measurement of the electrical discharge induced by the cascade Auger
electrons and the further release of fluorescent X-rays. They typically
achieve resolution near 20%. CCD devices work by the X-ray
creating a photo-electron in the silicon, which creates a electron-hole pair
cascade through ionization. The electrons drift to a set of surface contacts
due to an electric field and the number of electrons is used to measure
the energy of the incident X-ray. These typically have resolving powers
near 10 or 20 at 1 keV. These devices can, however, measure an average
temperature accurately from the shape of the continuum, which is
sensitive to the bremsstrahlung emission, or from the centroid of the Fe
L complex. These instruments, however, have difficulty contraining the
distribution of temperatures composing a single spectrum.
Dispersive instruments, which either use a grating or crystal, have achieved high spectral resolution in the Fe L band. Crystals disperse X-rays according to the Bragg condition in which constructive interference is set up by the X-ray wavelength being equal to a multiple of the projected crystal spacing. Reflection and transmission gratings disperse X-rays by a constructive periodic surface where the X-ray wave will interfere constructively for a given angle of incidence. Both the Reflection Grating Spectrometers on XMM-Newton, and the Focal Plane Crystal Spectrometer on the Einstein Observatory produced high resolution X-ray spectra of clusters. Future missions may include non-dispersive microcalorimeters, which use the temperature change of a cryogenically-cooled absorber due to the photo-electron to measure the energy of the X-ray. The Astro-E1 and Suzaku missions included a microcalorimeter, but unfortunately the rocket failed for Astro-E1 and the microcalorimeter did not operate long enough to observe cosmic X-rays for Suzaku. A microcalorimeter can achieve sufficiently high spectral resolution in the Fe K band such that few hundred km/s velocities of the intracluster medium could be measured.
Effective Area and Exposure Time: The effective collecting area and the exposure time of the observation determine the number of photons collected. The number of photons enters into the effectiveness of the observation in a number of ways. Typically, tens of thousands of photons are collected in a given observation. Hundred of photons are necessary to make any detailed surface brightness image. Thousands of photons are necessary to make detailed spectroscopic measurements of the temperature. Tens of thousands of photons are necessary to make detailed measurements of elemental abundances as well as the construction of the differential emission measure.
Field of View: Field of view determines the fraction of photons from a cluster that are detected. Often, the field of view has been smaller than the sizes of typical nearby clusters and therefore are an important factor in comparing results from different instruments.
Spectral Bandpass: The spectral bandpass of most X-ray instruments has been quite large and for the most part encompassed most of the X-ray spectral band. Most of the photons from clusters of galaxies are emitted below 2 keV, and most instruments have had high efficiency at these energies.
Angular Resolution: Angular resolution is an important factor for spatially-resolved spectroscopy. XMM-Newton (with FWHM of 6") and Chandra (with FWHM of 0.5"), for example, have been able to perform spatially-resolved photometry on kiloparsec scales for nearby clusters.
Analysis techniques play a vital role in the interpretation of X-ray spectra from clusters of galaxies. The data analysis is usually quite complex compared to the techniques that can be applied to data from unresolved sources. In addition, the instrument response functions are actually quite complex, and therefore the application of these functions is usually problematic and results often are somewhat model dependent.
X-ray photons that are recorded in detectors after being reflected and
dispersed by
optics have three quantities that are measured: two detector coordinates,
x and y and one energy measurement, p. These are
indirectly related to the position of the photon on the sky,
 and ψ, and the photon's intrinsic energy, e. For dispersive
spectrometers the relationship between these three variables and their
detector counterparts are very indirect and the full convolution has to
be considered. For non-dispersive spectrometers, the relationship is
more direct so approximations can be used. For example, it is customary
to assume that (x, y)
and ψ, and the photon's intrinsic energy, e. For dispersive
spectrometers the relationship between these three variables and their
detector counterparts are very indirect and the full convolution has to
be considered. For non-dispersive spectrometers, the relationship is
more direct so approximations can be used. For example, it is customary
to assume that (x, y)
 (,
ψ) when extracting a spectrum to perform spatially-resolved
spectro-photometry or to assume that p
e to construct
an image.
(,
ψ) when extracting a spectrum to perform spatially-resolved
spectro-photometry or to assume that p
e to construct
an image.
The detection probability, D, for a photon emitted from solid angle
position,
 and energy,
e with measured values of detector
coordinates (x, y) and CCD pulseheight p is given by
and energy,
e with measured values of detector
coordinates (x, y) and CCD pulseheight p is given by
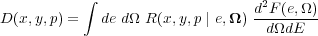 |
(37) |
where d2 F /
d dE
is the spatially-varying
spectral source model and R is the instrument response function.
All existing data analysis methods either solve this integral by, 1)
making approximations about the response function, 2) use a Monte
Carlo approach
(Peterson et
al. 2004),
or 3) perform an integration over
the solid angle and just
study the spectra 4) or perform an integration over the spectra and
just study the image. One can easily see some of the reasons for
confusing results on spectra from clusters of galaxies. It is often
somewhat ill-defined by what one analysis would mean when compared to
an analysis from a different instrument without specifying the full
source function, d2F /
d dE.
dE
is the spatially-varying
spectral source model and R is the instrument response function.
All existing data analysis methods either solve this integral by, 1)
making approximations about the response function, 2) use a Monte
Carlo approach
(Peterson et
al. 2004),
or 3) perform an integration over
the solid angle and just
study the spectra 4) or perform an integration over the spectra and
just study the image. One can easily see some of the reasons for
confusing results on spectra from clusters of galaxies. It is often
somewhat ill-defined by what one analysis would mean when compared to
an analysis from a different instrument without specifying the full
source function, d2F /
d dE.
Note that most analyses construct a response matrix and an ancillary response file, which are used in spectral codes like XSPEC (Arnaud 1996) or SPEX (Kaastra 1996). These codes multiply a source spectrum on a grid by the response matrix, which relates the input spectrum to the model observed spectrum. The model observed spectrum can be compared to the real data by statistical tests, typically a binned χ2 calculation. The response matrix (Rm) /ancillary response (A) file approach is a simplification of the response function above by assuming the following separation,
 |
(38) |
where A is constructed separately for each spectrum depending on the spatial position (x, y) of the photons being studied. This approach may or may not be appropriate for a particular analysis.
The source function is in turn related to the function in Equation 7 in Section 3.1.5 differentiated with respect to spatial coordinates.
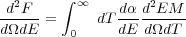 |
(39) |
where d2 EM /
d dT
is the differential emission measure per solid
angle. This function is the true observable if the plasma is
assumed to be in collisional equilibrium. Note that if a given patch of the
sky is assumed to be isothermal this will directly give a measurement of the
density, since the volume element can be related to the angular coordinate
for an assumed
source distance, assuming some geometry to obtain the depth. The
temperature structure in clusters is never completely isothermal, so a
variety of temperatures will be sampled along the line of sight.
We will not review all work in dealing with these data analysis problems, but refer to the individual work in the following section for more details since it can vary considerably between authors.