


A wealth of information has been collected by a number of X-ray satellites on cooling core clusters. Recently, there have been some strict tests to various aspects of the cooling-flow scenario. We review many of the previous spectroscopic and imaging results that led to the formation of the cooling-flow model for cluster thermal evolution. We then discuss how high resolution X-ray spectroscopic results have questioned a number of assumptions in the interpretation of the previous work. These observations have largely galvanized support around the idea that the thermodynamic evolution of cluster of galaxies is considerably different than was previously thought. We then review some recent X-ray imaging and spectro-photometric work that has left some clues to the resolution of the cooling-flow problem. Finally in this section, we define the structure of the cooling-flow problem in clusters of galaxies.
5.1. Early Work on Imaging Observations
The cooling time of the ICM is less than the Hubble time at the centers of many clustes as demonstrated by Lea et al. (1973) with the Uhuru mission. Imaging observations established the existence of sharp surface brightness peaks in some cluster of galaxies. These surface brightness peaks and short cooling times were interpreted as strong evidence for the existence of cooling flows. The existence of sharp surface brightness peaks were found by the Copernicus satellite (Fabian et al. 1974, Mitchell et al. 1975), rocket missions (Gorenstein et al. 1977), and SAS-3 (Helmken et al. 1978). Later missions established the widespread nature of the phenomenon by establishing that approximately 50% of all clusters contained sharp surface brightness profiles. The Einstein Observatory (Stewart et al. 1984, Arnaud 1998), EXOSAT Observatory (Lahav et al. 1989, Edge & Stewart 1991, Edge et al. 1992), and ROSAT Observatories (Allen et al. 2001a) confirmed this picture with observations of hundreds of nearby clusters of galaxies.
Considerable work was done to establish the implied mass deposition
rates from the cooling flows
(Jones & Forman
1984).
The mass deposition
rates,  , were
estimated to be between 1-10 solar mass
per year for a giant elliptical galaxy and 100-1000 solar masses per
year for the largest clusters of galaxies. A first order estimate of
the mass deposition rate is simply made by taking the total gas mass
calculated from the density profile and dividing that by the cooling
time at the edge of the region. Alternatively, this can be written as
the luminosity of the cooling flow volume divided by the temperature
(in units of kT) times the mean mass per particle. More detailed
calculations take into account the work done on the gas by its
compression in the gravitational potential
(Thomas et
al. 1987,
White &
Sarazin 1987a,
White &
Sarazin 1987b,
White &
Sarazin 1987c,
White & Sarazin
1988,
Allen et al. 1993).
Generally, this effect is thought to reduce the overall level of mass
cooling by at most a factor of two from the amount predicted without
gravitational compression
(Arnaud 1998).
, were
estimated to be between 1-10 solar mass
per year for a giant elliptical galaxy and 100-1000 solar masses per
year for the largest clusters of galaxies. A first order estimate of
the mass deposition rate is simply made by taking the total gas mass
calculated from the density profile and dividing that by the cooling
time at the edge of the region. Alternatively, this can be written as
the luminosity of the cooling flow volume divided by the temperature
(in units of kT) times the mean mass per particle. More detailed
calculations take into account the work done on the gas by its
compression in the gravitational potential
(Thomas et
al. 1987,
White &
Sarazin 1987a,
White &
Sarazin 1987b,
White &
Sarazin 1987c,
White & Sarazin
1988,
Allen et al. 1993).
Generally, this effect is thought to reduce the overall level of mass
cooling by at most a factor of two from the amount predicted without
gravitational compression
(Arnaud 1998).
5.2. Early Work on Low Resolution Spectroscopy
The modeling of the X-ray spectra of cooling clusters has become considerably more mature in 30 years. In addition, some of the early work with cooling-flow models has now been discounted. This work exemplifies the difficulty in applying models at low spectral resolution. We briefly discuss some of the major changes to modeling the X-ray spectrum of cooling clusters.
The Areil-V satellite established that the emission from clusters of
galaxies was thermal (i.e. likely in collisional equilibrium) by
detecting the emission lines from the
Fe K blend (Fe XXV
He,
Fe XXVI Ly) from the
Perseus cluster
(Mitchell et
al. 1976).
Previously, there were arguments for the origin of
the X-ray emission from clusters as either inverse compton scattering
of microwave background photons off relativistic electrons or emission
from a collection of unresolved X-ray binaries. The detection of
thermal emission, however, established that the hot gas was trapped in
the dark matter potential and emitted at a temperature close to what
was expected from the velocity distribution of member galaxies.
blend (Fe XXV
He,
Fe XXVI Ly) from the
Perseus cluster
(Mitchell et
al. 1976).
Previously, there were arguments for the origin of
the X-ray emission from clusters as either inverse compton scattering
of microwave background photons off relativistic electrons or emission
from a collection of unresolved X-ray binaries. The detection of
thermal emission, however, established that the hot gas was trapped in
the dark matter potential and emitted at a temperature close to what
was expected from the velocity distribution of member galaxies.
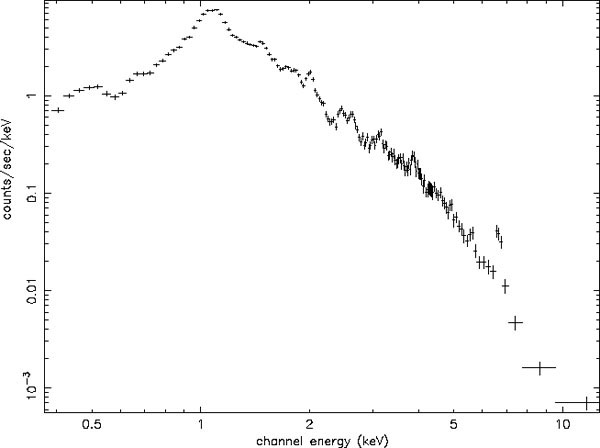 |
Figure 5. The X-ray spectrum of the central region of the Virgo cluster of galaxies obtained with the ASCA observatory. This spectrum is one of the highest quality spectra obtained prior to the launch of the RGS instruments on XMM-Newton. The bumps in the spectrum are due to unresolved blends of emission lines. In particular, the bump near 1 keV is due to a forest of Fe L shell transitions, which are quite sensitive to the temperature of the plasma. |
After the thermal model was established, hundreds, if not thousands, of clusters had their "mean" temperature measured with solid state detectors or proportional counters most frequently on the Einstein, EXOSAT, Beppo-SAX, and ASCA observatories. This work established relationships between many observables in clusters. In particular, relationships between temperature and luminosity (David et al. 1993, White et al. 1997, Markevitch 1998, Wu et al. 1999, Horner et al. 1999), mass (Nevalianen et al. 2000, Xu et al. 2001), and entropy (Ponman et al. 1999) indicate that mean cluster gas properties roughly follow from what is expected from self-similar gravitational collapse. There may be some deviation from these relations, more preferentially in lower mass clusters indicating the importance of non-gravitational processes in cluster formation and evolution.
It was discovered quite early that many clusters do not have an isothermal structure (Ulmer & Jernigan 1978) and have softer X-ray spectra in the core. This implies lower mean temperatures. A number of more complicated spectral models were later used to represent the X-ray emission from cooling-flows with EXOSAT, Einstein, Beppo-SAX, and ASCA observations. Two temperature models were used by a number of authors to represent the distribution of temperatures in the cores of clusters (Matsumoto 1996, Ikebe et al. 1997, Xu et al. 1998, Fukazawa et al. 1998, Fukazawa et al. 2000, Makishima 2001). An alternative interpretation of the cold gas in the cores of cluster was developed by Makishima (2001) where the dark matter halo of the cD galaxy is responsible for an unmixed ICM component.
Others used the cooling flow model discussed in Section 3.3 modified by an absorber. The absorber was necessary to reduce the soft X-ray emission at low energies observed by White et al. (1991). In retrospect it is clear that these observations were demonstrating a lack of emission at low energies relative to the cooling flow model, although this was not explicitly stated. In particular, the relatively low spectral resolution made it difficult to distinguish between models.
The absorber in these models was modelled typically as a single absorbing screen (White et al. 1991, Johnstone et al. 1992, Fabian et al. 1994, Buote & Fabian 1998, Buote et al. 1999, Buote et al. 2000a, Allen et al. 2000, Allen et al. 2001a). The screen was placed between the cluster and the observer, but the assumption was that this absorption was representing cold gas in the center of the cluster. The absorption typically had column densities near 1021 cm-2, which would have implied large quantities of cold molecular gas if it was distributed uniformly. Initial attempts to find this quantity of gas were unsuccessful (O'Dea et al. 1998), although considerable cold material has since been found by Edge et al. (2001) and Salome & Combes (2004). Another model used was a cooling flow model with a single absorption edge. The absorption edge had an energy near 0.7 keV, which could have been from ionized Oxygen possibly from warm (106 K) material (Buote et al. 2000b) or dust (Allen et al. 2001b). Later, high resolution Reflection Grating Spectrometer (RGS) observations demonstrated that the single edge model mimicked the effect of lack of emission from colder Fe ions. It is interesting to note, in particular, that the fitted energy of the single absorption edge was slightly lower than the 3s-2p transitions of Fe XVII, and would therefore optimally appear to absorb cooler emission from the standard cooling flow model.
Many observations generally established the cooling time is a fraction of a Gyr in relaxed clusters. They also clearly indicated that the temperature was lower where the central surface brightness was highest. These two fact are now shown clearly with recent data from the Chandra observatory in Figure 6 and 7.
 |
Figure 6. The cooling time as a function of radius for a sample of relaxed clusters as measured with Chandra. If left undisturbed, all plasma within 100 to 200 kpc would have sufficient time to cool. Figure adapted from Voigt & Fabian (2004). |
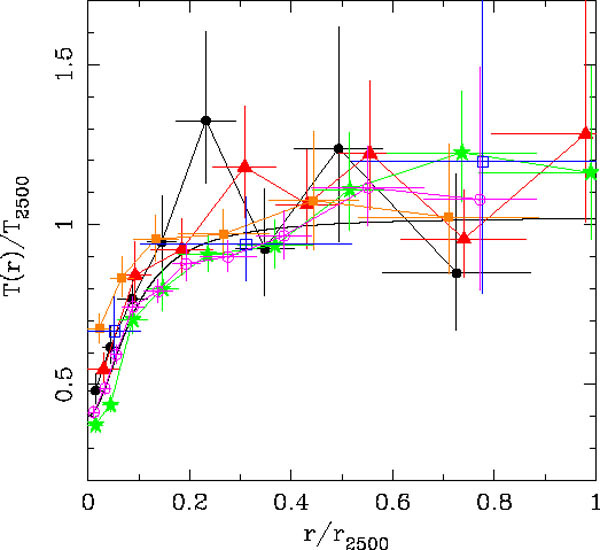 |
Figure 7. The average temperature in radial bins for a sample of relaxed clusters of galaxies as measured with Chandra. The temperature and radius are scaled to r2500. A typical cluster shows a clear decline in the average temperature at the center, which is in agreement with many spectroscopic studies over the previous two decades. Figure is adapted from Allen et al. (2001c). |
5.3. Focal Plane Crystal Spectrometer
The first high resolution observations of cooling clusters comes from the Focal Plane Crystal Spectrometer (FPCS) on the Einstein observatory. This instrument used a crystal to disperse X-rays according to the Bragg condition. It therefore could produce a high resolution spectrum by scanning in angle and therefore scanning in wavelength. This worked for an extended source like a cluster as well.
Unfortunately, there were only a limited number of these observations and the count rates were not particularly high. These observations demonstrated the existence of line emission from 8 ions (Canizares et al. 1979, 1982) in four different clusters. Some of these observations are contradicted by Reflection Grating Spectrometer observations as will be described in the next section, so it is likely that these observations were partially compromised by high background rates and, in some cases, relatively few photon counts.
5.4. Reflection Grating Spectrometer Observations
Observations made at high spectral resolution with the Reflection Grating Spectrometers on XMM-Newton have greatly clarified the observational interpretation of the soft X-ray spectra of cooling clusters. Although some information can be gained from the exact shape of the Fe L complex with low spectral resolution spectrometers, RGS observations resolve emission lines from each Fe L charge state (Fe XXIV through Fe XVII) and therefore can place crucial constraints of the amount of gas present between temperatures of 0.4 and 4 keV.
The initial application of the standard cooling flow model to a high resolution X-ray spectrum is shown in Figure 8 (Peterson et al. 2001). The top panel shows the spectral prediction between 5 and 35 Å. Emission lines are expected from Fe L ions in roughly equal strength between 10 and 18. Particularly prominent are emission lines from Fe XVII and 15 and 17 Angstroms. These emission lines are produced primarily from plasma between 300 and 700 eV and represent the last major emitting ion before a cooling plasma would cool to sub-X-ray temperatures.
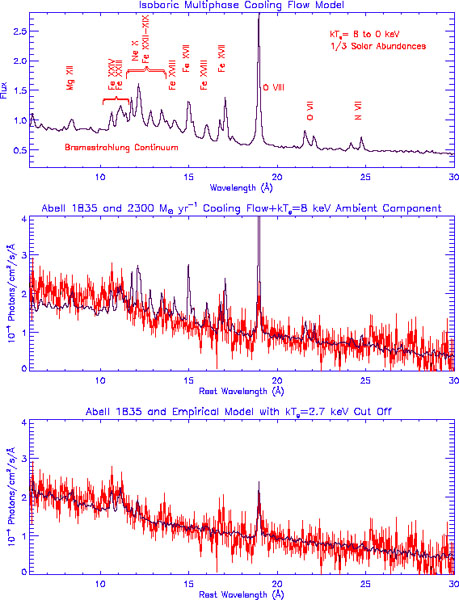 |
Figure 8. Three panels showing the cooling-flow model applied to the X-ray spectrum of the putative massive cooling-flow, Abell 1835. The top panel shows the standard isobaric cooling flow model (see the previous figure). The middle panel shows the model (blue) and the data obtained from the Reflection Grating Spectrometer on XMM-Newton (red). The model is clearly inconsistent with the X-ray spectrum, particularly in the prediction of Fe XVII emission line blends at 15 and 17 Å. The bottom panel shows the cooling flow model compared with the data, except all emission coming from temperatures below 2.7 keV is suppressed. The explanation for the success of this model is not known. Adapted from Peterson et al. (2001). The spectrum is taken from a 5 by 20 arcminute region of the core. |
High resolution spectroscopic evidence for lack of cool gas has been documented in a number of clusters (Peterson et al. 2001, Tamura et al. 2001a, Kaastra et al. 2001, Sakelliou et al. 2002, Tamura et al. 2001b). Characteristically, gas appears to be missing at near a third of the maximum temperature. This phenomena has also been documented in elliptical galaxies. Xu et al. (2002) found that Fe XVII and Fe XVIII was present in the nearby elliptical galaxy, NGC 4636. O VII, however, was not detected and has not been detected in any galaxy, group, or cluster core.
A more detailed analysis of the nature of the cooling flow problem is found in Peterson et al. (2003). A sample of 14 clusters were analyzed in a uniform way to demonstrate that the cooling flow problem manifests itself at a fraction of the maximum temperature in the center. In this sample it is shown that hot clusters (5-10 keV) generally only show evidence of Fe XXIV-XXII emission and no other Fe L charge states. Intermediate temperature clusters (2-5 keV) show evidence for Fe XXIV-Fe XIX emission, but no Fe XVII and Fe XVIII. The coolest clusters and groups (less than 2 keV) show evidence of the entire Fe L series but anomalously low levels of Fe XVII emission when compared with the standard cooling flow model. All of these observations are in contradiction with the standard cooling flow model, and suggest qualitatively that the model is violated at characteristically a fraction of the temperature and is more inconsistent with the model at lower temperatures.
In this quantitative analysis (Peterson et al. 2003), the cooling flow model was separated into four different temperature ranges as shown in Figure 9. Then the normalization of each temperature range was adjusted to empirically fit the spectrum shown in Figures 10, 11, and 12. The results from this study are shown in Figures 13 and 14. These graphs plot each of the four luminosity detections for each clusters. The lines connect the points that are actual spectral detections and not just upper limits. The standard cooling flow model would be if all the points would lie on a horizontal line. A comparison of Figure 13 and 14 suggests that when plotting the differential luminosity vs. the fraction of the temperature as in Figure 14, that the trend is more systematic. Therefore, the emission of a cooling flow is consistent with a power law in differential luminosity with exponent between 1 and 2. The cooling flow model, however, is strongly ruled out in many systems.
 |
Figure 9. The isobaric cooling flow model divided into the contributions from various temperature ranges, 0.375 to 0.75 keV (blue), 0.75 to 1.5 keV (green), 1.5 to 3 keV (yellow), 3 to 6 keV (red). |
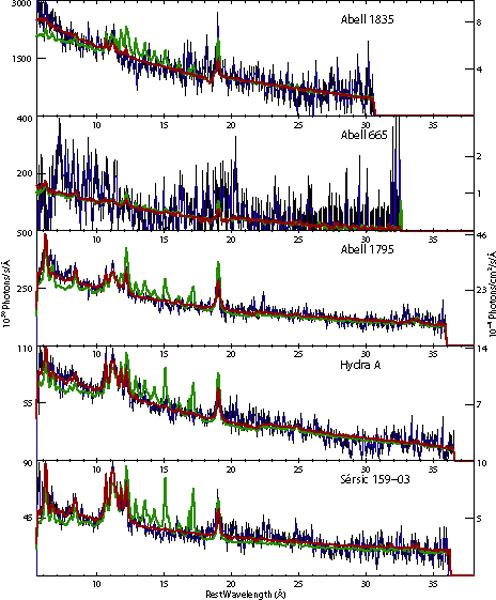 |
Figure 10. Two models compared with the Reflection Grating Spectrometer data of a sub-sample of massive cooling flows. The blue histogram is the RGS data, the green curve is the standard cooling-flow model, and the red is an empirical model where emission from the standard cooling-flow model is allowed to be adjusted in specific temperature ranges. The spectrum is taken from a 5 by 20 arcminute region of the core. |
 |
Figure 11. The same as the previous figure, but for a sample of intermediate mass clusters. |
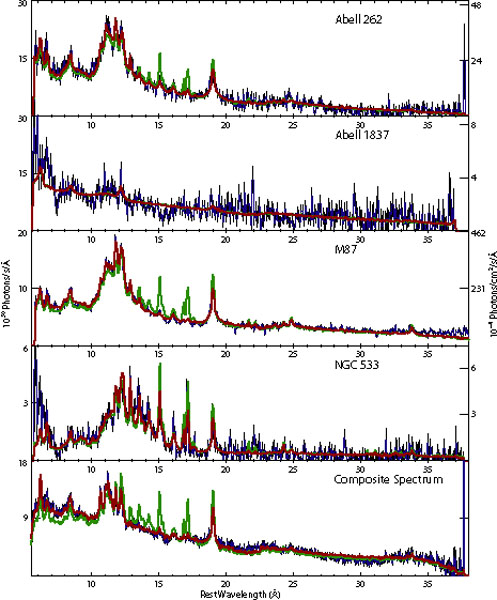 |
Figure 12. The same as the previous two figures, but a sample of low mass clusters and groups of galaxies. |
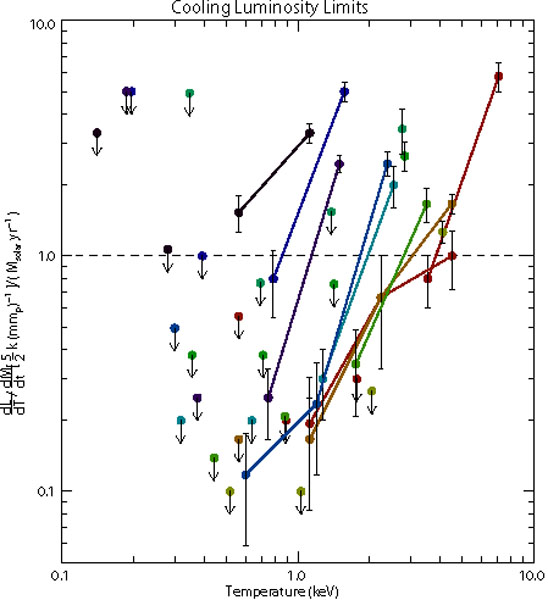 |
Figure 13. The relative amount of emission in various temperature ranges from a sample of 14 clusters obtained with the Reflection Grating Spectrometer on XMM-Newton. Each cluster is a different color, and each cluster has four points. Points that are not upper limits are connected by a straight line. The standard cooling flow model predicts the same amount of emission in each temperature range or a horizontal line. The data, however, are clearly inconsistent with that model. The detected emission has a much steeper distribution in temperature and many upper limits are a factor of several below the prediction. Adapted from Peterson et al. (2003). |
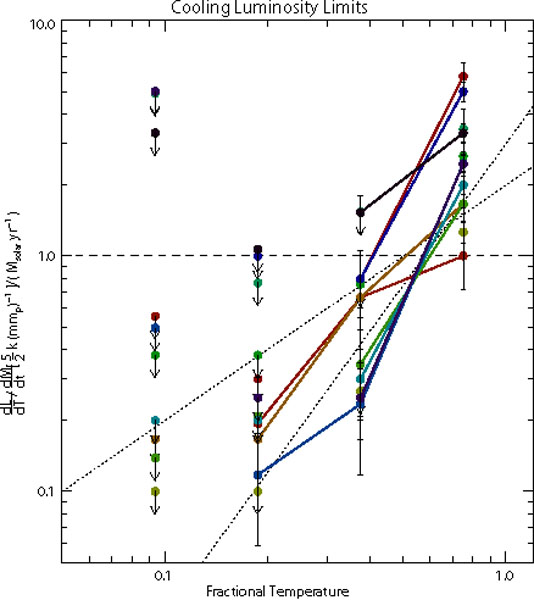 |
Figure 14. Same as the previous figure, except the points are normalized to the maximum temperature in the fit. A more systematic trend is seen where the emission follows a linear or quadratic form in temperature (dotted lines). There is significant scatter in the points, but there does appear to be a "self-similar" violation to the standard cooling flow model (dashed line). Adapted from Peterson et al. (2003). |
At this point, there has been no significant evidence for any significant difference between cooling flows of similar cluster mass. This poses some challenges for heating models where there is a time-dependence to the process. There also has been no evidence from X-ray spectroscopy that there are significant quantities of plasma at low X-ray temperatures above the expectation of the cooling flow model. In other words, Figure 14 shows a monotonically decreasing violation of the cooling flow model and no evidence for gas piling up at some intermediate temperature. This presents some challenges for continuous heating model that do not reheat the gas completely. For both of these reasons, it is not straight-forward to interpret these results in the context of any heating model regardless of the mechanism.
Finally, it is worth noting that these results generally are displaying the X-ray spectrum of the entire cooling flow volume. There is considerable work that is continuing to actually study the changes in the emission spectrum as a function of spatial position inside the cooling flow. These studies are difficult since determining a spatially-resolve differential emission measure require both high angular resolution and high spectral resolution. Following, we discuss some attempts to study the spatial-dependence of the X-ray emission of cooling flow at moderate spectral resolution.
5.5. Recent Spatially-resolved Spectro-photometric Observations
The RGS results obtained at high spectral resolution have been augmented with further studies at low resolution that attempt to study the spatial distribution in greater detail (David et al. 2001, Böhringer et al. 2001, Molendi & Pizzolato 2001, Schmidt et al. 2001, Ettori et al. 2002, Johnstone et al. 2001). In general, it has also been demonstrated that the low spectral resolution observations obtained with XMM-EPIC and Chandra, which are far more numerous, are generally consistent with the RGS observations. Significantly smaller mass deposition rates have been measured when the cooling flow model has been applied. Similarly, cut-off cooling flow models have been shown to be consistent with the data. Needless to say, a larger range of models can be applied to the low resolution data and still be statistically consistent with the data. In general, it appears that there is no strong evidence for any significant amount of cold gas (below 1/3 of the maximum temperature) in any cluster.
The radial profile of the temperature distribution in cooling flows is currently in dispute. It is clear that the ICM has a much narrower range of temperatures than compared to the standard cooling flow model as established by the RGS observations. It is not so clear, however, how narrow that distribution is at any given radius. Molendi & Pizzolato (2001) have argued that the ICM is nearly isothermal at a given radius and any departure from this is due solely to azimuthal variations. Buote et al. (2003) and Kaastra et al. (2004) have argued, however, that nearly a factor of two range of gas temperatures exists at any radius.
X-ray cavities have been discovered in a number of X-ray imaging observations. The cavities are presumably excavated by cosmic rays produced in outbursts by the central radio source (McNamara et al. 2001). These cavities are important in the study of cooling flows for a number of reasons. First, they represent direct empirical evidence that the cores of cluster have been disturbed. The work done by expansion of the bubbles assuming all the energy is deposited in the cooling flow is within a factor a few to the value required (Birzan et al. 2004). Second, they are relatively intact and coherent structures indicating the level of suppression of thermal transport processes possibly by a magnetic field. Therefore, they provide a source of external energy to the ICM and detailed study will eventually give us a complete picture of the transport of that energy.
Constant pressure surface brightness discontinuities, or "cold fronts", are present in many clusters of galaxies (Markevitch 2000). Cold fronts show that there are vast quantities of plasma oscillating with respect to the gravitational potential. Some may be cooler, denser groups that have fallen to the center, whereas others may be cooled gas that already was present in the core of the cluster but is oscillating because of a merger in the cluster outskirts (Churazov et al. 2003).
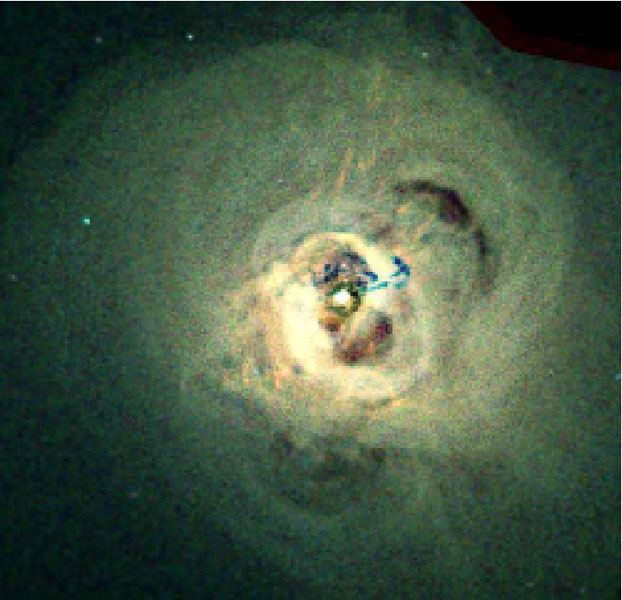 |
Figure 15. High resolution X-ray image of the Perseus cluster of galaxies. The bright source in the center is the active galactic nucleus of NGC 1275. The two adjacent holes in the X-ray emission as well as the mushroom shaped depression in the upper right are believed to be cavities in the ICM that have been excavated by cosmic rays expelled from the active galactic nucleus. Figure is adapted from Fabian et al. (2005b). |
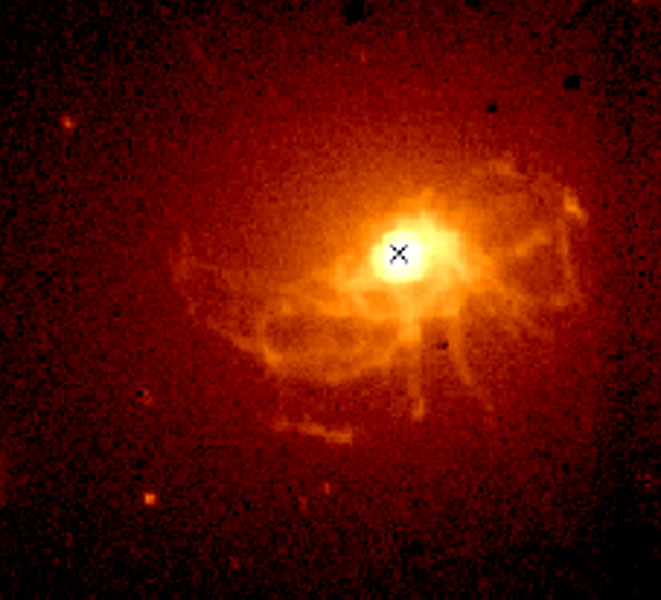 |
Figure 16. Image of the Centaurus cluster of galaxies overlayed with
H |
Fine ripples have been identified in the cluster gas of Perseus (Fabian et al. 2003a). These features are extremely weak and more study is needed to measure the temperatures across the discontinuities and confirm their properties. Detections of these features have also been claimed in Hydra A (Nulsen et al. 2004) and M 87 (Forman et al. 2003). It is unclear if these are an entirely separate phenomena from cold fronts. Given their proximity to the center, Fabian et al. (2003a) suggested that these were weak shocks and sound waves. In addition, Sanders et al. (2004) have identified an asymmetric "swirl" in the temperature distribution in the Perseus cluster. This observational feature is may be due to the effect of off-center cluster mergers.
5.6. Observations of Cataclysmic Variables
Although not the subject of this review, it is certainly worth noting that the X-ray spectrum of some binary accreting white dwarf systems, cataclysmic variables, actually resembles the X-ray spectrum of the standard cooling flow model (Mukai et al. 2003). The flow behind the standing shock in an accreting white dwarf involves the same physical processes as those expected for a cooling flow in a cluster although the geometry may be different. Although there are a great number of differences between clusters of galaxies and cataclysmic variables, these observations can be used to confidently say there is no mistake in applying a model for a radiative-cooling dominated plasma. Furthermore, this points to no major difficulties in the atomic physics models or subtle problem with the plasma physics arguments we have used.
5.7. Definition of the Cooling Flow Problem
We now briefly discuss what we believe the cooling flow problem is, and how it might be resolved. Clearly, the problem is quite complex and it is difficult not to see the problem in historical terms. Peterson et al. (2003), for example, discussed a difference between the soft X-ray cooling-flow problem and the mass sink cooling-flow problem. The former refers to the recent discrepancy seen in the soft X-ray spectrum between what was predicted and what was observed. The latter refers to the difficulty in detecting any by-products in cooling clusters from the hypothesized cooling-flow plasma.
These definitions, however, might just categorize our ignorance of the solution to the problem. The major difficulty is that: 1) the cluster plasma loses energy by emitting the very X-rays we detect, 2) efficient and distributed heat sources are difficult to construct, 3) the cluster plasma appears to cool most of the way, but 4) evidence for complete cooling is utterly lacking. The cooling-flow problem as we see it is to understand what happens in the middle of that process. After examining whether cooling flows are ruled out, we discuss many ideas that might alleviate the cooling-flow problem.
Note, from Fig. 6, that time variability on intervals longer than 108 yr cannot be the solution.