


Figure 8.4 shows as a function of age the
M* / LB ratio
(where M* is the stellar mass) for SSPs with
solar composition, and different IMFs each with a single
slope s over the whole mass range 0.1
 M
100
M. Very
large mass-to-light ratios are produced by either very flat (s =
1.35) or very steep (s = 3.35) IMFs, whereas the Salpeter's slope
gives the lowest values of the M* /
LB ratio. This is a result of the
different stellar demography already illustrated in
Figures 8.1
and 8.2, such that a steep IMF is
dwarf dominated, that is, most of the mass is in low-mass stars,
whereas a flat IMF is remnant dominated and most of the mass is
in dead remnants.
M
100
M. Very
large mass-to-light ratios are produced by either very flat (s =
1.35) or very steep (s = 3.35) IMFs, whereas the Salpeter's slope
gives the lowest values of the M* /
LB ratio. This is a result of the
different stellar demography already illustrated in
Figures 8.1
and 8.2, such that a steep IMF is
dwarf dominated, that is, most of the mass is in low-mass stars,
whereas a flat IMF is remnant dominated and most of the mass is
in dead remnants.
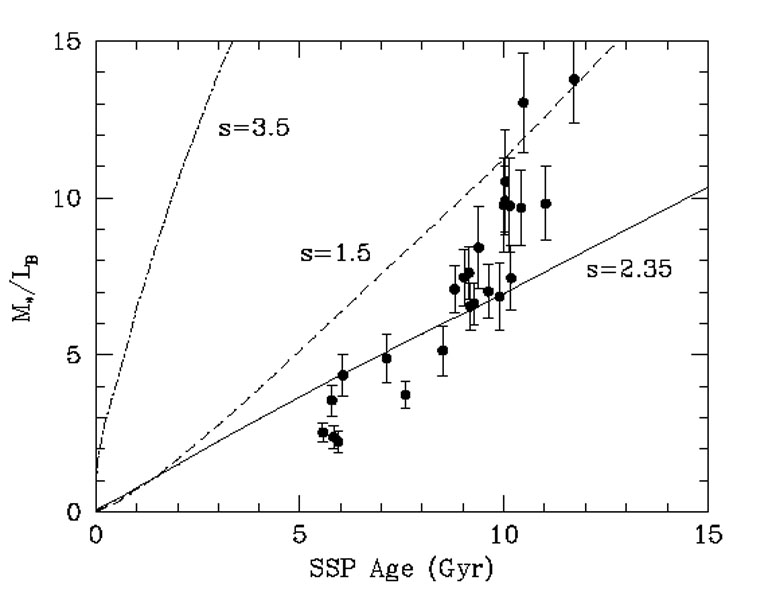 |
Figure 8.4. The stellar mass-to-light ratio
of solar metallicity SSPs as a function of age, for three different
single slope IMFs, from 0.1 to 100
M |
Measurements of the structure (e.g., half light radius) and stellar
velocity dispersion of elliptical galaxies provide estimates of their
dynamical mass, hence their dynamical mass-to-light ratio can be
compared to the stellar M / L ratio. This is shown in
Figure 8.4 for a sample of local elliptical
galaxies with detailed dynamical modelling, having adopted a relation
between the luminosity-weighted age of their stellar
populations and velocity dispersion, namely Log(Age / Gyr) = -0.11 +
0.47 Log( v),
consistent with
Eq. (6.16). Clearly very steep (s = 3.5) and very flat
(s = 1.5) slopes of the IMF appear to be excluded by the data,
whereas the intermediate (Salpeter) slope is quite consistent with the data,
apart from the older galaxies which have a higher M / L
ratio than the SSP models. However, besides an increase of age also the
average metallicity is likely to increase with
v, with the
galaxies in Figure 8.4 spanning a range from ~ 1/2
solar to ~ 2 times solar. Thus, the same galaxies are displayed
again in Figure 8.5, together with model
M / L ratios for a
straight Salpeter IMF and three different metallicities. The
trend in M / L ratio exhibited by the data appears to be
consistent with the trend resulting from the metallicity trend with
v, and with a
straight Salpeter IMF. However, things
may not be as simple as they appear. Dark matter may contribute to the
dynamical M / L ratios, and the IMF may not be straight
Salpeter. A Salpeter-diet IMF such as that shown in
Figure 8.1 would give
M* / LB ratios
systematically lower by ~ 40% than shown in these figures, thus opening
some room for a dark matter contribution to the dynamical mass of these
galaxies.
Alternatively, an IMF slightly flatter than Salpeter at high masses,
with its larger contribution by stellar remnants, would reproduce the
high dynamical M / L ratios of the oldest galaxies,
without dark matter contribution. It is quite difficult to circumvent
this dark-matter/IMF degeneracy on the dynamical M / L
ratios of elliptical galaxies.
v),
consistent with
Eq. (6.16). Clearly very steep (s = 3.5) and very flat
(s = 1.5) slopes of the IMF appear to be excluded by the data,
whereas the intermediate (Salpeter) slope is quite consistent with the data,
apart from the older galaxies which have a higher M / L
ratio than the SSP models. However, besides an increase of age also the
average metallicity is likely to increase with
v, with the
galaxies in Figure 8.4 spanning a range from ~ 1/2
solar to ~ 2 times solar. Thus, the same galaxies are displayed
again in Figure 8.5, together with model
M / L ratios for a
straight Salpeter IMF and three different metallicities. The
trend in M / L ratio exhibited by the data appears to be
consistent with the trend resulting from the metallicity trend with
v, and with a
straight Salpeter IMF. However, things
may not be as simple as they appear. Dark matter may contribute to the
dynamical M / L ratios, and the IMF may not be straight
Salpeter. A Salpeter-diet IMF such as that shown in
Figure 8.1 would give
M* / LB ratios
systematically lower by ~ 40% than shown in these figures, thus opening
some room for a dark matter contribution to the dynamical mass of these
galaxies.
Alternatively, an IMF slightly flatter than Salpeter at high masses,
with its larger contribution by stellar remnants, would reproduce the
high dynamical M / L ratios of the oldest galaxies,
without dark matter contribution. It is quite difficult to circumvent
this dark-matter/IMF degeneracy on the dynamical M / L
ratios of elliptical galaxies.
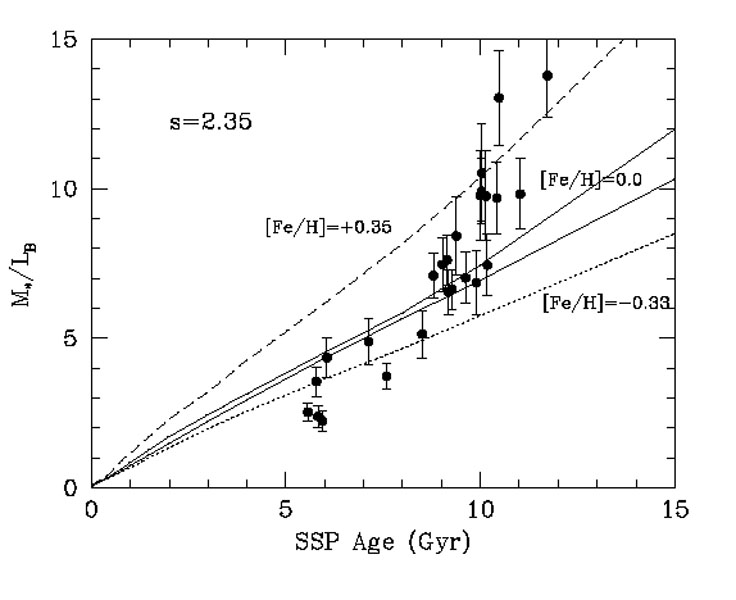 |
Figure 8.5. The M / L ratio of SSPs with a straight Salpeter IMF, for subsolar (dotted), supersolar (dashed) and solar metallicity (solid), as indicated. The two solid lines refer to two releases of the same set of SSP models (source: model M / L ratios are from Maraston, C. (1998, Mon. Not. R. Astron. Soc., 300, 872; 2005, Mon. Not. R. Astron. Soc., 362, 799); data points are the same as in Figure 8.4). |