


High resolution radio observations are used in many astronomical fields. They provide information about the structures around Active Galactic Nuclei (AGN), their accretion disks, powerful relativistic jets, magnetic fields, and absorbing material, and they are used to image peculiar binary stars, radio-stars and young supernova remnants. Spectroscopic VLBI-observations allow one to investigate compact maser emitting regions of various kinds in galaxies, star birth regions and stellar envelopes. The phase-referencing technique allows to determine source positions with highest possible accuracy. This section will summarize some of the observational highlights obtained by very long baseline radio interferometers.
3.1. Active Galactic Nuclei and their jets
The luminosity of most of the known galaxies is dominated in the optical by their stellar emission, but in some galaxies a significant fraction of the energy output has a non-thermal origin. These are called active galaxies or Active Galactic Nuclei (AGN), if the non-thermal emission comes mainly from the core. Although AGN represent only a small fraction of all galaxies they have been studied intensively over the last 40 years at all accessible wavelengths. This is partly because their high luminosities made them the only objects that could be studied at cosmologically significant distances for a long time. At radio wavelength some active galaxies are the most luminous sources in the sky and were the first sources detected in the early days of radio astronomy (e.g. Baade and Minkowski 1954).
In many powerful radio galaxies, the radio emission is detected several hundreds of kiloparsec away from the centre of the associated optical galaxy (e.g. Bridle and Perley 1984 and references therein). These regions are called radio lobes. In other cases, however, a large portion of the radio emission comes from much smaller regions at the centre of the galaxy with dimensions of only a few parsecs. These centres are also visible in lobe-dominated objects, and they supply the lobes with plasma via relativistic outflows, which are called jets.
Since single-dish radio telescopes have rather low resolution, observations of jets and lobes in radio galaxies were one of the main drivers for the development of radio interferometers in the early 1960s (Ryle and Hewish 1960). In particular the development of Very Long Baseline Interferometry (VLBI) made it possible to image the inner regions of AGN and it is still the only technique capable to image sub-parsec-scale structures in extra-galactic objects. The direct imaging of parsec-scale jets and the complementary study of activity in the associated AGN in all spectral regimes has broadly enhanced our understanding of these objects. Based on the last decades of detailed observations of AGN a common scheme about their nature has been established.
It is believed that the high luminosities of AGN are due to accretion
on to a super-massive black hole (e.g.
Begelman et al. 1984,
Meier
et al. 2001).
The 106-10
M black
hole is surrounded by an accretion disc and probably a hot corona mainly
radiating at optical to soft X-ray energies
(Antonucci and Miller 1985).
In the vicinity of the nucleus
high velocity gas, characterized by broad optical emission lines,
forms the so called broad-line region (BLR), and lower velocity gas
with narrower emission lines forms the narrow-line region (NLR). An
obscuring torus of gas and dust is hiding the central region including
the BLR from some directions. The term "torus" is often used in this
context, but it is not sure at all which geometrical form the absorber
has. At the poles relativistic jets are formed and expand for several
tens of kiloparsec or even up to megaparsecs (e.g.
Urry
and Padovani 1995).
black
hole is surrounded by an accretion disc and probably a hot corona mainly
radiating at optical to soft X-ray energies
(Antonucci and Miller 1985).
In the vicinity of the nucleus
high velocity gas, characterized by broad optical emission lines,
forms the so called broad-line region (BLR), and lower velocity gas
with narrower emission lines forms the narrow-line region (NLR). An
obscuring torus of gas and dust is hiding the central region including
the BLR from some directions. The term "torus" is often used in this
context, but it is not sure at all which geometrical form the absorber
has. At the poles relativistic jets are formed and expand for several
tens of kiloparsec or even up to megaparsecs (e.g.
Urry
and Padovani 1995).
Not all AGN show observational signatures of every component. Therefore several classes were defined that divide AGN mainly into type 1 source which exhibit broad emission lines from the BLR and type 2 sources that do not show broad emission lines. Both groups contain radio-loud and radio-quiet objects, with a division being made at a ratio of the 5 GHz radio to the optical R-band flux of 10 (see also Sect. 3.1.4). Table 2 summarizes the separation into different types of AGN. Type 0 sources are called blazars and originally defined sources with no line emission. This class mainly contains BL Lac objects and flat spectrum quasars (FSRQs). However, with modern and more sensitive observations emission lines have been detected in several FSRQs and also in a few BL Lac objects. Narrow line radio galaxies include two radio morphology types: the lower-luminosity Fanaroff-Riley type I (FR I) radio galaxies with often symmetrical jets that broaden and fade away from the nucleus, and the FR II radio galaxies, which show highly collimated jets leading to well-defined lobes with hot spots (Fanaroff and Riley 1974).
| Radio | Emission line properties | ||
| loudness | Type 2 | Type 1 | Type 0 |
| narrow lines | broad lines | "no" lines | |
| radio-quiet: | Seyfert 2 | Seyfert 1 | |
| Liners | Quasar | ||
| radio-loud: | NLRG | Quasar | Blazars |
Obscuring material found in type 2 sources (Rowan-Robinson 1977) and the detection of polarized broad emission lines in Seyfert 2 galaxies (Antonucci and Miller 1985) led to the idea of a unified scheme for AGN. In addition, depending on the orientation of the jet to our line of sight, relativistic beaming (see Sect. 3.1.3 about relativistic beaming) of the jet emission strongly affects the appearance and classification of the AGN. Whether AGN are classified type 1 or 2 depends on the obscuration of the luminous nucleus, and whether a radio-loud AGN is a blazar or a radio galaxy depends on the angle between the relativistic jet and the line of sight (e.g. Antonucci 1993, Urry and Padovani 1995). An illustration of the unified scheme for AGN is given in Fig. 5.
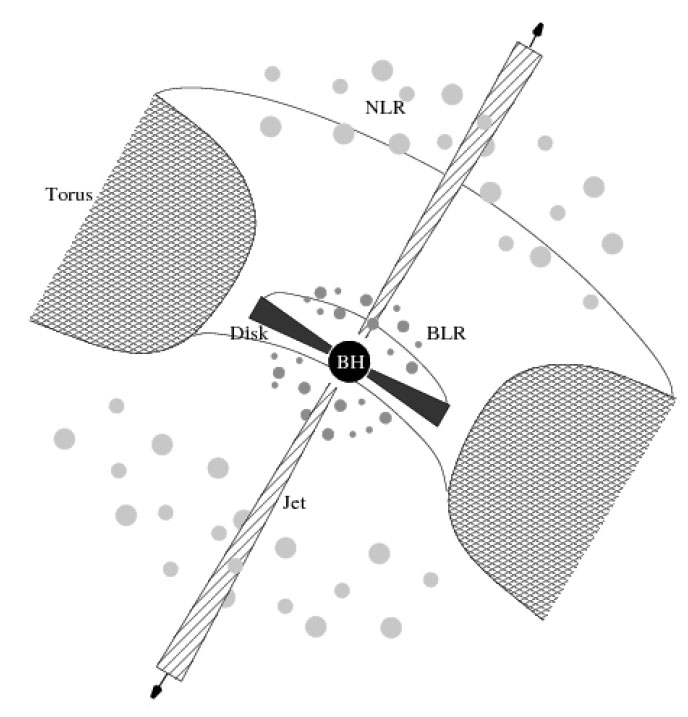 |
Figure 5. Unification scheme for AGN (not to scale). In this picture the appearance of an AGN depends strongly on the viewing angle. For some directions the central part is hidden by the torus (or an absorber of some other geometrical form), whereas from other directions the innermost parts are visible. |
3.1.2. VLBI structures in AGN jets
AGN are in the focus of VLBI observations since the first measurements were performed in 1967. At the beginning of VLBI mainly detailed studies of a few bright sources were carried out, but as new technical developments increased the observed bandwidth and therefore the sensitivity of the observations, and with the advent of the VLBA, larger surveys of hundreds of sources for statistical studies became possible (Pearson and Readhead 1988, Taylor et al. 1996, Kellermann et al. 1998, Fomalont et al. 2000, Lister and Homan 2005). Newer surveys even provide total intensity and linear polarization images of more than 1000 sources (Beasley et al. 2002, Helmboldt et al. 2007).
When speaking about relativistic jets in AGN one usually only considers radio-loud AGN, because they harbour the brightest, largest, and best studied jets. Nevertheless, they constitute only about 10% of the AGN population and it seems likely that also radio-quiet AGN produce jets (e.g. Falcke et al. 1996a, 1996b, Ulvestad et al. 2005). The formation of powerful jets may depend on many parameters, but given the number of different types of objects from AGN to stellar black holes and Herbig-Haro objects, where jets have been observed, jet formation must be possible in almost all circumstances.
The typical parsec-scale radio morphology of a radio-loud AGN is a bright
point-like component, referred to as the "core" component, and an extension
pointing away from the core: the jet (Fig. 6,
top panels). This class makes up about 90% of the radio-loud AGN. The
rest divides into point-like or
double-sided source (Fig. 6, bottom panels) or
more irregular sources. In the case of the point-like sources we
probably see only the core, but for the others it is sometimes more
difficult to judge which component the core is. Usually
this is done on the bases of compactness and the radio spectrum. The
core has a flat to inverted radio spectrum
( > -0.5 with
S
> -0.5 with
S 
 ).
Since the synchrotron spectrum should be flat only at its peak
frequency the appearance of flat spectra in AGN cores over a wide
range of frequencies caused some discussion (e.g.
Marscher
1977).
There is still some discussion about
this, but the most common explanation is that the flat core spectrum
is the result of a superposition of several distinct synchrotron
components each of which has a peaked spectrum at a slightly different
frequency ("cosmic conspiracy",
Cotton et
al. 1980).
The jets have usually steeper spectra with
< -0.7, resulting
from optically thin synchrotron emission.
).
Since the synchrotron spectrum should be flat only at its peak
frequency the appearance of flat spectra in AGN cores over a wide
range of frequencies caused some discussion (e.g.
Marscher
1977).
There is still some discussion about
this, but the most common explanation is that the flat core spectrum
is the result of a superposition of several distinct synchrotron
components each of which has a peaked spectrum at a slightly different
frequency ("cosmic conspiracy",
Cotton et
al. 1980).
The jets have usually steeper spectra with
< -0.7, resulting
from optically thin synchrotron emission.
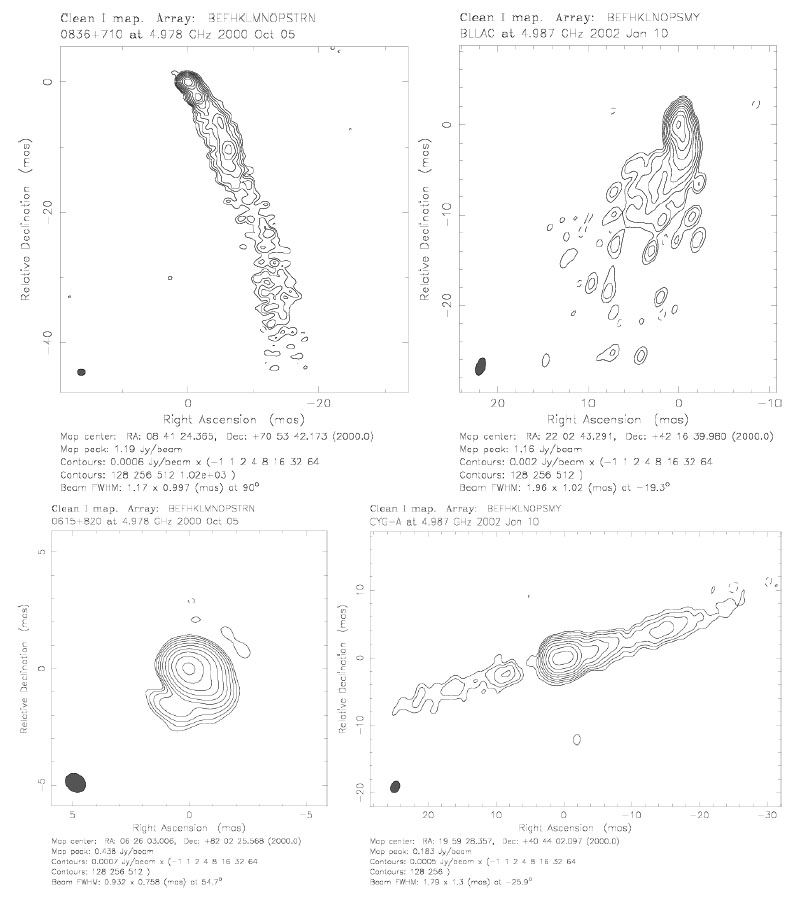 |
Figure 6. Typical parsec-scale radio morphology of AGN seen at 5 GHz using the VLBA plus Effelsberg. 90% of the sources show this core-jet structure with smooth parts, knots, bends or gaps (top panels). Some are quasi point-like (bottom-left), or, if the viewing angle is large enough, show double sided jets (bottom-right). |
In many aspects the appearance of radio-quiet objects is similar to their radio-loud counterparts. However, extended jet structures are rare and besides the core only some distinct jet components are visible (e.g. Falcke 2001, Nagar et al. 2002, Ulvestad et al. 2005). The appearance of parts of the jet and the observations of multiple bend in the jets of Seyfert galaxies might be explained be the interaction of the jet with NLR or BLR clouds (e.g. Mundell et al. 2003, Middelberg et al. 2007).
A comparison between the VLBI images in
Fig. 6 and the
sketch of an AGN in Fig. 5 is not always
straightforward. The jet in Fig. 6 (top panel)
might be easy to identify, however, the "core" for example does not
correspond to the central engine, but usually marks the transition
region of optically thick to thin emission
(Königl 1981).
Since the location of this transition
zone depends on the observing frequency, the apparent location of the
core moves towards the central engine at higher frequencies, which has
been observed in some sources
(Lobanov 1998b,
Marscher 2005b).
Other possibilities are that the core is a conical "re-collimation"
shock that accelerates particles
(Bogovalov and Tsinganos 2005,
Gomez
et al. 1995,
Daly
and Marscher 1988)
or the jet
initially is not well aligned with the line of sight, but changes its
direction towards the observer so that the beaming factor increases
and the jet becomes visible. The formation of the jet itself takes
place presumably on scales of a few 10 to 1000 Schwarzschild radii
(RS = 2GM / c2). The
Schwarzschild radius of a typical AGN black hole of 108
M is of
the order of 2 AU
(3 × 10¹² m, RS
 3000 m
M /
M).
3000 m
M /
M).
The closest look so far into the central engine of an AGN was obtained
with global VLBI observations of M 87 at 43 GHz and 86 GHz
(Junor et al. 1999,
Krichbaum et al. 2006,
Ly et al. 2007).
M 87
is an E0 galaxy at the centre of the Virgo cluster, and has one of the
nearest extragalactic jets. Together with its large inferred black
hole mass of 3 × 10⁹
M
(e.g.
Macchetto et al. 1997
and references therein), M 87 is an ideal candidate for jet
formation studies. At a distance of 14.7 Mpc, 1 mas corresponds to
a linear scale of 0.071 pc and the Schwarzschild radius of the black
hole is about 60 AU, corresponding to 0.0003 pc. Surprisingly, this
is very similar to the linear resolution in
Sgr A*
9. The observations
revealed that the
jet in M 87 starts fairly broad at an opening angle of
60° on scales < 0.5 mas (0.04 pc), but collimates to about 5°
within the first few parsecs (e.g.,
Ly et al. 2007,
Kovalev et
al. 2007).
Together with the slow proper motion in the parsec-scale jet
(Reid
et al. 1989,
Biretta
et al. 1995),
this supports the idea of a magnetically dominated launching of the jet
with a long collimation and acceleration zone
(Vlahakis and Königl 2004).
In its initial phase (ultra compact jet) the jet is probably dominated by
electromagnetic processes
(Meier
et al. 2001,
Sikora
et al. 2005),
and is visible as the compact VLBI-core where the jet becomes optically
thin for radio emission
(Lobanov 1998b,
Lobanov and Zensus 1999).
Several other VLBI observations made use of the space-VLBI technique to achieve highest angular resolution, and to resolve prominent quasar jets in the transverse direction (e.g. 3C 273: Lobanov and Zensus 2001; 0836+714: Lobanov et al. 2006). This allowed a detailed study of jet propagation and jet internal processes, like i.e. the development of instabilities. In Centaurus A VSOP observations at 5 GHz by Horiuchi et al. (2006) revealed a sub-parsec scale jet-opening and collimation region similar to that observed in M 87 at mm wavelengths (Junor et al. 1999, Krichbaum et al. 2006). Although the resolution was not as high as in the case of M 87 the observations suggested that the jet collimation takes place on scales of a few 10 RS to 1000 RS, which supports MHD disk outflow models (e.g. Meier et al. 2001).
Future space VLBI observations at higher frequencies will provide even higher angular resolution and will probably be able to image the collimation region within 100 RS of the central engine in many more AGN. At 43 GHz, the angular resolution, as it is planed for VSOP 2, will be a few ten micro-arcseconds, closely matching the possible angular resolution of ground based mm-VLBI at 230 GHz. Images obtained at different frequencies and with matched angular resolution, can help to detect spectral and polarization properties of compact regions, which are not observable otherwise (e.g. Gabuzda and Gómez 2001, Papageorgiou et al. 2006, Pushkarev et al. 2005).
An illustration of the structures and emitting regions of the central part of a radio-loud AGN is given in Fig. 7. Observations suggest that the ultra compact jet is dominated by smooth changes in the particle density associated with nuclear flares in the central engine and not with strong shocks (Lobanov 1998a, Lobanov and Zensus 1999). On the other hand parsec-scales shock models (Hughes et al. 1985, Marscher and Gear 1985, Hughes et al. 1989) are able to explain the observed flux density and polarization characteristics of jets (Jorstad et al. 2005, Lister and Homan 2005, Cawthorne 2006). Further evidence for shocks comes from observations of rapid changes of the turnover frequency (frequency at the maximum of the synchrotron spectrum) along the jet (Lobanov 1998a).
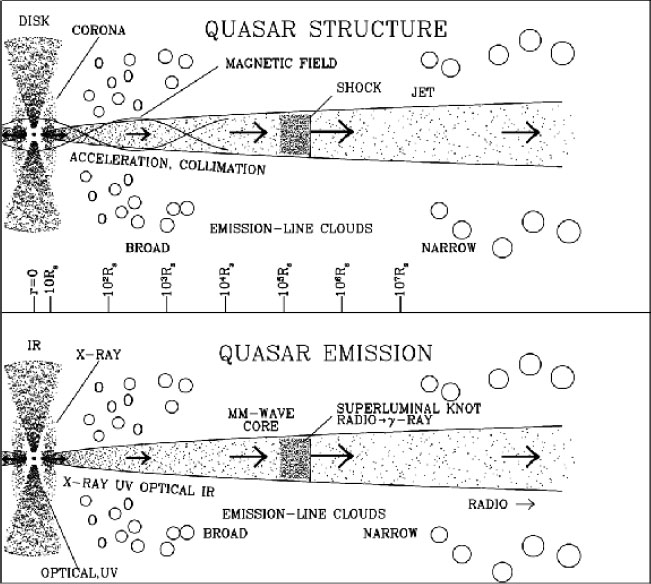 |
Figure 7. Illustration of the central part of a radio-loud AGN. The density of the dots in the disk, corona, and jet very roughly indicates the density of plasma (top panel) or intensity of emission (bottom panel) in a reference frame in which there is no beaming. Note the logarithmic length scale beyond 10 Rs, where Rs is the Schwarzschild radius. Only a single superluminal knot is shown; usually there are several (courtesy Marscher 2005a). |
In several AGN small changes in the jet direction on sub-parsec scales over a period of a few years have been observed (e.g. Biretta et al. 1986, Carrara et al. 1993, Jorstad et al. 2001a, Stirling et al. 2003, Jorstad et al. 2005). For example, global 3 mm VLBI observations of NRAO 150 revealed an apparent rotation of the inner jet at a rate of up to ~ 11° per year, which is associated with a non-ballistic superluminal motion of the jet within this region and probably would have remained undetected at lower resolution (Agudo et al. 2007).
The most common explanation for this phenomenon is a precessing jet,
which could be caused by a binary super-massive black hole system
(Biretta
et al. 1986,
Hummel
et al. 1992).
Although the
observed angles are small (< 10°), which translates to less than
1° when deprojected, the time scale is set by the movement of
some section of the jet that might not itself move with relativistic
velocities. Therefore, the time scale is unaffected by Doppler
blueshifting and can lead to rather extreme physical conditions of the
nuclear region
(Lobanov and
Roland 2005).
The time scale for the precession of a supermassive black hole is of the
order of  104
years and becomes visible on kiloparsec scales
(Gower et
al. 1982).
However on parsec scales hydrodynamic effects also can lead to a
precession of the jet (e.g.
Hughes
et al. 2002,
Hardee
2003).
In this case the
precession may be introduced by a strong shock at the base of the
jet. Observations of more erratic changes in the jet direction
(Jorstad
et al. 2005)
support this idea and indicate that it is
not necessarily a regular periodic process.
104
years and becomes visible on kiloparsec scales
(Gower et
al. 1982).
However on parsec scales hydrodynamic effects also can lead to a
precession of the jet (e.g.
Hughes
et al. 2002,
Hardee
2003).
In this case the
precession may be introduced by a strong shock at the base of the
jet. Observations of more erratic changes in the jet direction
(Jorstad
et al. 2005)
support this idea and indicate that it is
not necessarily a regular periodic process.
Further out, on scales of about > 100 pc, the appearance of the jet becomes more and more dominated by instabilities of the jet flow, most importantly Kelvin-Helmholtz instabilities (Lobanov et al. 2003, Lobanov and Zensus 2001, Perucho et al. 2006, Perucho and Lobanov 2007). Since the jets have steep spectra, high resolution at low frequencies is necessary to successfully model the transverse structures using Kelvin-Helmholtz instabilities. Therefore most of those observations were made at a wavelength of 18 cm with the Space VLBI Program, which combines a world array of radio telescopes with the satellite radio antenna HALCA.
A common method to study the emission processes in the inner jet is
the combined analysis of light curves from radio to X-rays or even
 -rays
with multi-epoch VLBI observations at high frequencies (e.g.
Jorstad
et al. 2001a,
Savolainen et al. 2002,
Bach
et al. 2006b,
Pyatunina et al. 2006,
Jorstad et al. 2007).
The comparison of the broad-band variability with structural changes
in the radio jet allows to directly identify those regions which are
responsible for the variability. The detection of wavelength-dependent
time delays further helps to constrain the distances between the
various emission regions along the jet. In addition, multi-epoch VLBI
observations can be used to measure the jet speed and the source
geometry (see Sect. 3.1.3), and the analysis of linear
polarization provides information on the magnetic field structure (see
Sect. 3.1.6 for more details on VLBI polarimetry).
-rays
with multi-epoch VLBI observations at high frequencies (e.g.
Jorstad
et al. 2001a,
Savolainen et al. 2002,
Bach
et al. 2006b,
Pyatunina et al. 2006,
Jorstad et al. 2007).
The comparison of the broad-band variability with structural changes
in the radio jet allows to directly identify those regions which are
responsible for the variability. The detection of wavelength-dependent
time delays further helps to constrain the distances between the
various emission regions along the jet. In addition, multi-epoch VLBI
observations can be used to measure the jet speed and the source
geometry (see Sect. 3.1.3), and the analysis of linear
polarization provides information on the magnetic field structure (see
Sect. 3.1.6 for more details on VLBI polarimetry).
In more recent observations of 3C 120 the high resolution of global 3 mm VLBI was used in combination with its millimetre-wave continuum spectrum and a computer model to derive the number density of the combined electron-positron population in the core and compact knots in the jet (Marscher et al. 2007). Assuming that the jet contains a pure pair plasma, this density and the efficiency of the eventual annihilation can be used to predict the intensity of the narrow electron-positron annihilation line, which should be detectable with modern high energy satellites.
3.1.3. Brightness temperatures and jet speeds
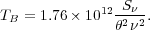
The brightness temperature, Tb, the physical temperature a blackbody would need to have to produce the observed radio flux density, is defined in analogy with the Rayleigh-Jeans Law as:
 |
(6) |
where Tb is given in K, c is the speed of light
in m s-1,
B
is the flux density per unit solid angle,
 , in
W m-2 Hz-1 sr-1,
is the observing frequency
and k the
Boltzmann constant in J/K. To convert Eq. 5 into convenient units,
can be expressed as
the area of a sphere intersected by a cone with
opening angle
, in
W m-2 Hz-1 sr-1,
is the observing frequency
and k the
Boltzmann constant in J/K. To convert Eq. 5 into convenient units,
can be expressed as
the area of a sphere intersected by a cone with
opening angle  , yielding
=
4
, yielding
=
4 sin2( /
4). Using the approximation sin(x)
x for x
<<1 and introducing units of
milli-arcseconds, =
1.846 × 10⁻¹⁷
. Converting
B and
to Jy/beam and GHz,
respectively, yields
sin2( /
4). Using the approximation sin(x)
x for x
<<1 and introducing units of
milli-arcseconds, =
1.846 × 10⁻¹⁷
. Converting
B and
to Jy/beam and GHz,
respectively, yields
 |
(7) |
VLBI core components typically have measured brightness temperatures of 1010 K to 1012 K, which is well above the limit for thermal emission, and indicates a non-thermal origin such as synchrotron emission from relativistic electrons. However, even the brightness temperature for synchrotron radiation has an upper-limit - the Compton limit. Kellermann and Pauliny-Toth (1969) have shown that for brightness temperatures exceeding 1012 K the energy losses due to inverse Compton scattering become dominant and the brightness temperature decreases to values between 1011 K to 1012 K, where inverse Compton and synchrotron losses are of the same order.
Indeed most of early VLBI experiments showed that the brightness
temperatures of nearly all sources falls into the small range of
Tb
1011 K to
Tb
1012 K
(Kellermann and Pauliny-Toth 1969).
However, in the following decades it
became clear that this was a natural consequence of the size of the
Earth (longest possible baseline) and the limited range of flux
densities observed, and had nothing to do with radio source
physics. This is because the resolution of any interferometer is given
by =
 / D where
is the wavelength of
observation, and D is the baseline length. For a typical radio
source with 1 Jy <
S < 10
Jy, and a common baseline length D ~ 5000 km to 8000 km,
Tb will always be
1011 K to 1012 K
(Kellermann 2003).
/ D where
is the wavelength of
observation, and D is the baseline length. For a typical radio
source with 1 Jy <
S < 10
Jy, and a common baseline length D ~ 5000 km to 8000 km,
Tb will always be
1011 K to 1012 K
(Kellermann 2003).
More recent VLBA (Kellermann et al. 1998, Zensus et al. 2002) and space VLBI observations (e.g. Tingay et al. 2001, Horiuchi et al. 2004) suggest that there are sources in which the maximum observed brightness temperature reaches 1013 K or even higher values. In particular IDV sources were found to have considerably higher core brightness temperatures than non-IDV sources (Tingay et al. 2001, Lister et al. 2001), which agrees with the finding that the IDV originates from the VLBI-core component (Bach et al. 2006a). There is evidence that even the majority of the radio-loud AGN have core brightness temperatures above 1012 K (Horiuchi et al. 2004). Conversely, a lower limit of Tb of around 105-6 K is given by the limited sensitivity of today's VLBI observations of a few 10 µJy to 100 µ Jy.
The excess of Tb is usually explained in terms of
relativistic beaming. If the jet is moving relativistically,
relativistic beaming will increase the flux density without changing
the size of the jet, hence it will lead to an apparent increase of
Tb beyond the allowed value, proportional to the Doppler
factor,  :
T'b
Tb with
=
[(1 -
:
T'b
Tb with
=
[(1 -
 cos)]-1,
where
is Lorentz factor of the flow,
is the viewing angle, and
=
v / c is the speed in units of
the speed of light. This concept had already been discovered by
Rees
(1967)
before the first observations of strong variability
(Dent
1965,
Sholomitskii 1965,
Pauliny-Toth and Kellermann 1966)
and superluminal motion in radio jets
(Whitney et al. 1971,
Cohen
et al. 1977)
raised the questions for relativistic beaming. Finally the introduction
of the twin relativistic jet model by
Blandford and Rees (1974)
formulated the observational consequences as:
cos)]-1,
where
is Lorentz factor of the flow,
is the viewing angle, and
=
v / c is the speed in units of
the speed of light. This concept had already been discovered by
Rees
(1967)
before the first observations of strong variability
(Dent
1965,
Sholomitskii 1965,
Pauliny-Toth and Kellermann 1966)
and superluminal motion in radio jets
(Whitney et al. 1971,
Cohen
et al. 1977)
raised the questions for relativistic beaming. Finally the introduction
of the twin relativistic jet model by
Blandford and Rees (1974)
formulated the observational consequences as:
 |
(8) |
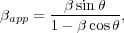
which allows the observer to register superluminal motion in jets if the
intrinsic jet speed,
, is close
to the speed of light and the viewing angle,
,
is small (see Fig. 8). The maximum speed,
app,max =
(2 - 1)1/2, occurs when
cos =
or
sin =
-1. At this angle the Doppler factor is equal
to the Lorentz factor. For the flux density one obtains:
 |
(9) |
where the spectral index
in the exponent
corrects for the
Doppler effect, which causes a frequency shift in the spectrum by the
Doppler factor, . For a
continuous jet the exponent changes to
(2 - ) due to
geometrical considerations
(Scheuer
and Readhead 1979).
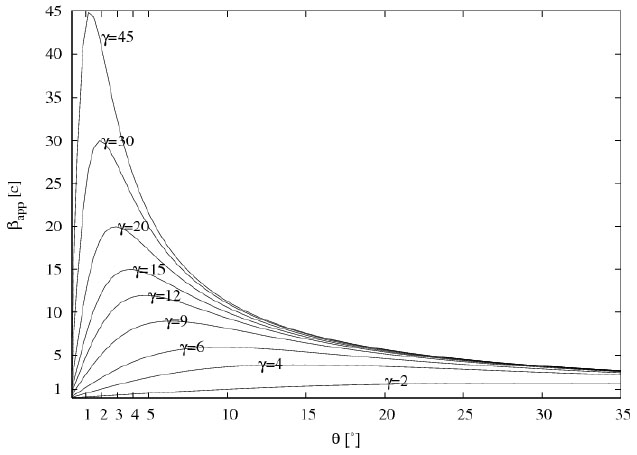 |
Figure 8. Illustration of the dependence of the apparent jet speed from the viewing angle and the intrinsic jet speed. |
Following equipartition arguments, Readhead (1994) found an even lower limit to the brightness temperature. The author states that if there is no large departure between the magnetic and the particle energy (equipartition), then the limiting brightness temperature is 5 × 10¹⁰ K to 1011 K.
Indeed jet speeds of up to 40 times the speed of light, corresponding to
a minimum Lorentz factor of 40, have been measured (e.g.
Jorstad
et al. 2001b,
Piner
et al. 2006).
Studies of the motion of
AGN jet components is one of the main research fields of VLBI. In
Figures 9 and 10 a time
series of VLBA
images taken at 7 mm and the corresponding identification of
superluminal jet components in the jet of the radio galaxy 3C 120 are
shown. Recently, detailed studies of individual sources are
accompanied by large, statistically relevant surveys
(Jorstad
et al. 2001a,
Kellermann et al. 2004,
Lister
2005).
So far, VLBI
at radio frequencies is the only tool to spatially resolve the jets on
parsec scales. Compact interferometers such as the VLA and MERLIN
provide information on kilo-parsec scale jet motion (e.g.
Laing
and Bridle 2002)
and in the optical the Hubble Space Telescope was
used to measure motions in the optical jet of M 87
(Biretta
et al. 1999).
Although the most famous and usually also the
brightest sources are those showing high superluminal motion with
app > 10 c, most of the radio jets
detected display much lower speeds of less then 3 c
(Kellermann et al. 2004,
Lister
2005,
Cohen
et al. 2007).
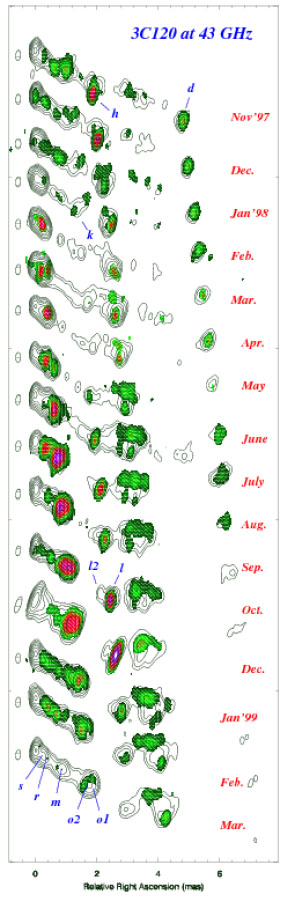 |
Figure 9. Time series of VLBA images of the jet of the radio galaxy 3C 120 showing many details of the structural evolution of the jet. Contours give the total intensity, colours (on a linear scale from green to white) show the polarized intensity, and bars (of unit length) indicate the direction of the magnetic polarization vector. Synthesized beams are plotted to the left of each image, with a typical size of 0.35 × 0.16 mas (courtesy Gómez et al. 2001). |
 |
Figure 10. Projected angular distance from the core as a function of time for the superluminal components in the jet of 3C 120. Those are the components which could be traced over the whole period shown in Fig. 9 (courtesy Gómez et al. 2001). |
This is commonly interpreted as a result of the relativistic beaming model and reflects the fact that the sources are orientated at different angles to the line of sight. However, many of the low-velocity sources are high-power objects like quasars and BL Lac objects. Their rapid variability and high brightness temperatures suggest that the bulk motion of the jet is highly relativistic. Some of them might have very small viewing angles corresponding to the region left of the peaks in Fig. 8, which reduces the apparent speed, but the probability that they are all oriented at very small angles to the line of sight is quite small (e.g. Cohen et al. 2007). It is more likely that the observed speed in those jets does not correspond to the maximum speed of the flow itself. Indeed there are a number of sources where components at different speeds are observed, something which cannot be explained by jet bending or variable Lorentz factors. In several other cases the speeds measured at higher spatial resolution are substantially higher than the measured speeds at lower resolution (e.g. Jorstad et al. 2001a, Kellermann et al. 2004).
For radio galaxies which generally show lower jet speeds increased evidence for structured jets is found. In this case the jet is expected to consist of a fast spine whose radio radiation is beamed away from our line of sight, surrounded by a slower sheath (e.g. Laing et al. 1999, Agudo et al. 2001, Laing and Bridle 2002, Kellermann et al. 2004, Cohen et al. 2007). Seyfert galaxies, which usually display motions of < 0.5 c, are supposed to have initially weaker jets, and they often show signs of interaction with the surrounding medium (e.g. Ulvestad 2003 and references therein). Nevertheless, superluminal motion has been observed in some sources after a bright outburst (e.g. Brunthaler et al. 2000).
3.1.4. The radio-loud / radio-quiet divide
Radio-loud AGN are sources where the ratio of the 5 GHz radio flux density to the optical R-band flux density is of the order of 10 or larger. Sources with lower ratios are called radio quiet. Only about 10% of the AGN population are radio-loud objects, nevertheless, most of the VLBI studies are dealing with those sources. VLA and VLBI observations of radio-quiet sources revealed that their appearance is quite similar to radio-loud objects exhibiting cores, jets, and lobe-like structures, but just a bit weaker (e.g. Kellermann et al. 1994, Ulvestad et al. 2005). Also the spectral characteristics are similar, and variability studies comparing samples of radio-loud and radio-quite objects revealed that the variability time scales are independent of radio luminosity or radio-to-optical flux density ratio. This all leads to the conclusion that the physics of radio emission in the inner regions of all quasars is essentially the same, involving a compact, partially opaque core together with a beamed jet (e.g. Barvainis et al. 2005). The formation of powerful jets might depend on a fine tuning of several parameters like the spin of the black hole, the type of accretion flow, and a favourable magnetic field geometry (e.g. Ballantyne 2007). Currently many authors seem to prefer the spin theory. Wilson and Colbert (1995) suggested that the coalescence of two super-massive black holes (SMBHs) after the merger of two massive galaxies might spin up the black hole so that it can produce a powerful jet. If not the coalescence of SMBHs, at least the merger history of a galaxy seems to play an important role for the radio-loudness (Capetti and Balmaverde 2006). Although they are harder to image radio-quiet quasars provide important information on the launching of jets and are crucial for the development of a unified scheme for active galaxies.
Since the discovery of intraday variability (IDV, i.e. flux density and polarization variations on time scales of less than 2 days) about 20 years ago (Witzel et al. 1986, Heeschen et al. 1987), it has been shown that IDV is a common phenomenon among extra-galactic compact flat-spectrum radio sources. It is detected in a large fraction of this class of objects (e.g. Quirrenbach et al. 1992, Kedziora-Chudczer et al. 2001, Lovell et al. 2003). The occurrence of IDV appears to be correlated with the compactness of the VLBI source structure on milli-arcsecond scales: IDV is more common and more pronounced in objects dominated by a compact VLBI core than in sources that show a prominent VLBI jet (Quirrenbach et al. 1992; see also Lister et al. 2001). In parallel to the variability of the total flux density, variations in the linearly polarized flux density and the polarization angle have been observed in many sources (e.g. Quirrenbach et al. 1989, Kraus et al. 1999a, Kraus et al. 1999b, Kraus et al. 2003, Qian and Zhang 2004). The common explanation for the IDV phenomenon at cm wavelengths is interstellar scattering (e.g. Rickett et al. 1995, Rickett 2001). The most convincing argument for interstellar scintillation comes from observations of time-delays between the IDV pattern from the same source arriving at two widely separated telescopes (Dennett-Thorpe and de Bruyn 2002). Another frequently observed phenomenon is the annual modulation of the variability time scale. This is interpreted in terms of the change of the relative velocity between the scattering screen and the velocity of the Earth as it orbits the Sun (e.g. Rickett et al. 2001, Bignall et al. 2003, Dennett-Thorpe and de Bruyn 2003, Gabányi et al. 2007). However some effects remain that cannot be easily explained by interstellar scintillation and that are probably caused by the relativistic jets. (e.g. Qian et al. 1996, Qian et al. 2002, Qian and Zhang 2004). For example the correlated intra-day variability between radio and optical wavelengths, which is observed in sources such as 0716+714 and 0954+658, suggests that at least part of the observed IDV has a source-intrinsic origin (e.g. Wagner et al. 1990, Quirrenbach et al. 1991, Wagner et al. 1996). Also the recent detection of IDV at millimetre wavelengths in 0716+714 (Krichbaum et al. 2002b, Kraus et al. 2003, Agudo et al. 2006) is a problem for the interpretation of IDV by interstellar scintillation, because scintillation decreases with the square of the observing frequency.
Independent of the physical cause of IDV (source intrinsic, or induced by propagation effects), it is clear that IDV sources must contain one or more ultra-compact emission regions. Using scintillation models, typical source sizes of a few tens of micro-arcseconds have been derived (e.g. Rickett et al. 1995, Dennett-Thorpe and de Bruyn 2002, Bignall et al. 2003). In the case of source-intrinsic variability and when using arguments of light travel times, even smaller source sizes of a few micro-arcseconds are obtained. Then apparent brightness temperatures of up to 1018-19 K (in exceptional cases up to 1021 K) are inferred, far in excess of the inverse Compton limit of 1012 K. These high brightness temperatures can be reduced by relativistic beaming with high Doppler-factors (e.g. Qian et al. 1991, Qian et al. 1996, Kellermann 2002). It is currently unclear if Doppler-factors larger than 50 to 100 are possible in compact extragalactic radio sources (see Sect. 3.1.3 for more details on observed jet speeds). Space VLBI observations revealed that the variability in 0716+714 originates from the core, but the core itself remains unresolved and no structural changes were observed on short time scales (Bach et al. 2006a). However, future space VLBI missions or millimetre VLBI should be able to resolve the inner structures and shed more light on the very compact regions of IDV sources.
3.1.6. Polarization in AGN jets
In the commonly accepted picture where accretion onto a black hole powers the AGN, it is believed that the jet is driven outwards via magnetic forces. The poloidal magnetic field is wound up by the accretion disk or the ergosphere of the black hole and therewith accelerates and collimates the jet (e.g. Meier et al. 2001). Therefore important information about the physical properties of the jet are provided by the order and the geometry of the magnetic field. Since the emission process in the radio band is synchrotron radiation, the most direct way to investigate magnetic fields is to study the linear polarization of jets. The first studies of linear polarization using VLBI observations were already performed more than 20 years ago (Cotton et al. 1984). More recent studies dealing with larger samples of AGN have dramatically increased our knowledge about the linear polarization properties of the various types of AGN (e.g. Cawthorne et al. 1993, Gabuzda and Cawthorne 1996, Gabuzda et al. 2000, Lister and Smith 2000, Marscher et al. 2002, Pollack et al. 2003, Lister and Homan 2005, Jorstad et al. 2007). The degree of linear polarization of the VLBI core of a typical radio-loud AGN is usually below 5%, because the core region is optically thick and the maximum expected degree of linear polarization for such a region is 10%. In the optically thin regime, where most of the emitted synchrotron photons can escape from the source without being absorbed, the maximum degree can reach 75% (Burn 1966). Indeed the observed degree of linear polarization in the jet reaches up to 50%, confirming its origin to be optically thin synchrotron emission (e.g. Lister and Homan 2005). Usually the linear polarization in the jet is enhanced at the position of bright jet components (see also Fig. 9) suggesting the existence of shocks that increase the order of the magnetic field (e.g. Lister and Smith 2000).
At the transition from optically thick to thin synchrotron emission
the polarization angle is supposed to rotate by 90°. This was
observed in a number of sources at lower frequencies (e.g. OJ287
Gabuzda
and Gómez 2001).
The difficulty here and for the
measurement of the electric vector position angle (EVPA) in general is
that the radio polarization angle can be affected by Faraday rotation
(Faraday
1933).
This is a rotation of the EVPA which occurs when a
linearly polarised electromagnetic wave travels through a region with
free electrons and a magnetic field with a non-zero component along
the line of sight. The intrinsic polarization angle
 0
is related to the observed polarization angle
by
0
is related to the observed polarization angle
by
 |
(10) |
where is the observed
wavelength and RM is the rotation measure. The linear relationship to
2 is the
characteristic
signature of Faraday rotation. The rotation measure depends linearly
on the electron density, ne, the component of the magnetic
field parallel to the line of sight,
B||, and the path
length, l, through the plasma. Using units of m-3,
Tesla, and parsec, the rotation measure can be expressed as
 |
(11) |
The RM can be determined using simultaneous multi-frequency observations, which then allow the recovery of the intrinsic polarization orientation.
Zavala and Taylor (2003), Zavala and Taylor (2004) have conducted an RM study of about 40 AGN. The authors found that the cores of quasars have typical RMs of approximately 500 rad m-2 to several 1000 rad m-2 within 10 pc of the core. Jet RMs are typically 500 rad m-2 or less. The cores and the jets of the seven BL Lac objects have RMs comparable to those of quasar jets. Radio galaxies were usually found to have depolarized cores and exhibit RMs in their jets varying from a few hundred to 10000 rad m-2. A gradient in the foreground Faraday screen is invoked to explain the observed depolarization properties of the sample. The Faraday screen is likely located close to the relativistic jet, although its exact nature remains unclear. The line-of-sight magnetic fields inferred from the observation range from 10 pT to 60 pT in jets and to 100 pT in quasar cores.
The cores of quasars show higher RMs than BL Lac objects, but, conversely, show lower degrees of linear polarization (e.g. Lister and Homan 2005). A possible explanation is that at least part of the missing linear polarization in quasars is removed by Faraday depolarization, where the propagation of emission through different patches of a turbulent plasma produces stochastic Faraday rotation, which leads to an overall reduction of the observed linearly polarized component. Also the absence of linear polarization in radio galaxies might be attributed to Faraday depolarization. Since radio galaxy jets are often observed in the plane of the sky the cores are seen through the dense environment surrounding the core region (Zavala and Taylor 2004).
When corrected for the rotation measure the EVPA can give an estimate for the orientation of the magnetic field in the jet. It turns out that BL Lac objects tend to have EVPAs parallel to the jet direction, but for quasars the correlation is not that obvious (e.g. Cawthorne et al. 1993, Gabuzda et al. 2000, Pollack et al. 2003). For optically thin emission this means that the magnetic field is orientated transverse to the jet direction. Initially this was interpreted as evidence for transverse shocks which enhance the magnetic field component in this direction (e.g. Hughes et al. 1989). However, the effect can also be explained in terms of helical magnetic field structures, which are likely to be present in the inner jet (Lyutikov et al. 2005). Larger statistics and the correlation with properties from other wavelengths appear to be the methods that will help to disentangle the different effects (e.g. Lister and Homan 2005, Jorstad et al. 2007).
Another option to probe the particle population and magnetic field structure of the jets are studies of circular polarization (CP) on parsec scales. Early single dish observations showed that only marginal circular polarization (< 0.1%) is present in AGN jets (Weiler and de Pater 1983, Komesaroff et al. 1984). Interferometric studies, however, detected CP in the cores of a number of sources (Wardle et al. 1998, Homan and Wardle 1999, Homan et al. 2001, Homan and Wardle 2003, Homan and Wardle 2004). A recent VLBI survey revealed circular polarization in the cores of 20 of a total of 133 observed AGN (Homan and Lister 2006). In two sources CP emission was detected also from separated jet components. Compared to the integrated values measured from single dish observations, VLBI images show higher levels of CP. About 15% of the cores have more than 0.3% of circular polarization and 0.3% to 0.5% were found in jet components. Circular polarization can be produced in two ways: as an intrinsic component of the emitted synchrotron radiation or via Faraday conversion of linear to circular polarization (Jones and O'dell 1977). The current statistics are not sufficient to determine the origin of CP, but when the intrinsic mechanism dominates, jets must be a predominantly electron-proton plasma and must contain a significant fraction of unidirectional ordered magnetic field. If the conversion mechanism dominates, circular polarization determines the low-energy end of the relativistic particle distribution (e.g. Wardle and Homan 2003), a key parameter in studying the bulk kinetic luminosity of AGN jets and their particle content (Celotti and Fabian 1993, Wardle et al. 1998). Since the composition of jets is one of the fundamental question in AGN research a lot of effort is currently put into the accurate determination of circular polarization in jets.
3.1.7. VLBI observations of circumnuclear tori
The previous sections have shown that AGN whose radio axes are close to the plane of the sky are the more difficult objects to study, because their jets are weaker, i.e. are less beamed, have low degrees of polarization and the central engine is highly obscured, which decreases the amount of additional information from optical and infrared wavelengths. However, in the radio, the obscuring material can be used to study the circumnuclear structures. There are mainly three observational methods: (i) molecular gas seen either masing (so far only water masers at 1.3 cm have been detected in AGN) or in absorption, (ii) atomic gas seen in absorption, and (iii) ionised gas revealed through free-free absorption.
Water masers are found predominantly in Seyfert 2 or LINER galaxies and are currently the only resolvable tracers of warm dense molecular gas in the inner parsec of AGN (e.g. Braatz et al. 1996, Braatz et al. 2004, Hagiwara et al. 2002, Greenhill et al. 2003b, Henkel et al. 2005, Kondratko et al. 2006, Zhang et al. 2006) Because they are associated with nuclear activity, the most likely model for exciting the maser emission is X-ray irradiation of molecular gas by the central engine (e.g. Neufeld et al. 1994). In Mrk 348 the masers are located close to the receding jet, suggesting that the masers are likely to arise from the shock in front of the jet, rather than from continuum emission (Peck et al. 2003). About 60 AGN harbouring water masers are known up to date, but not all of them are bright enough to be observed with VLBI. The most relevant are NGC 4258 (Miyoshi et al. 1995), NGC 1386 (Braatz et al. 1997), NGC 4945 (Greenhill et al. 1997), NGC 1068 (Greenhill and Gwinn 1997), NGC 3079 (Kondratko et al. 2005, Middelberg et al. 2007), IC 2560 (Ishihara et al. 2001), and Circinus (Greenhill et al. 2003a). In these objects the maser emission appears to trace a nearly edge-on disk of molecular gas at distances of 0.1 pc to 1 pc from the supermassive black hole, which is supposed to be directly connected to the accretion disk.
 |
Figure 11. Top: Warped-disk model for the accretion disc in NGC 4258 with masers and continuum emission superposed. Bottom: Total power spectrum of the NGC 4258 maser, with best-fitting Keplerian rotation curve in the inset. Reprinted by permission from Nature (Herrnstein et al. 1999), copyright (1999) Macmillan Publishers Ltd. |
The modelling of such maser sources can be used to determine parsec-scale accretion disk structures and to accurately estimate black hole masses (Greenhill and Gwinn 1997, Greenhill et al. 2003a, Herrnstein et al. 2005). Figure 11 shows the maser found in NGC 4258, which can be well fitted by a Keplerian rotation curve. When combined with the masers' proper motion or drifts in the line-of-sight velocities of spectral features (i.e., centripetal acceleration), those models can provide independent distance measurements to the galaxies and therewith even provide constraints for H0 (Herrnstein et al. 1999). A recent VLBI study aims to measure the distance to the LINER NGC 4258 with an error of only 3% and, since the galaxy also contains Cepheid variable stars, will allow a direct comparison of the maser and Cepheid distances (Argon et al. 2007).
Evidence of a circumnuclear torus of atomic gas has been seen in Cygnus A (Conway 1999a), NGC 4151 (Mundell et al. 1995) and 1946+708 (Peck et al. 1999) and many young compact sources (e.g. Readhead et al. 1996, Vermeulen et al. 2003). In Cygnus A, H I absorption measurements with the VLBA indicate a torus with a radius of about 50 pc (Fig. 12). In NGC 4151, H I absorption measurements using MERLIN indicate a torus ~ 70 pc in radius and ~ 50 pc in height. One of the best examples of this type of torus is the Compact Symmetric Object (CSO) 1946+708. The H I absorption is found in front of all of the ~ 100 pc of its continuum emission, and the line widths, velocities and H I optical depth distribution are consistent with the scenario of a thick torus, consisting predominantly of atomic gas (Peck et al. 1999, Peck and Taylor 2001).
 |
Figure 12. Left: Total intensity contours of the jet of Cygnus A with the H I opacity in greyscale (courtesy Conway 1999b). Right: The H I absorption is interpreted as the signature of a surrounding torus (courtesy Conway 1999a). |
Because radio galaxies often have weak cores and jets, studies of circumnuclear tori can only be carried out for sources with compact jets. One of the less powerful cases is the galaxy NGC 4261, where VLBI observations of H I absorption revealed the existence of a thin disk seen in projection against the counter-jet (van Langevelde et al. 2000). This shows that there are differences in the nuclear torus/disk system, which are important parameters for our understanding of AGN. Therefore this is one of the science drivers for more sensitive instruments like the SKA.
Parsec-scale radio counter-jets are important for studying the intrinsic symmetry of the jet-formation process, and are probes of the structure of ionised gas in the central parsec of AGN. The latter case becomes noticeable as free-free absorption in front of the counter-jet. If geometrically thin, the disk will cover only the inner part of the counter-jet but not the approaching jet. If geometrically thick, the core and perhaps the base of the approaching jet may also be absorbed. Multi-frequency observations can detect the highly inverted spectrum created by free-free absorption. This has been found in a number of cases. For example in 3C 84 (Walker et al. 2000) and in the aforementioned case of NGC 4261 (Jones et al. 2001) where H I absorption as well as free-free absorption has been found.
In the FR II radio galaxy Cygnus A multi-frequency VLBI observations revealed a deep gap between the core and the counter-jet at lower frequencies, which changes to an inverted spectrum at high frequencies (Krichbaum et al. 1998a, Bach et al. 2005). Since H I absorption was found at the base of the counter-jet (Fig. 12, Conway 1999a) the gap most likely indicates free-free absorption.
The compact radio source at the centre of the Milky Way was found by
Balick and Brown (1974)
and was named Sagittarius A* (Sgr A*,
Brown
1982)
to distinguish it from the larger-scale
galactic region Sgr A. A comprehensive review on the galactic centre
and Sgr A* was recently given by
Melia
and Falcke (2001).
The association with a supermassive black hole had already been suggested
before its discovery by
Lynden-Bell and Rees (1971),
and was
subsequently supported by a number of observations, e.g, by proper
motion measurements of stars in the vicinity of the galactic centre
(Eckart
and Genzel 1996,
Eckart
and Genzel 1997,
Ghez
et al. 1998)
and from size estimates from VLBI observations (e.g.
Rogers
et al. 1994,
Krichbaum et al. 1998b,
Doeleman et al. 2001,
Bower
et al. 2004,
Shen
et al. 2005,
Bower
et al. 2006).
Because of the proximity of Sgr A* high-resolution VLBI images
provide a very high linear resolution. Adopting a distance of 8 kpc
and a mass of 4 × 10⁶
M
(Eisenhauer et al. 2003,
Ghez
et al. 2005),
0.1 mas correspond
to 10 RS (Schwarzschild radii, 1RS =
1.2 × 1012 cm). VLBI observations of Sgr A* can
therefore help to distinguish between the many different models for
the emission, accretion, and outflow physics of the source, as well as
provide an important test of strong-field gravity (e.g.
Falcke
et al. 2000).
The main problem in determining the size of Sgr A* is that
its true structure is
affected by scattering in the interstellar medium, leading to a
2
dependence of its diameter as a function of the observed wavelength. Up
to 43 GHz
this results in an elliptical profile orientated at an angle of ~ 80°,
the axes of which follow
min = 0.76
mas ( /
cm)2 and
max
= 1.42 mas ( /
cm)2
(Lo
et al. 1998).
At 43 GHz and higher frequencies there is growing evidence that the
intrinsic source size becomes visible (e.g.
Rogers
et al. 1994,
Krichbaum et al. 1998b,
Doeleman et al. 2001,
Krichbaum et al. 2006).
More recent efforts using the technique of closure amplitudes (e.g. Doeleman et al. 2001), which reduces sensitivity but removes uncertainties due to calibration errors, have resulted in a more robust detection of the intrinsic source size of Sgr *. Bower et al. (2004), Bower et al. (2006) and Shen et al. (2005) determined diameters of ~ 10 RS to ~ 13 RS at 86 GHz, which is consistent with an estimate of 11 ± 6 RS from earlier VLBI measurements at 215 GHz (Krichbaum et al. 1998b, Krichbaum et al. 2006). The peak brightness temperature was estimated to be 1010 K at 86 GHz, which mainly excludes advection-dominated accretion flows (Narayan et al. 1998) and Bondi-Hoyle accretion models (Melia 1994). Because of the limited sensitivity in the minor axis size of the scattering ellipse the current measurements are not able to distinguish between jet models (Falcke et al. 1993), generic radiatively inefficient accretion flows (Quataert and Gruzinov 2000), and hybrids of these models (Yuan et al. 2002). Future arrays including telescopes such as the Large Mexican Telescope (LMT), APEX, and ALMA, which provide a better uv-coverage and increased performance at frequencies above 90 GHz will put further constrains on the minor axis and might be able to image the shadow of the black hole itself (e.g. Falcke et al. 2000).
Stars are not the primary targets for VLBI observations, because their brightness temperatures (103 K to 104 K) are much less than those required for VLBI detections (106 K). Nevertheless, observations of phenomena associated with stars can be made in a few cases, which will be reviewed in this section.
3.2.1. Circumstellar disks and envelopes
Mira-type variable stars are frequent targets of VLBI observations. Mira stars have a few solar masses and have reached the end of their lives where the outer envelopes become very extended. The envelope becomes cool enough for molecules to form, and hence maser emission can be observed in these objects.
One of the best-studied Mira stars is TX Cam, the SiO v = 1, J = 1-0 maser emission of which has been observed by Diamond and Kemball (2003) over a period of almost two years, corresponding to a full pulsation period. When combined into a movie 10, the 44 images, showing the ring-like maser emission of TX Cam in biweekly intervals, are a fascinating documentary of the evolution of a star. It was found that the shell from which the emission arises is mostly non-symmetric, and that gas on outward trajectories shows evidence for gravitational deceleration. Further observations by Yi et al. (2005) indicated that the red- and blueshifted masers were evenly distributed around the star, indicating that it is not rotating.
Polarimetric observations of SiO masers in Mira, U Ori, and R Aqr reported by Cotton et al. (2006) indicate that masing material is being dragged by magnetic fields in the star. Furthermore, the authors report possible rotation for only Mira, though this finding could be affected by Mira's binary companion.
The envelopes of evolved stars can be observed also using H2O masers. In particular, Vlemmings et al. (2002) and Vlemmings et al. (2005) report measurements of circular polarization of H2O masers in evolved stars to determine stellar magnetic fields via the Zeeman effect. They report magnetic field strengths of several hundred milligauss to one gauss, and have modelled the stellar magnetic fields as dipoles (Figure 13).
 |
Figure 13. A sketch of the dipole magnetic field in VX Sgr as derived from H2O maser observations by Vlemmings et al. (2005). The left panel shows the magnetic field orientation (positive or negative) and the symbol sizes scale with the magnetic field strength. The right panel shows the velocity distribution of the maser features, showing red- and blueshifted components. Symbol sizes indicate the velocity difference. Reproduced with kind permission of the author. |
OH masers trace gas with much lower densities than SiO and H2O masers. Claussen et al. (1999) and Hoffman et al. (2005) report VLBI detections of OH masers in, e.g., W28, which Hoffman et al. (2005) ascribe to the interface between the supernova remnant and a molecular cloud. From Zeeman splitting they infer magnetic fields of the order of one milligauss in W28.
At the other end of stellar life cycles, maser observations can yield information about star formation. Magnetic fields are thought to play important roles in the formation of massive stars, and have consequently been observed via polarimetric VLBI observations of H2O masers, e.g., in Cepheus A (Vlemmings et al. 2006b), W51 M (Leppänen et al. 1998), and Orion KL and W3 IRS 5 (Imai et al. 2003).
It has been postulated that magnetic fields confine jets of evolved stars. This could explain the asymmetric shapes of planetary nebulae, the remnants of stars. Vlemmings et al. (2006a) present evidence for magnetic confinement of the jet of W43A, using polarimetric VLBI observations of its H2O maser emission.
Some supernovae have brightness temperatures high enough for their continuum emission to be detected with VLBI arrays. Almost all of these are core-collapse supernovae of Types II and Ib/c. They give astronomers the unique opportunity to observe the geometric evolution of supernovae, and some remarkable observations have been carried out in the last few years.
The most prominent supernova that has been studied with VLBI probably is SN 1993J in the nearby galaxy M 81. Marcaide et al. (1993) discovered early on that the supernova could be detected on intercontinental baselines and began a monitoring campaign. Marcaide et al. (1995a) found that the supernova had a shell-like structure and Marcaide et al. (1995b) found the shell to expand symmetrically, indicating that the shell was expanding into a homogeneous medium. Hints of deceleration were reported in 1997 by Marcaide et al. (1997) and were confirmed by Bartel et al. (2000), who had monitored SN 1993J at regular intervals with the VLBA since the explosion. Bartel et al. (2000) also found that the deceleration of the expansion could not be explained with the "standard" model by Chevalier (1982). They inferred from the progress of deceleration that SN 1993J had left the phase of free expansion and had entered a phase of adiabatic expansion, which is dominated by the swept-up circumstellar material.
VLBI observations have recently also been used to search for supernovae. Though not all attempts have been fruitful (Ulvestad et al. 2007), sometimes interesting serendipitous discoveries are made (Neff et al. 2004). In star-forming galaxies, the densities of massive stars, and consequently the rate of supernovae, is so high that explosions can be observed on time scales of years. Lonsdale et al. (2006) have observed the prototypical ultra-luminous infrared galaxy Arp 220 with a very sensitive global VLBI array, and discovered 49 point-like sources which they identified as predominantly young supernovae. Comparing their observations to images made 12 months earlier they were able to identify four supernovae which had exploded in the time between the observations. Comparing their findings to the luminosities of supernovae in the nearby star-forming galaxy M 82, they confirm that the star formation in Arp 220 is like that in M 82 but scaled up by a factor of a few tens.
X-ray binaries (XRBs) are thought to consist of a compact star (a neutron star or a black hole), and a donor star from which matter is transferred onto the compact companion. Some XRBs exhibit radio emission and, because the accretion and emission mechanisms are thought to be similar to those in quasars, XRBs are sometimes called microquasars.
The properties of XRBs, when compared to quasars, scale very roughly with luminosity, and this is also true for the time scales on which they evolve. XRBs are variable on time scales of days, or even hours. Fomalont et al. (2001) demonstrated this very clearly on Sco X-1, observing the object continuously for more than two days, using three VLBI arrays 11. Their images show a two-sided structure with radio-emitting components moving away from a central radio component as the observation progressed. The components ejected from the nucleus travelled at approximately half the speed of light. VLBI observations of the microquasar GRS 1915+105 by Dhawan et al. (2000) had already found speeds in excess of the speed of light, which arose from a projection effect and is common in observations of AGN jets. Similarly, Miller-Jones et al. (2004) find that Cyg X-1 displays a two-sided jet morphology with mildly relativistic speeds. Another instructive movie, made from daily VLBA 1.5 GHz snapshots over the course of six weeks, shows the microquasar SS 433 12 (Mioduszewski et al. 2004). The observations showed that the jet ejecta brighten at specific distances from the nucleus, but only at certain times in the 164-day precession period of the accretion disk, indicating a non-symmetric obstacle with which the jet collides.
VLBI observations have recently helped to determine the nature of the XRB LS I +61 303. It had been debated whether the emission is microquasar-like or due to a pulsar wind nebula (an illustration of these competing models can be found in Mirabel 2006). The morphology of the mas-scale radio emission, monitored over one orbital period of the binary by Dhawan and Rupen (2006), indicates that the radio emission is due to a pulsar wind nebula; the emission has a cometary appearance and points away from the high-mass companion throughout the orbit of the neutron star.
3.3. Results from astrometric observations
VLBI observations not only provide extremely high resolution but can also yield very accurate measurements of the positions of radio sources. In this section we describe recent results from VLBI observations where the positional accuracy was essential.
Assigning a coordinate to a celestial object is not trivial. The earth rotates, precesses and nutates, its surface changes via tectonic plate motions, its angular velocity decelerates as a result of tidal friction due to the moon's orbit, and the solar system rotates around the Galactic centre at a speed of 220 km s-1. Furthermore, planets, stars and other celestial bodies have proper motions and change their appearances and shapes, even on time scales of years or less. Hence it is important to have a coordinate system (a reference system) that is tied to celestial phenomena that change as little as possible (a reference frame, which is an implementation of the reference system), and which can be defined as accurately as possible. The current reference frame adopted by the International Astronomical Union is the International Celestial Reference Frame, or ICRF (Ma et al. 1998), which is based on VLBI observations of point-like, strong, distant quasars. This reference frame satisfies the two aforementioned requirements: quasars are very distant and are not connected with one another in any way, hence no rotation is expected, and their positions can be observed with very high accuracy. Previous reference frames such as the "Fifth Fundamental Catalogue" (Fricke et al. 1988) had been established by observations of several thousand stars and had accuracies of the order of tens of mas. Stars, however, have detectable proper motions and are gravitationally bound in the Milky Way, and the accuracy of their position measurements are much lower than those of typical VLBI observations. The 212 "defining" sources in the ICRF have typical position errors of 0.4 mas, and the orientation of the axis defined from this set of sources has an accuracy of 0.02 mas. A complication with using VLBI observations of quasars though is that radio jets structures are subject to changes, which needs to be taken into account for these measurements. A good review about reference systems, reference frames and the implementation of the ICRF can be found in Feissel and Mignard (1998). Another application of astrometric observations is to calibrate Global Positioning System (GPS) measurements. Some VLBI stations are outfitted with GPS receivers, the positions of which are determined using astrometric observations. The same GPS receivers are then used to determine errors in the orbits of GPS satellites.
Lestrade et al. (1999) have carried out VLBI observations of 11 radio-emitting stars to tie the Hipparcos reference frame to the ICRF. In addition to the Hipparcos link, these observations also had astrophysical implications for the observed stars. For example, they found that the binary UX Ari exhibits significant acceleration, which could be caused by a yet unknown companion.
3.3.2. Distances and proper motions of stars and masers in the Milky Way
Stars can be observed only if they emit non-thermal radiation, which is typically the case for T Tauri stars. Torres et al. (2007) report on VLBI observations of Hubble 4 and HDE 283572, two T Tauri stars in the Taurus association. They infer distances of (132.8 ± 0.5) pc and (128.5 ± 0.6) pc, respectively, which is an order of magnitude more accurate than other distance measurements. In a companion paper, Loinard et al. (2007) report a similar measurement for T Tauri itself.
Sandstrom et al. (2007) present a similar measurement for the star GMR A in the Orion Nebula Cluster. They find a distance of (389-21+24) pc, in disagreement with the hitherto canonical value of (480 ± 80) pc reported by Genzel et al. (1981). Placing the Orion cluster at a distance 20% smaller than previously thought implies that the luminosities of stars stars within it are lower by a factor of 1.5 - and that the stars are almost twice as old, since age scales as luminosity to the -3/2 power.
As was mentioned in the overview of the world's VLBI arrays, Japan has built a four-station network specifically for precise astrometry of Galactic masers, and first results are beginning to be published: Hirota et al. (2007b) report VLBI observations of the water maser emission from Orion KL over two years, from which they derive a trigonometric distance of (437 ± 19) pc. This measurement is difficult to reconcile with the result reported by Sandstrom et al. (2007) - which is the correct value time will show. In two other papers, Hirota et al. (2007a) report a similar measurement of the distance to the young stellar object SVS 13 in NGC 1333, and Honma et al. (2007) have measured the distance to the star-forming region Sharpless 269, finding a value of (5.28-0.22+0.24) kpc (or a parallax of 189 ± 8 µas), which they claim is the smallest parallax ever measured (and indeed is more precise than the parallax of Sco X-1 measured by Bradshaw et al. (1999), who obtained (360 ± 40) µas and had once claimed the record).
Focussing on distances to evolved stars, Vlemmings and van Langevelde (2007) have observed the OH maser transition at 1.6 GHz in the envelopes of S CrB, RR Aql, and U Her. Their measurements have accuracies of 4% to 34%, which is a vast improvement over older Hipparcos measurements, with errors of 50% to 100%.
3.3.3. Distances and proper motions of pulsars
The only model-independent method to determine the distance to a celestial object is the trigonometric parallax. From optical observations, parallaxes can be obtained only for close objects. Remember that the positional accuracy of optical observations is limited to about 0.1" and therefore parallaxes can be measured for objects within only 10 pc. VLBI observations, however, can yield positions as good as 0.1 mas and so one can measure parallaxes of objects at a distance of up to 10 kpc. Pulsars are among those few objects that have brightness temperatures high enough for VLBI observations and it is known that they are point sources (this is even true for VLBI observations). Parallax measurements can therefore yield distances to pulsars in large portions of the Milky Way and help to calibrate the distance scale derived from the pulse dispersion measurements obtained from single-dish observations.
Only a handful of pulsar parallaxes had been measured until 2000 (for a list and references see Table 1 in Brisken et al. 2002). This has changed in the last few years, and many more measurements are now becoming available (e.g., Brisken et al. 2002, Dodson et al. 2003, Chatterjee et al. 2005, and Helfand et al. 2007). These observations not only added to the number of trigonometric parallaxes, but also yielded pulsar proper motions (transverse to the line of sight). Proper motion measurements allow one to determine the likely birth places, as done by Ng et al. (2007), help to constrain velocities derived from pulsar timing, or, in some cases, are the only available velocity measurements when pulsar timing is not possible (e.g., Dodson et al. 2003).
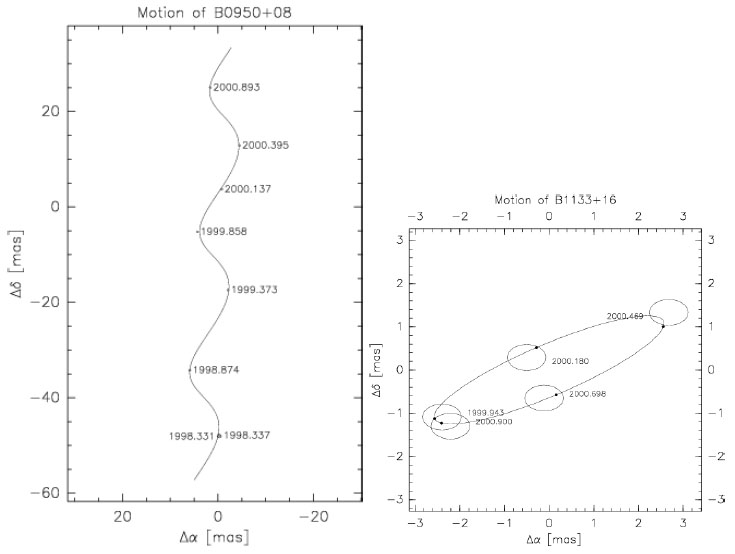 |
Figure 14. Illustration of the combination of proper motion and parallax motion of pulsars observed with VLBI (Brisken et al. 2002). The left panel shows the observed locations of the pulsar B0950+08 over the course of 2.5 yr. The track is a combination of the pulsar's proper motion and the earth's rotation around the sun. To indicate the significance of such parallax measurements, the modelled proper motion of the pulsar B1133+18 has been subtracted in the right panel, clearly showing the annual parallax (the small ellipses indicate the position errors). Reproduced with kind permission of the author. |
3.3.4. Proper motions of galaxies in the Local Group
Measurements of the proper motions in the Local Group certainly is not a widely spread application of VLBI observations, but it illustrates the potential of high-precision position measurements.
Brunthaler et al. (2005) used the VLBA to monitor water masers in M 33 over more than 4 yr. They were able to detect proper motion of 36 µas yr-1 in right ascension and 13 µas yr-1 in declination. Comparing these measurements to rotation models of M 33 based on measurements of neutral hydrogen, they were able to infer a geometric distance to M 33 of (730 ± 168) kpc. Together with similar measurements in the nearby galaxy IC 10 (Brunthaler et al. 2007), a picture of the dynamics in the Local Group begins to emerge (Fig. 15 and Loeb et al. 2005).
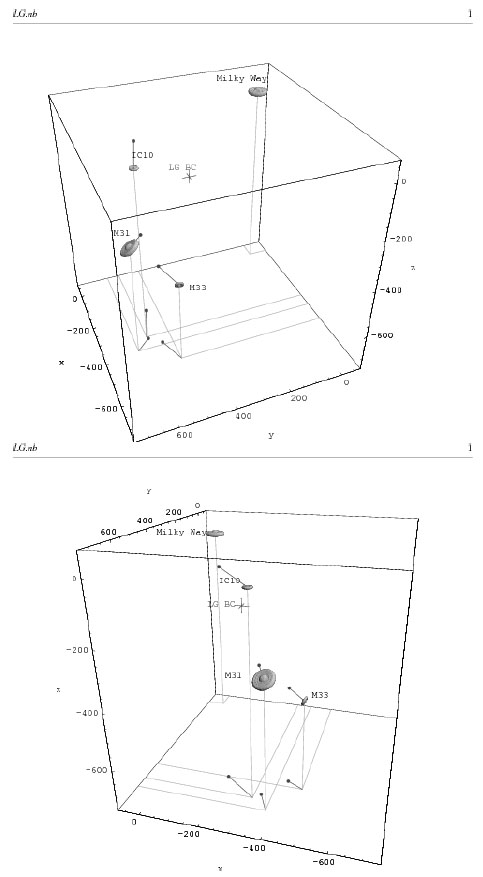 |
Figure 15. The relative positions and velocities of galaxies in the Local Group as determined by Brunthaler et al. 2005. Reproduced with kind permission of the author. |
Gravitational lenses in which the emission of a distant quasar is deflected by a foreground galaxy, producing multiple images extended over a few arcseconds, are obvious VLBI targets. High-resolution observations yield accurate separation measurements and can confirm that images belong to a lens because they have the same spectral indices, surface brightness, or degree of polarization. If the lensed object has sub-structure such as jets, then it becomes possible to investigate sub-structures in the lens galaxy.
For example, Bradac et al. (2002) have observed the lens system B1422+231 and are able to produce a reasonable model for the lens only when substructure is included (that is, they were unable to model the lens with a simple ellipsoid). Substructure in the lens can also be inferred from asymmetries in the lensed images, as has been tentatively found in B1152+199 by Rusin et al. (2002). Biggs and Browne (2002) report VLBI observations of B0128+437, and they speculate that the lens could have a halo of intermediate-mass black holes ("milli-lensing"). Finding substructure in the haloes of lensing galaxies may yield clues about large-scale structure formation, driven by a lack of halo dwarf galaxies in the Local Group.
Koopmans et al. (2002) and Porcas et al. (2002) present VLBI observations of MG 2016+112, in which one image of the background source is extremely stretched. This is interpreted as the radio jet of the lensed quasar crossing the caustic of the lens, leading to extreme magnification. Koopmans et al. (2002) speculate that with such high magnification one might be able to observe hyper-luminal motion of the order of (102 to 103) c.
Gravitational lenses offer the exciting opportunity to obtain a value for H0, using relatively simple astrophysics (Refsdal 1964). However, to constrain H0 requires one to use a model of the mass distribution in the lensing object, which is mostly difficult to obtain (see Schechter 2005 for a review of the associated difficulties). Nevertheless, York et al. (2005) present an estimate from observations of CLASS B0218+357 with radio interferometers on all scales and Hubble Space Telescope observations. They derive values of (70 ± 5) km s-1 Mpc-1 and (61 ± 7) km s-1 Mpc-1, depending on the treatment of the lensing galaxy.
We refer the reader to the reviews by Porcas (2004) and Biggs (2005) for more information about gravitational lenses and VLBI.
3.3.6. Measurement of the speed of gravity waves
General relativity predicts that light is deflected by matter, something which had been measured for the first time by Dyson et al. (1920), who were able to measure the deflection of a star near the sun during a solar eclipse. In 2002 Fomalont and Kopeikin (2003) have carried out an experiment to measure the deflection of the light of a quasar as Jupiter passed within 3.7', by monitoring the position of the quasar relative to two other quasars over eight days with an accuracy of less than 10 µas. They were able not only to measure the effects of Jupiter's mass, but also those of Jupiter's velocity. The observed deflection matched the predictions from General Relativity, but a controversy emerged over whether the result depends on the speed of gravity waves, cg, or the speed of light, c (Carlip (2004, 2005), Kopeikin 2005).
In 2005, a global VLBI array has been used to carry out a unique experiment. The Cassini spacecraft, exploring Saturn, launched a probe called Huygens onto Saturn's moon Titan. The goal was to measure parameters like temperature, pressure, and wind speeds as the probe would descent towards Titan's surface, hanging from a parachute. The winds were to be measured using Doppler measurements in the radio signal from Huygens to Cassini (the so called Doppler Wind Experiment, DWE), the only communication link from the Titan probe. Unfortunately, one of Cassini's receivers failed, resulting in the potential loss of the DWE data transmitted by Huygens. The solution of this problem was to measure Huygens' path and horizontal velocity in the atmosphere by tracking, or rather eavesdropping on, its uplink to Cassini with a global VLBI array. The Huygens radio link was designed to operate between Huygens and Cassini, some 100000 km apart, not between Huygens and Earth at 1.2 billion kilometres. Thus, the Huygens signal at Earth was very weak (measured in tens to hundreds of photons per telescope per second). In addition, most of the Huygens descent took place while Saturn was best visible from the Pacific ocean - an area sparsely populated by radio telescopes. The experiment succeeded nevertheless, resulting in extraordinarily accurate data on the descent trajectory (with 1 km accuracy) and horizontal velocity. The observers were even able to detect the swinging of Huygens below its parachute, with an amplitude of 0.6 m (Gurvits, priv. comm.).
3.3.8. Motion of the sun around the Galactic centre
The nature of the compact radio source in the Galactic Centre,
Sgr A*, has been the target of many VLBI
observations (see
Section 3.1.8). Evidence from astrometric
observations of the central mass in Sgr A* was presented by
Reid et
al. (1999).
They monitored the position of Sgr A* over
two years with a VLBI array, and found that its apparent motion in the
Galactic plane is (5.90 ± 0.4) mas yr-1. This motion of
course is caused by the sun's orbit around the Galactic centre. When
the sun's orbit (known from other observations) was taken into
account, the proper motion of Sgr A* is less than
20 km s-1. This means that Sgr A* is extremely close
to the dynamic centre of the galaxy. Were the radio emission from
Sgr A* emitted by an exotic form of
stellar cluster, then
much higher velocities would be expected. Taking into account the mass
of the stars orbiting Sgr A*, which is of the order of
10 M,
and their high velocities of a few hundred kilometres
per second, the negligible proper motion of Sgr A* implies
that it must have a mass of at least 1000
M. All evidence is
consistent with Sgr A* being a black hole.
9 M 87 is approximately 2000 times more distant than Sgr A* but has a black hole with a mass 1000 greater than Sgr A*'s, so these two effects almost exactly cancel each other when the resolution is measured in Schwarzschild radii. Back.
10 http://www.journals.uchicago.edu/ApJ/journal/issues/ApJ/v599n2/58473/video2.mpg, or http://www.nrao.edu/pr/1999/txcam/txcam.a-ak.gif Back.
11 see also http://www.nrao.edu/pr/2001/scox1/scox100.htm Back.
12 http://www.nrao.edu/pr/2004/ss433 Back.