


N-body simulations have clearly shown that bars form spontaneously in galactic disks. An example is given in Fig. 4.1, displaying the face-on (upper panels), side-on 1 (middle panels), and end-on 2 (lower panels) views of the disk component at three different times during the formation and evolution. The left-hand panel shows the initial conditions of the simulation, the right-hand one a snapshot at a time near the end of the simulation, and the central panel a snapshot at an intermediate time. Before plotting, I rotated the snapshots so that the major axis of the bar coincides with the x axis.
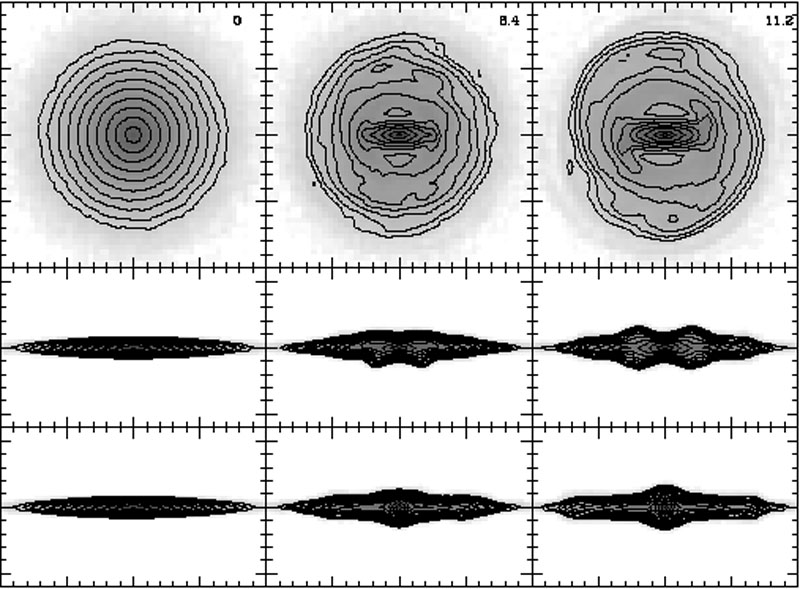 |
Figure 4.1. Three snapshots showing the formation and evolution of a bar. Each column corresponds to a given time (increasing from left to right), and each row corresponds to a different viewing geometry, namely (from top to bottom) face-on, side-on and end-on. The time, in Gyr, is given in the upper-right corner of each upper panel. See text for further descriptions. |
Note that between the times of the central and right panels both the bar and the disk have grown considerably in size, and that in both snapshots an inner ring surrounds the bar. Note also that the initially thin disk becomes thick in the inner parts. Seen side-on, it first becomes asymmetric with respect to the equatorial plane and then puffs up to reach a peanut-like shape. Seen end-on, it displays a bulge-like central concentration. From the face-on and the side-on views we can infer that this concentration is simply the bar seen end-on. In a real galaxy, however, where knowledge about the two other views would be unavailable, this could be mistaken for a classical bulge, unless supplementary photometric and/or kinematic information is available. Athanassoula (2005b) showed that this error could occur only if the angle between the bar major axis and the line of sight was less that 5-10 degrees, i.e., within a rather restricted range of viewing angles.
Such bar formation and evolution processes had already been witnessed in the pioneering N-body simulations of the early seventies and onward (e.g., Miller et al. 1970; Hohl 1971; Ostriker & Peebles 1973; Sellwood 1980, 1981; Athanassoula & Sellwood 1986; Sellwood & Athanassoula 1986; Combes et al. 1990; Pfenniger & Friedli 1991). Although technically these simulations were not up to the level we are used to now (due to lower number of particles, lower spatial and temporal resolution, absence or rigidity of the halo component, a 2D geometry, etc.), they came to a number of interesting results, two of which are closely related to what we will discuss here.
Ostriker & Peebles (1973), using very simple simulations with only 150 to 500 particles, came to the conclusion that haloes can stabilise bars. This number of particles is too low to describe adequately the bar-halo interaction and particularly its effect on the bar growth. It is thus no surprise that their result is partly flawed. Nevertheless, this paper, together with the subsequent one by Ostriker et al. (1974), gave a major impetus to research on dark matter haloes, focusing both observational and theoretical effort on them.
Athanassoula & Sellwood (1986), using 2D simulations with 40000 particles only, showed that bars grow slower in hotter disks (i.e., in disks with larger velocity dispersions). They also confirmed a result which had been already found in analytical mode calculations (e.g., Toomre 1981), namely that a higher relative halo mass decreases the bar growth rate, so that bars grow slower in disk galaxies with a larger MH / MD ratio, where MH and MD are the halo 3 and disk masses, respectively. These results will be discussed further in Section 4.6.8.
1 For the side-on view, the galaxy is viewed edge-on, with the direction of the bar minor axis coinciding with the line of sight. Back.
2 A discussion of the various methods that can be used to measure a bar length in simulations, in ensembles of orbits and/or in observations, and of their respective advantages and disadvantages can be be found in AM02, Patsis et al. (2002), Michel-Dansac & Wozniak (2006) and Gadotti et al. (2007). Back.
3 There is some ambiguity in general about what is meant by the term `halo mass'. In some cases it is the total halo mass, but in others it is the mass within a radius encompassing the relevant part of the simulated galaxy. In this case, since the simulations were 2D and therefore the halo rigid, only a small-sized halo was considered, so the two definitions coincide. Back.