Copyright © 2005 by Annual Reviews. All rights reserved
| Annu. Rev. Astron. Astrophys. 2005. 43:
727-768 Copyright © 2005 by Annual Reviews. All rights reserved |


Measuring clustering gives information about the distribution of galaxies with respect to the dark matter. The strength of clustering is correlated with the mass of extended halos that host luminous galaxies. At redshift lower than 1.3, large-scale structures have been mapped by the DEEP2, 2dF and SDSS surveys (Coil et al. 2004; Peacock et al. 2001; Doroshkevich et al. 2004). At higher redshifts, correlation lengths r0 have been measured for different galaxy populations such as the LBGs and EROs. Values of about r0 = 4 h-1 Mpc (Porciani & Giavalisco 2002) and r0 = 11 h-1 Mpc (Daddi et al. 2000; Firth et al. 2002; Roche et al. 2003) are reported with mean redshift of about 3 and 1-1.5 for the LBGs and EROs, respectively. Getting information on the clustering of the infrared galaxies is essential to see how they relate to the other galaxy populations and to understand their formation process. As an example, one of the key questions is to see if the most massive SMGs are associated with the most massive dark matter halo.
Up to now, very little information is available on the clustering of
infrared galaxies. A clustering signal can tentatively be measured,
although the small number of objects in the deep narrow-pencil ISOCAM
and SCUBA beams prevents accurate measurements of the autocorrelation
function. At z ~ 1,
Moy & Elbaz (2005)
study the large-scale and close
environment of ISOCAM galaxies. They find that infrared galaxies are
more strongly clustered than optical galaxies. Eighty percents of
ISOCAM galaxies are found preferentially in redshift peaks, versus
68% for the optically selected galaxies.
Moy & Elbaz (2005)
find indirect evidences that the triggering mechanism of dusty starbursts
is small-scale (~ 100 kpc) galaxy-galaxy interactions. Such
interactions do not lead to major mergers most of the time but are
more likely simple fly-by, tidal interactions or minor mergers. At
much higher redshift, there are some indirect evidences of strong
clustering of SMGs when compared to other classes of high-redshift
galaxies. For example,
Chapman et al. (2001)
identified SMGs within
the most overdense structure of LBGs at z ~ 3.1
(Steidel et al. 2000).
De Breuck et al. (2004)
detected an overdensity of MAMBO sources likely at z
 4.1 in a proto-cluster
containing also
overdensities of Ly
4.1 in a proto-cluster
containing also
overdensities of Ly emitters and LBGs. The first three-dimensional quantitative measurement
of the clustering strength of SMGs has been made by
Blain et al. (2004a).
They find spectroscopic
evidence for clustering. Using 73 spectroscopically identified
galaxies, they find a surprisingly large number of "associations"
with redshifts separated by less than 1200 km s-1. They provide
tentative evidence for strong clustering of SMGs at z
2-3 with
a correlation length of ~ (6.9 ± 2.1) h-1 Mpc using a
simple pair-counting approach appropriate for the small and sparse SMG
sample. This correlation length appears to be somewhat larger than
that for both LBG and QSO galaxies at comparable redshifts. It is thus
unlikely that the SMGs form a simple evolutionary sequence with either
population. On the contrary, the correlation length could be
consistent with a form of evolution that subsequently matches the
large comoving correlation length typical of evolved EROs at
z 1 and of
clusters of galaxies at z = 0
(Figure 10). From this figure, we see that the
correlation
function of SMGs appears to be consistent with the hypothesis that
they are associated with the most massive dark matter halos at high
redshifts. These are more massive than the host halos of LBGs and QSOs
at comparable redshift. These preliminary conclusions have to be
investigated in more detail. In particular, the SMG masses inferred
from clustering measurements have to be compared to the dynamical
masses derived from millimeter wave CO spectroscopy. To go deeper in
understanding the clustering properties of infrared galaxies,
Spitzer 24 µm surveys will be best suited. With a
large number of sources detected in quite large surveys, Spitzer
will unambiguously constrain the clustering of infrared galaxies from
redshift 0.5 to 2.5. Conjointly, the physics of galaxy clustering can
be probed by the CIB fluctuation analysis
(Knox et al. 2001).
CIB fluctuations measure, on large angular scales, the linear clustering
bias in dark-matter halo and, at small angular scales, the nonlinear
clustering within a dark-matter halo
(Cooray & Sheth
2002).
They thus probe both the dark-matter halo mass scale and the physics
governing the formation of infrared galaxies within a halo. Promising
attempts are underway using the 170 µm ISO FIRBACK
fields (Lagache et al., in preparation).
emitters and LBGs. The first three-dimensional quantitative measurement
of the clustering strength of SMGs has been made by
Blain et al. (2004a).
They find spectroscopic
evidence for clustering. Using 73 spectroscopically identified
galaxies, they find a surprisingly large number of "associations"
with redshifts separated by less than 1200 km s-1. They provide
tentative evidence for strong clustering of SMGs at z
2-3 with
a correlation length of ~ (6.9 ± 2.1) h-1 Mpc using a
simple pair-counting approach appropriate for the small and sparse SMG
sample. This correlation length appears to be somewhat larger than
that for both LBG and QSO galaxies at comparable redshifts. It is thus
unlikely that the SMGs form a simple evolutionary sequence with either
population. On the contrary, the correlation length could be
consistent with a form of evolution that subsequently matches the
large comoving correlation length typical of evolved EROs at
z 1 and of
clusters of galaxies at z = 0
(Figure 10). From this figure, we see that the
correlation
function of SMGs appears to be consistent with the hypothesis that
they are associated with the most massive dark matter halos at high
redshifts. These are more massive than the host halos of LBGs and QSOs
at comparable redshift. These preliminary conclusions have to be
investigated in more detail. In particular, the SMG masses inferred
from clustering measurements have to be compared to the dynamical
masses derived from millimeter wave CO spectroscopy. To go deeper in
understanding the clustering properties of infrared galaxies,
Spitzer 24 µm surveys will be best suited. With a
large number of sources detected in quite large surveys, Spitzer
will unambiguously constrain the clustering of infrared galaxies from
redshift 0.5 to 2.5. Conjointly, the physics of galaxy clustering can
be probed by the CIB fluctuation analysis
(Knox et al. 2001).
CIB fluctuations measure, on large angular scales, the linear clustering
bias in dark-matter halo and, at small angular scales, the nonlinear
clustering within a dark-matter halo
(Cooray & Sheth
2002).
They thus probe both the dark-matter halo mass scale and the physics
governing the formation of infrared galaxies within a halo. Promising
attempts are underway using the 170 µm ISO FIRBACK
fields (Lagache et al., in preparation).
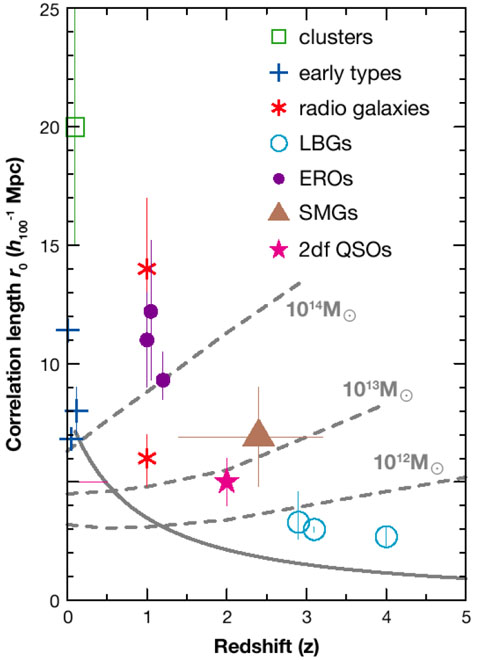 |
Figure 10. Comoving correlation length of the SMGs (triangle) in contrast to other populations of low- and high-redshift galaxies (see the summary in Overzier et al. 2003). The horizontal error bar on the SMG point spans the range of redshifts over which SMG associations are found. The solid line shows a representative model for the evolution of a certain overdensity. The dashed lines show the expected correlation length of dark matter halos as a function of mass and redshift. From Blain et al. (2004a). |