


I am titling this lecture as `the infrared experience' because moving to the infrared (IR) opens such a big door to galactic studies. This is the wavelength domain that allows us to see what is often referred to as the `backbone' of the stellar mass distribution. It is also the wavelength domain that exposes the interstellar medium (ISM) in a manner that no other domain can.
Observing at such wavelengths shows dust-penetrated morphology. At 2.2 microns, the extinction AKs ≈ 0.1AV, where AV is the visual extinction, at 3.6 microns, the extinction is A3.6 ≈ 0.05AV. When we observe in the near- and mid-IR, we minimise the effects of these features on spiral galaxy morphology: bar dust lanes, spiral arm dust lanes, near-side dust lanes, dust rings, red planar dust lanes, and blue planar dust lanes (Fig. 48, which includes colour index maps that show these features). It is even advantageous to observe S0 galaxies in the IR, since extraplanar dust is often seen in such galaxies (Fig. 49). Colour index maps are not the only way to see the dust. In overlapping galaxy pairs, the dust is sometimes detected well beyond the standard isophotal radius, r25 (Fig. 50, Holwerda et al. 2009).
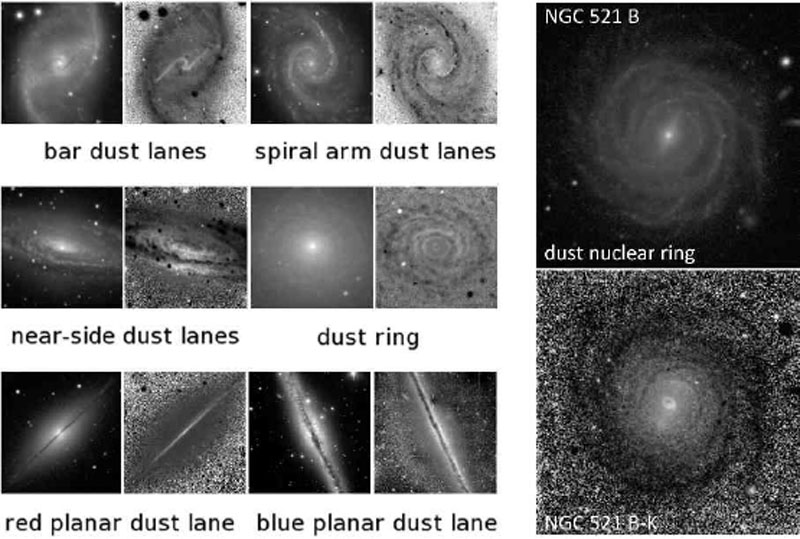 |
Figure 48. Dust morphologies in normal galaxies based on colour index maps. The left panels are from B13 and show from top-left to lower-right: NGC 1530, NGC 1566, NGC 7331, NGC 7217, NGC 7814, and NGC 891. The images of NGC 521 are from Buta et al. (2009). |
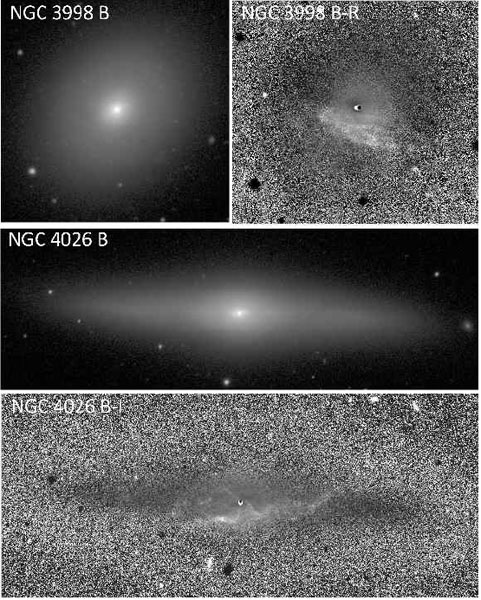 |
Figure 49. Examples of dusty S0s. |
 |
Figure 50. Example of an overlapping pair that reveals the significant extent of the dust disk of the foreground galaxy (from Holwerda et al. 2009, reproduced with permission). |
The near- and mid-IR may be mostly free of the effects of extinction but they are NOT completely free of the effects of star formation. Dust warmed by hot young stars becomes increasingly visible over 2-5 μm as shown in Fig. 51. In fact, the IR is an excellent domain for detailed studies of star-forming regions and especially star-forming galaxies. Spectral emission lines due to polycyclic aromatic hydrocarbons appear in three of the four mid-IR bands of the Infrared Array Camera (IRAC) on the Spitzer Space Telescope (e.g., Churchwell et al. 2004).
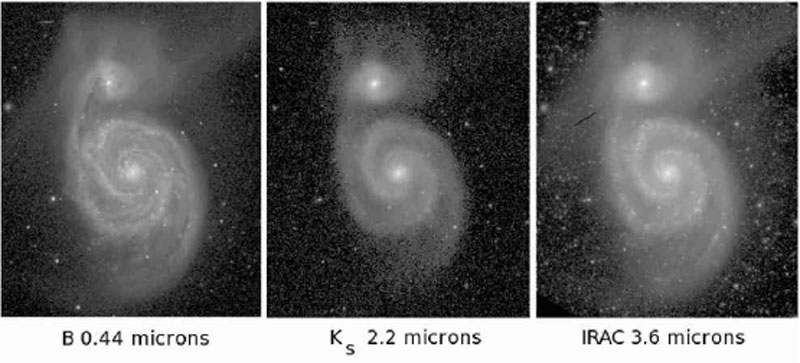 |
Figure 51. M 51 from the B-band to the mid-IR. |
The IR can also provide a great deal of information on the properties of bulges and disks in galaxies. Because of the reduced effects of extinction, standard parameters of bulges and disks can be considered more characteristic of the stellar mass distribution than they are in the optical. Before describing IR galaxy morphology, let me first briefly describe the methods people are currently using to derive these parameters.
Most photometric decomposition today is 2D, meaning the whole image is fitted rather just the major or the minor axis as was once the standard method. The most popular parametric function to use is the Sersic Law.
Let Re be the radius of the isophote enclosing half the total luminosity (called the effective radius) and let Ie be the surface brightness of this isophote. Define relative parameters ρ = R / Re and Jn = In(R) / Ie. The Sersic Law connects these parameters through
 |
(5) |
where n is a characteristic index that determines the shape of the radial profile. The Sersic law is a `jack of all trades':
Two-dimensional decomposition today has gone well beyond merely bulges and exponential disks. Barred galaxies are no longer ignored because bars can be fitted and their contribution allowed for. For example, one can use a Ferrers bar model (e.g., Binney & Tremaine 2008):
 |
(6) |
where m is the radius along the bar axis. The Sersic law can also be used for bars. Values of n < 1 can fit some bars well. Sersic fits have also been used for secondary bars and lenses. If these features are not fitted, then the bulge-to-total luminosity ratio B / T will tend to be overestimated (Laurikainen et al. 2006). With initial guesses of all parameters, the best fit uses χ2 minimisation, usually with an adopted weighting scheme. Initial guesses can be based on 1D profile analysis.
6.1. Significant IR morphological surveys
I would like to describe now three recent extensive surveys that shed a great deal of light on IR galaxy morphology.
6.1.1. The Ohio State University Bright Spiral Galaxy Survey
The Ohio State University Bright Spiral Galaxy Survey (OSUBSGS, Eskridge et al. 2002) was a comprehensive imaging survey of 205 bright nearby spiral galaxies. The main IR imaging filter used was the H-band at 1.65 μm. The galaxies in the survey were classified in the de Vaucouleurs (1959) system and special attention was paid to how near-IR types differ from the optical classifications of galaxies. The authors found several galaxies classified as SA in the Third Reference Catalogue of Bright Galaxies (RC3) for which they assigned a classification of SB. They also estimated the frequency of bars in their sample (Lecture 2, Section 5). In general, it was found that intermediate-type spirals were classified approximately one stage intervalearlier in the H-band than in the B-band. The authors also challenged the idea, implied by earlier IR studies based on lower-quality imaging, that the Hubble tuning fork breaks down in the near-IR.
6.1.2. The Near-Infrared S0 Survey
The Near-Infrared S0 Survey (NIRS0S, Laurikainen et al. 2011) provides a near-IR atlas (in the Ks or 2.15 μm bands) of 174 mostly S0 and some S0/a and Sa galaxies. The analysis described by Laurikainen et al. (2011) and in earlier papers in the series includes sophisticated 2D multi-component decompositions and classifications in a modified dVA system (with special recognition of lenses). A summary of the main findings of the NIRS0S is provided by Laurikainen et al. (2012).
NIRS0S 2D decompositions have modified our views of bulges along the Hubble sequence. Laurikainen et al. (2007) found that most bulges are pseudobulges and that B / T ratios of S0-Sa galaxies are much less than was determined in past studies (Fig. 52, left). Across the Hubble sequence, the average value of the Sersic index n is generally less than 2, consistent with one of the pseudobulge criteria adopted by KK04.
 |
Figure 52. NIRS0S results from Laurikainen et al. (2007, left frames) and Buta et al. (2010a, right frames). |
Two-dimensional decompositions allow a more reliable deprojection of galaxy images, because the bulge is modelled and can be removed from the image. Then the remaining disk light can be deprojected and the bulge added back. With such images, the bar strength parameter Qg can be derived and the distribution of bar strengths for early-type galaxies can be compared with that for late-type galaxies. This was done by Buta et al. (2010a) who used NIRS0S deprojected images for S0 to Sa galaxies and OSUBSGS images for spirals (Buta et al. 2004). The histograms in Fig. 52, right, show that S0 bars tend to be weak. This had been evident previously based on other bar strength indicators (e.g., Aguerri et al. 2009; Laurikainen et al. 2009). Part of the difference will be due to the presence of significant bulges in early-type galaxies, which add forcing to the axisymmetric background and thereby dilute the bar torques. However, all of the difference cannot be explained this way, and it is possible that there is a process that allows bar evolution to continue even after gas depletion in S0 galaxies. Laurikainen et al. (2006) showed that radial disk scalelengths of S0s correlate with bulge effective radii, which favours secular evolution of S0 bulges from disk material.
How could the bar of an S0 evolve? Block et al. (2002) argued that an S0 bar should be a fossil relic, capable of no further change. But if S0s are former spiral galaxies, why is it that S0 bars are weaker on average than those in spirals and why are ansae bars so prevalent among S0 galaxies? The answer could be secular evolution of the stellar mass distribution.
Another important finding from the NIRS0S is the recognition of a new type of lens: the `barlens' or inner component of the bar (Laurikainen et al. 2011, 2012). In NGC 2787 (Fig. 53, top), the barlens is separated from the bar ends, leaving the familiar `ansae' previously discussed (Lecture 2, Section 5). At first sight, the barlens looks like nothing more than a part of the bulge, but 2D decompositions do not support this interpretation. To show that a barlens is a distinct feature, the right panel of Fig. 53 shows a normal Kormendy-type lens in the face-on ringed galaxy NGC 1543. A normal lens envelops and is filled by the bar, while a barlens is part of the bar although it may not contribute much to the actual torquing action of the bar. Bar dissolution, if it occurs, would mainly mean the loss of the bar ends.
The nature of lenses also gains greater immediacy when we find them in multiple form in nonbarred early-type galaxies. Two important and very similar examples are shown in Fig. 53, bottom. In both NGC 524 and NGC 1411, three distinct lens features are detectable, and each galaxy is classified as (L)SA(l,nl)0o, where (L) refers to an outer lens, (l) to an inner lens, and (nl) to a nuclear lens. The (L) and (l) notations are due to Kormendy (1979), who also suggested that inner lenses (l) represent the dissolution of bars, so that in principle a lens in a nonbarred galaxy could imply that the galaxy was once barred. However, bar evolution cannot necessarily explain all types of lenses.
 |
Figure 53. NIRS0S results from Laurikainen et al. (2011). (Top): the `barlens' as compared to a typical SB galaxy `lens'. (Bottom): two examples of SA galaxies having multiple lenses. |
One way to possibly shed light on the origin of lenses is to measure their colours. Figure 54 shows a V-band image, a B - V colour index map, and azimuthally averaged B, V, and B - V surface brightness profiles for NGC 1411. On the graph, the radial locations of the `edges' of the three lenses of the galaxy are indicated. The B - V colour index profile shows two zones of slightly bluer colours, one between the (nl) and (l), and one between the (l) and (L). The apparent sharp edges appear to delineate zones with slight stellar population differences. The B - V map also shows some reddening on the east side of the centre, which could signify a minor merger.
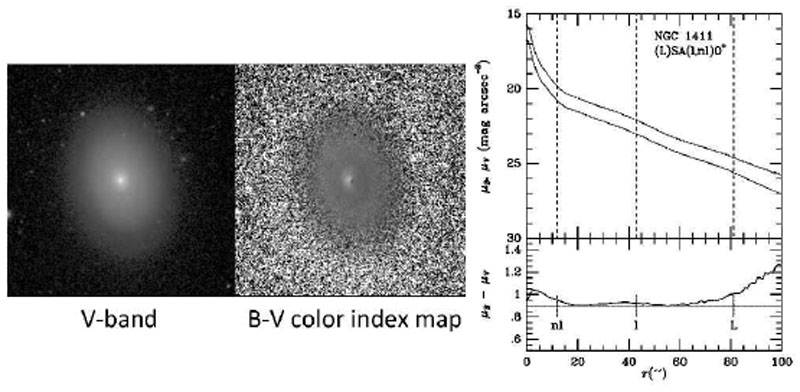 |
Figure 54. This shows NGC 1411 and a colour index map that highlights the enhanced blue colours that lie between the apparent `edges' of the lenses. |
6.1.3. The Spitzer Survey of Stellar Structure in Galaxies
The Spitzer Survey of Stellar Structure in Galaxies (S4G, Sheth et al. 2010) is a comprehensive survey of 2331 nearby galaxies in the 3.6 and 4.5 μm IRAC bands, the only filters that were usable for the Spitzer `warm mission'. The images sample the Rayleigh-Jeans limit for all stars with T > 2000 K, and the [3.6]-[4.5] colour is roughly constant with radius, independent of stellar population (but see also the Peletier lectures, this volume). The goal of S4G is to examine stellar structure in galaxies free of the effects of extinction and to a depth greater than groundbased near-IR imaging could achieve.
The selection criteria for S4G are as follows: galactic latitude b ≥ 30o, isophotal diameter D25 > 1.0 arcmin, Hi radial velocity V > 3000 km s-1, and apparent photographic magnitude mB < 15.5. The sample includes 1734 newly observed galaxies and 597 archival objects. Histograms presented in Sheth et al. (2010) show that the bulk of S4G galaxies are of types Sb and later, a consequence of the use of an Hi velocity as a selection criterion. The most statistically complete subset of S4G galaxies is for masses log(M / M ⊙) < 9.2.
In a preliminary analysis of 200 mostly archival S4G galaxies, Buta et al. (2010b) showed that galaxies can be classified in 3.6 μm images in much the same manner as for the historically standard B-band images (essentially the same as was found by Eskridge et al. 2002 for the H-band). In fact, for many galaxies, 3.6 μm morphology is very similar to blue light morphology, absent the effects of obscuring dust (Fig. 55). Because mid-IR galaxy morphology is so similar to optical morphology, we can apply the old classification systems to S4G data as an exploratory step. The system being used is a further modified version of that outlined in the dVA. Figure 56 shows some classifications of S4G galaxies in Buta et al. (2013).
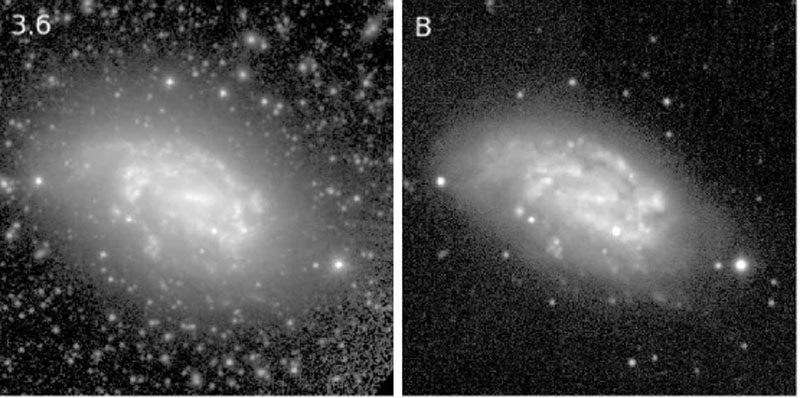 |
Figure 55. The late-type spiral NGC 1559 has a very similar morphology in blue and 3.6 μm light. |
 |
Figure 56. A set of classifications of S4G galaxies using a modified version of dVA types. |
Buta et al. (2010b) also showed that galaxies of types S0/a to Sbc can appear about one stage interval `earlier' at 3.6 μm compared to B. Types S0+ and earlier and Sc and later can look almost the same. This is similar to what Eskridge et al. (2002) concluded for near-IR H-band images. The effect is shown for NGC 1433 in Fig. 57. Some B-band flocculent spirals look more globally armed at 3.6 μm; many do not change (Elmegreen et al. 2011). S4G images also show many galaxies where a late-type spiral or irregular is embedded in an early-type disk. One example is NGC 5713, which has a clear SB(rs)m galaxy embedded in a background S0/a disk. Other examples shown by Buta et al. (2010b) are IC 750, IC 3392, and NGC 3769. Buta et al. (2010b) show two B-band Magellanic irregulars (Im) that appear more regular at 3.6 μm. If placed in a cluster environment, these could become progenitors of Kormendy spheroidal (Sph) or nucleated (Sph,N) galaxies. Also possible progenitors of spheroidals are Magellanic barred spirals like NGC 3906 and NGC 4618, shown also in Fig. 10 of Buta et al. (2010b).
 |
Figure 57. NGC 1433 at 3.6 μm (left), showing the `earlier' effect as compared to the B-band (right). |
The dust-penetrated nature of S4G images also can reveal unusual optical misclassifications. NGC 5470 is classified as type Sb, but at 3.6 μm we see an edge-on S0 with virtually no bulge and both thick and thin disks (Fig. 58). In the mid-IR the galaxy should be classified as type S0d, which alludes to the van den Bergh (1976) parallel sequence classification of S0s. Other interesting edge-on disks, some of which look like they are embedded in Kormendy spheroidals, are shown in Fig. 59.
 |
Figure 58. Four S4G galaxies showing dust-free views of edge-on disks and a Magellanic irregular. |
 |
Figure 59. Four S4G galaxies showing `embedded disks' in what appear to be spheroidal systems. |
Several special S4G cases are shown in Fig. 60. NGC 3094 looks like a barred spiral with a dusty bar in optical images, but at 3.6 μm it shows an extremely bright starburst nucleus that was measured by Narayanan et al. (2005) to have log(LIR) = 10.73. NGC 4250 looks like an early-type galaxy with an oval ring/lens, a very faint outer ring, and an exceptionally well-defined nearly circular nuclear lens. The type of the galaxy at 3.6 μm is (R)SAB(rl,nl)0+. NGC 4572 is a very unusual case which at first sight appears to be a very open spiral, but which is more likely to be an extremely warped edge-on disk. IC 167 is an extreme case of an open spiral in the S4G sample.
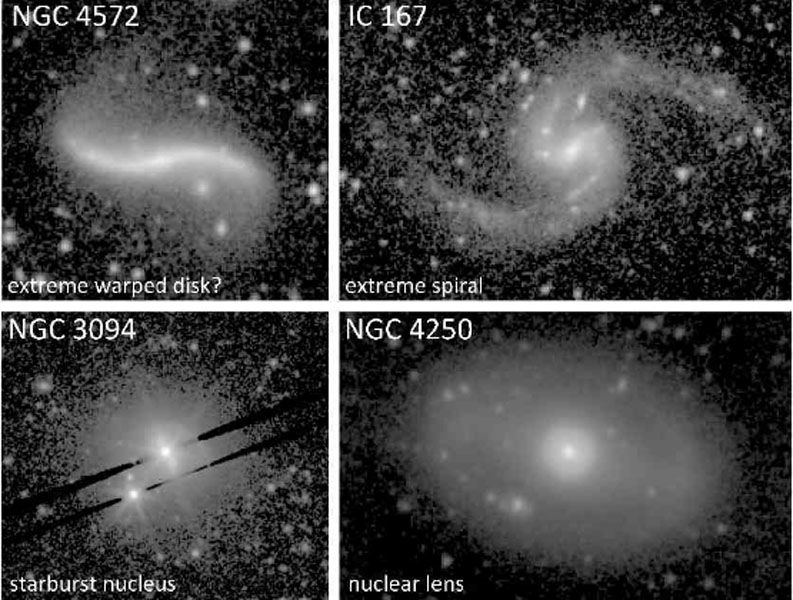 |
Figure 60. Four extreme S4G cases. |
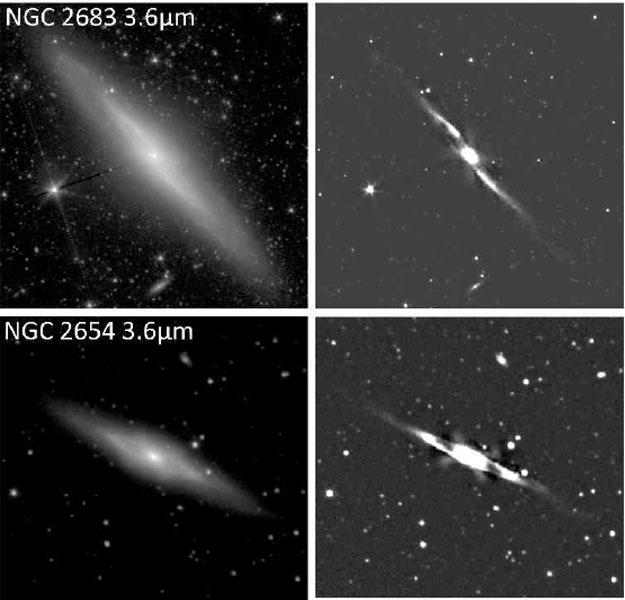
Figure 61, left, shows S4G 3.6 μm images of two nearly edge-on galaxies showing a clear X-pattern in the central regions. Figure 61, right, shows unsharp-masked versions of the same images of NGC 2654 and NGC 2683, both optical Sb spirals. The X-pattern in NGC 2654 is more distinct than that in NGC 2683 and is detectable even in an optical SDSS image. These features point to the presence of a bar in each galaxy (see also Kuzio de Naray et al. 2009).
 |
The differing characteristics of bars along the de Vaucouleurs revised Hubble-Sandage sequence of types complicate the interpretation of the bar fraction. Excluding highly inclined galaxies (spindles), here are some preliminary results from my classification of 2184 S4G galaxies (and a few of their companions):
Thus, bars are very abundant in extreme late-type galaxies! This result is consistent with the recent SDSS study by Barazza et al. (2008), who found an optical bar fraction of ≈ 87% for what they called `class 3' (bulgeless) galaxies.
6.3. Inferring stellar mass from S4G images
The ultimate value of IR imaging is to infer stellar mass and the gravitational potential in galaxies. With such potentials you can, among other things:
Estimate maximum relative bar torques Qb (or Qg) and mass-flow rates;
Derive mass models and run simulations to estimate pattern speeds (e.g., Aguerri et al. 2001; Treuthardt et al. 2008; Kalapthorakis et al. 2010; Rautiainen et al. 2008; Lin et al. 2008);
Measure potential-density phase shifts and infer locations of resonances (Zhang 1996, 1998, 1999, hereafter Z96, Z98, Z99).
Stellar surface mass density maps can be made from 2D images using surface colours as indicators of stellar mass-to-light ratio (Bell & de Jong 2001). Calibrated surface brightness maps can be converted to units of L⊙ pc-2, and then multiplied by colour-inferred M / L values in Solar units to give the surface mass density Σ (i, j) in units of M⊙ pc-2 at pixel coordinate (i, j).
Bell & de Jong (2001) give linear relationships between the logarithm of the M / L ratio in a given passband and a variety of colour indices in the Johnson-Cousins systems. Bell et al. (2003) give the same kinds of relations for SDSS filters, as well as an improved calibration for B - V and B - R colours that allows for the scatter in metallicities that affects near-IR mass-to-light ratios. For 3.6 μm images, colours such as B - V, B - R, V - I, or even g - i can be used to give the stellar mass-to-light ratio in the K-band, depending on which of these colours is available. Then a simple relationship between M / LK and M / L3.6 (Oh et al. 2008) can be used to estimate the surface mass densities:
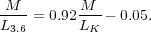 |
(7) |
In practice, it is useful to use two colours and two base IR images to check for consistency of results. For example, X. Zhang and R.J. Buta (2013, in preparation) have used SINGS (Kennicutt et al. 2003) 3.6 μm images with B - V or B - R surface colours, and SDSS i-band images with g - i surface colours, to estimate mass flow rates (see also Zibetti et al. 2009; Foyle et al. 2010).
As already noted, 3.6 μm images are affected by hot dust connected with star-forming regions and by a prominent 3.3 μm emission feature due to a polycyclic aromatic hydrocarbon compound that also is associated with star-forming regions. These star-forming regions appear as conspicuous `knots' lining spiral arms in 3.6 μm images.
In practice, the star-forming region problems in the 3.6 μm band can be reduced using an 8.0 μm image if available. IRAC 8.0 μm images show mainly the ISM with a small contribution from starlight. Kendall et al. (2008) describe how to correct the 3.6 μm image. The first step is to match the coordinate systems of the 3.6 and 8.0 μm images and then subtract a fraction (0.232) of the 3.6 μm flux from the 8.0 μm image to correct the latter for continuum emission (Helou et al. 2004). Then, a fraction (0.059-0.095; Flagey et al. 2006) of the net dust map is subtracted from the 3.6 μm map to give an image corrected for the hot dust emission. These `contaminants' can also be eliminated using Independent Component Analysis and [3.6]-[4.5] colours (Meidt et al. 2012) if no 8.0 μm image is available. This is the case for most of the S4G sample.
6.4. Secular evolution and the potential-density phase shift
The availability of large numbers of IR images that can be converted into stellar mass maps provides us with an opportunity to examine a promising new approach to understanding the actual mechanism of secular evolution in many galaxies. In any galaxy having a skewed bar, oval, or spiral perturbation, there will be a radius-dependent phase shift between the density perturbation and the potential perturbation (Zhang 1996). This phase shift distribution can drive secular stellar and gaseous mass redistribution because it leads to an interaction between the perturbation and the basic state of a galactic disk. 1 The approach interprets bars, ovals, and spirals as quasi-steady modes that arise spontaneously from an originally featureless disk. In the presence of such modes, the interaction resulting from the phase shift secularly evolves the basic state in the sense that a late-type spiral galaxy will evolve to an earlier-type galaxy. The actual interaction between the perturbation and the basic state involves collective effects that scatter and change stellar orbits without actual collisions (called `collisionless shocks').
An important result from Zhang's studies is that the phase shift changes from positive (density spiral leads potential spiral) inside CR to negative (density spiral lags potential spiral) outside CR. Given a surface mass density map of a disk galaxy, one can convert the densities into a potential and measure the phase shift distribution directly. This provides a direct way of locating the CR resonance without kinematic data. Thus, in addition to providing information on secular mass flow in galactic disks, the potential-density phase shift can be used to interpret galaxy morphology, since CR is tied to a fundamental property of a spiral or bar/oval: its pattern speed Ωp.
The method of locating CR using the potential-density phase shift (PDPS) method is outlined by Zhang & Buta (2007=ZB07) and Buta & Zhang (2011=BZ11). The result of this is that, if spirals and bars are quasi-steady modes, a single mode will be characterised by one positive phase shift hump followed by one negative hump. The negative part has to be there to take the angular momentum transferred outward by the positive part. Thus CR will be located at a positive-to-negative (P/N) crossing. The mode may end at a negative-to-positive (N/P) crossing, which then leads into the next mode if present. To measure phase shifts:
BZ11
describe first approximation phase shift analyses of several well-known
galaxies (Fig. 62).
NGC 986, a barred galaxy with a strong
spiral curving off the bar ends, shows a distribution with only a single
major P/N crossing that places CR exactly around the bar ends. In this
case, the bar and the spiral would have the same pattern speed, and
BZ11
interpret NGC 986 as a genuine example of a `bar-driven
spiral'. In contrast, NGC 175 is a barred spiral with two clear P/N
crossings. The
first CR circles the ends of the bar and the mode includes the inner
part of a bright spiral pseudoring, which is interpreted as being
bar-driven. The second CR refers to an independent outer
spiral pattern. In both of these cases, the ratio
 =
RCR(bar) / Rbar ≈ 1.
Buta & Zhang (2009=BZ09)
highlighted two cases, NGC 1493 and NGC 3686, which may be genuine examples having a `slow
bar', where > 1.4
(Debattista & Sellwood
2000).
=
RCR(bar) / Rbar ≈ 1.
Buta & Zhang (2009=BZ09)
highlighted two cases, NGC 1493 and NGC 3686, which may be genuine examples having a `slow
bar', where > 1.4
(Debattista & Sellwood
2000).
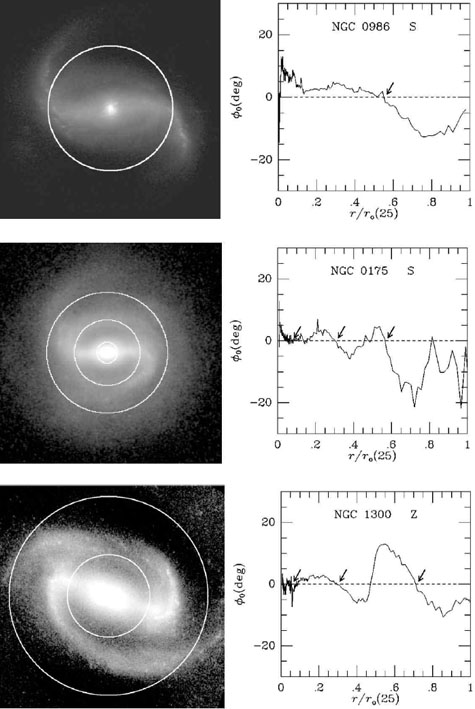 |
Figure 62. Ks-band images and phase shift distributions of three galaxies: (top) NGC 986; (middle) NGC 175; (bottom) NGC 1300. The arrows on the phase shift plots show the main P/N crossings, and hence the implied CR radii. The circles superposed on the images show these radii. |
The most enigmatic (and by default the most controversial) result from the phase shift method of locating CR is the unusual `superfast bars', where the bars extend beyond the bar CR. This appears to violate an almost cherished rule that bars cannot extend beyond their CR, because orbits outside CR cannot support the bar (Contopoulos 1980). This was a conclusion based on what ZB07 called `passive orbit analysis', an analytic approach where the Jacobi integral is conserved along a stellar orbit and secular change in the average radius of the orbit cannot occur. BZ11 describe the case of NGC 1300 as an example. In NGC 1300, there is a clear skewness to the apparently strong bar, meaning it is a very open spiral. In such a case, it is possible that the bar extends to its OLR and not to its CR. BZ09 show two other examples of superfast bars (NGC 4902 and NGC 5643). BZ11 also show the phase shift distribution for the strong grand-design spiral NGC 5247. In this case, CR lies at an intermediate position within the arms and the arms likely extend to their OLR.
Zhang & Buta (2012=ZB12) have carried out a more sophisticated (third approximation) analysis of the well-known ringed, barred spiral NGC 3351. An IRAC 3.6 μm SINGS (Kennicutt et al. 2003) image and an SDSS i-band image were converted into surface mass density maps using colour-dependent M / L ratios as described above. The appearance of NGC 3351 can garner much preconception. The bar is surrounded by a bright inner spiral pseudoring that could easily be interpreted in terms of the inner 4:1 resonance of the bar, as suggested by Schwarz (1984a, b). This would imply that the bar CR is outside the inner pseudoring. The phase shift distributions, however, suggest a very different interpretation. Figure 63 shows the phase shift distributions for NGC 3351 based on total mass maps that include both Hi and H2 gas. The figure shows that the 3.6 μm and SDSS i-band maps give very similar results: the phase shift is negative throughout the main part of the bar. This means that of the two CR radii indicated, CR1 is the bar CR, and thus NGC 3351 is another example of a `superfast' bar. In this circumstance, the spiral pseudoring around the bar is a separate mode, not a bar-driven spiral.
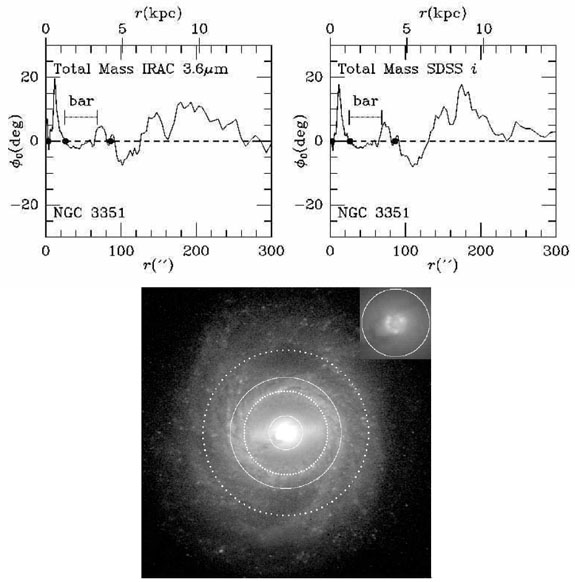 |
Figure 63. (Top): Phase shift analysis of NGC 3351 based on IRAC 3.6 μm and SDSS i-band total (star plus gas) mass maps. The bar extent is indicated. (Bottom): P/N (solid circles) and N/P (dotted circles) phase shift crossings superposed on a deprojected SDSS g-band image of NGC 3351, based on an average of the values derived from the IRAC and SDSS images. Since the bar extends to an N/P crossing, it is of the `superfast' type (from ZB12). |
Why is the phase shift relevant to secular evolution? The phase shift brings attention to the role of collective effects on galactic dynamics, and may be the principal driver of secular evolution in disk galaxies. The idea is that if the basic state is changed by the presence of a spontaneous, self-sustaining density wave, then it means orbits of stars will migrate, slowly building up a `pseudobulge' and spreading out the stellar disk.
The essential features of optical galaxy morphology are preserved in the IR, but are unambiguously detected because of the minimal effects of extinction.
Morphological analysis of S4G images confirms a high fraction of bars in extreme late-type galaxies, more than 80%.
IR images offer a way to locate CRs and to probe secular evolution of the stellar mass distribution using the PDPS method.
1 The basic state is defined by the radial distributions of mass density, velocity dispersion, and rotation speed of the bulge and disk components (Bertin et al. 1989). Back.