


The ultimate goal in this review is to trace how structure evolves over cosmic time, and using this as a method to decipher galaxy evolution. As such, I present in this section work to date which describes how physical information is derived from galaxy structural parameters.
3.1. Star Formation and Galaxy Structure
The star formation process within galaxies is critical, as galaxies would not exist without stars in them. Star formation is also one of the major criteria for classification within the Hubble sequence. The effects of star formation has also been used to classify spiral galaxies into various classes (e.g., van den Bergh 1976; Elmegreen & Elmegreen 1987).
Star formation is an enormous topic with a large amount of work published (e.g., Kennicutt 1998; Kennicutt & Evans 2012; Madau & Dickinson 2014), and we thus limit our discussion to how star formation and galaxy structure are related. The integrated star formation density evolution of galaxies in the universe has been studied in detail and is now well characterized. The integrated star formation rate increases from a low initial value at z > 6 to a peak at z ~ 2, and thereafter declines. At higher redshifts z > 1 there is also a well defined relation between star formation rate and stellar mass, such that higher mass galaxies have a higher rate of star formation (e.g., Noeske et al. 2007; Bauer et al. 2011).
This is important as galaxies undergoing star formation can have very different morphologies and structures from passive galaxies. Examples of this include: clumpy spiral arms, knots of star formation, central bright starbursts, etc. This can be seen for example when viewing local galaxies, whereby those with star formation appear clumpier and more asymmetric than those without star formation.
Furthermore, there are also morphological k-correction effects, such that star forming galaxies have a smaller difference in their morphology between ultra-violet through optical and near-infrared light (e.g., Windhorst et al. 2002; Taylor-Mager et al. 2007). This generally reveals that at shorter wavelengths the morphologies and quantitative structures are tracing the distribution of star formation directly. At optical wavelengths longer than the Balmer break, we are sampling a mixture of stars at different ages, with older ages dominating the SEDs at longer wavelengths. There are also very dusty galaxies such as sub-mm sources and ULIRGs which can have a significant fraction of their optical light absorbed (e.g., Calzetti et al. 2000).
It is not just apparently morphology which is affected by star formation, but also the quantitative structure. It is well known that star forming galaxies without significant dust are quite blue, but the effects of star formation can also be seen in their structure. Quantitative measurements of structure strongly correlates with the star formation rate within galaxies as measured by the correlation between the clumpiness index (S) and the Hα equivalent width (Conselice 2003). This is also seen in more asymmetric and clumpy light distributions within Hα imaging of nearby galaxies, and when examining the light distribution at 24 μm imaging using Spitzer Space Telescope imaging (e.g., Bendo et al. 2007). Conselice (2003) calibrate how the clumpiness index can be used as a measure of star formation, and Conselice et al. (2000a) show that asymmetry values correlate strongly with (B-V) color for nearby galaxies.
3.2. Structure as a Merging Indicator
One of the primary physical effects that can be seen in the structures of galaxies is when two galaxies merge or interact with each other. When these dynamical events occur the structures of these systems often become very peculiar and distorted, especially when the merging galaxies contain a similar amount of mass in a major merger 1 We have learned much about nearby galaxy mergers, such as ULIRGs (e.g., Joseph & Wright 1985; Sanders & Mirabel 1996), as well as through numerical simulations (e.g., Mihos & Hernquist (1996) that have shown convincingly that peculiar galaxies are often mergers (Toomre & Toomre 1972). This demonstrates that there is a strong correlation between structure and this fundamental galaxy formation process.
Early measurements of galaxy lopsidedness through Fourier decomposition of structure, and by using the asymmetry parameter, measured on nearby galaxies found a correlation with the presence of interacting or merging neighbors (e.g., Rix & Zaritsky 1995; Conselice 1997; Reichard et al. 2008). As such, galaxy structure is a powerful method for determining whether a galaxy is undergoing a recent major merger. This has been measured in many ways, from using visual estimates of mergers based on peculiar structures to more quantitative results.
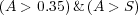
One automatic method for finding mergers is the CAS approach (Conselice 2003) where merging galaxies are those with a high asymmetry, which is also higher than the value of the clumpiness. The simple condition:
 |
(9) |
accounts for a large fraction, but not all, of local galaxies which are mergers – i.e., ULIRGs and starbursts in mergers (see Figure 3). While the contamination from non-mergers is fairly low at a few percent, the fraction of actual mergers which are identified is roughly 50% (Conselice 2003). This is largely due to the fact that galaxies involved in the merger process are only quantitatively asymmetric for about a third of the life-time of the merger (see Section 3.4).
There is also the relationship found by Lotz et al. (2006) for locating major mergers using Gini/M20 parameters is given by,
 |
(10) |
A more recent criteria developed by Freeman et al. (2013) uses multi-mode (M), intensity (I), and deviation (D) statistics to quantify which galaxies are mergers. This study shows that a higher fraction of real mergers can be found using these indices compared with CAS or Gini/M20.
One ultimate result of finding these mergers is that it allows us to calculate the merger fraction within a population of galaxies. The basic merger fraction (fm) is calculated as the number of mergers selected within a given redshift bin and stellar mass limit (or luminosity cut) (Nm), divided by the total number of galaxies within the same redshift and stellar mass selection (NT). The merger fraction is thus defined as:
 |
(11) |
This merger fraction is also a function of stellar mass and redshift. The CAS mergers are nearly all major mergers (Conselice 2003, 2006b; Lotz et al. 2008), whereas Gini/M20 measures all types of mergers, both minor and major.
Furthermore for structural samples we are calculating the merger fraction, as opposed to the galaxy merger fraction. The difference is important when comparing with pair studies where the two progenitors can be resolved. The difference between these two is subtle, but important. The merger fraction considers a merger as having already happened, with the two galaxies that have merged now counted as a single system. The galaxy merger fraction is the fraction calculated when both of these galaxies merging are considered as two separate galaxies, which they were before the final merger.
The galaxy merger fraction (fgm) is thus the number of galaxies merging, where a system which has already condensed into a single galaxy is counted as two galaxies, divided by the number of galaxies in the total sample. For small merger fractions this ratio is about a factor of two larger than the merger fraction which counts only the merger remnants (Conselice 2006b). The equation to derive the galaxy merger fraction with observables through morphology, with the assumption that every merging galaxy has exactly two progenitor galaxies is given by,
 |
(12) |
This relation does not hold if a merger occurs with more than two galaxies (Conselice 2006b) although these are very rare (de Propris et al. 2007). The morphological measurement of the nearby merger fraction gives values of fm = 0.01 (de Propris et al. 2007). A discussion of the measurement of this at higher redshifts is included Section 4.3.
3.3. Galaxy Scale Properties and Galaxy Structure
One of the interesting facts about galaxies is that many of their characteristics can be explained by an underlying property, which is likely its halo or total mass (Caon et al. 1993; Disney et al. 2008). As an example, it was noted early on that galaxy light profile shapes of ellipticals correlated strongly with the radius or magnitude of a galaxy (e.g., Caon et al. 1993). This implies that the scale or mass of an elliptical galaxy has an influence on a galaxy's overall light profile and shape.
This can also be seen in the detailed structures of galaxies. In general it appears that on average galaxies with a higher degree of central concentration have larger total or stellar masses. This is also seen in the concentration index, which is another measure of the degree of light concentration, with more massive galaxies having a higher value of concentration (e.g., Conselice 2003). This concentration also correlates with the fraction of light in bulge and disk components. This relation is such that the more concentrated a galaxy is, the less likely it will contain a significant disk (e.g., Conselice 2003). In fact, it is likely that it is the fraction of bulge light which drives this correlation, with more massive systems more likely to have significant and concentrated bulges.
Concentration also separates galaxies with different star formation histories in the local and high redshift universe. In a study using the Sloan Digital Sky Survey (SDSS) Strateva et al. (2001) showed that non-star forming galaxies are more concentrated than star forming blue systems. This can also be seen with other overall galaxy properties (e.g., Allen et al. 2006; Conselice 2006). The light concentration for ellipticals also correlates with the mass of the central massive black hole (e.g., Graham et al. 2002; Savorgnan et al. 2013).
3.4. Numerical Simulations of Galaxy Structure
Simulations of galaxy formation are critical for interpreting and understanding the meaning of structural indices of galaxies. In fact, one of the first computer simulations of galaxy formation by Toomre & Toomre (1972) showed that the peculiar morphologies of galaxies seen in e.g., the Arp (1966) atlas were due to systems undergoing major mergers rather than some other cause. Since then, numerical simulations of galaxies have proven an effective method for interpreting the structures and morphologies of galaxies in both the local universe and at higher redshifts. In many ways this approach towards understanding galaxy morphology has just begun and promises to be a powerful and effective approach for interpreting the meaning of structure in the future.
Mihos & Hernquist (1996) was one of the first papers to demonstrate in detail how the peculiar galaxies seen in deep HST imaging were in fact due to the merger process using the TREESPH hydrodynamical method from Hernquist & Katz (1989). Interest in comparing simulated merger results with observables was largely in terms of starbursts and spectral energy distributions of galaxies (e.g., Barnes & Hernquist 1991). However, some attempts were made even very early to use these merger N-body models as a method of interpreting Hubble Space Telescope morphologies of galaxies (Mihos 1995).
Applying quantitative structural methods described in Section 2 to these numerical simulations of structural evolution was first carried out by Conselice (2006b) who used the CAS method to calculate the time-scale of the merger process on dark-matter particle simulations, finding a merger time-scale of ~ 0.3-0.8 Gyr for galaxies having a high enough asymmetry to be identified as an unambiguous merger (Section 3.2). This time-scale is critical for interpreting galaxy merger fractions through cosmic time, as it allows us to convert merger fraction to merger rates, and thus derive how mergers are driving galaxy formation. Using these results Conselice (2006b) measure that a typical galaxy undergoes 4.4-0.9+1.6 mergers from z ~ 3 to z ~ 0.
Conselice (2006b) also show that the time when a merger is asymmetric is distributed throughout the merger process, and is not located at one particular time. Nor would the merging systems always be identifiable as such when studied with the CAS parameters. In addition to giving a robust time-scale, Conselice (2006b) also show that only a fraction (about a 1/3) of a merging galaxy's time-sequence would be found through CAS as a major merger. The time-scale derived is also largely independent of the viewing angle of the merger and an asymmetry signal is only present within major mergers with mass ratios of 1:3 or greater.
The simulations used in Conselice (2006b) are however simple in that they do not include the effects of star formation or dust, which are well know to produce dramatic changes in morphology (e.g, Taylor-Mager et al. 2007; Section 3.4). When star formation and dust are added to simulations of galaxy structure the quantitative structural parameters measured are similar to those seen in nearby galaxies, and the measured structure correlates with other properties such as color in the same way it does for nearby galaxies (e.g., Lotz et al. 2008; Hambleton et al. 2011).
The paper Lotz et al. (2008) include the first measurements of CAS and Gini/M20 parameters on numerical simulations that includes old and young stars, star formation, gas and dust. Lotz et al. (2008) and later Lotz et al. (2010a, b) use GADGET/N-body/hydrodynamical simulations of galaxies when imaging the appearance of these galaxy mergers. Lotz et al. (2008) utilize disk galaxies of the same total mass, while Lotz et al. (2010a) investigate mergers with a variety of mass ratios, and Lotz et al (2010b) examine how the amount of cold gas mass in progenitor galaxies influences morphology. These simulation results are passed through the SUNRISE Monte-Carlo radiative transfer code to produce, as realistically as possible, how galaxies would appear based on the simulation output.
Lotz et al. (2008b, 2010a,b) further investigate the location in CAS and Gini/M20 parameter space for mergers in different scenarios, and for different properties of the merging galaxies. They investigate the time-scale for how long these simulated galaxies appear as a 'merger' based on where they fall in these non-parametric structural spaces (see Figure 6 for an example of these simulations). These papers also investigate how the dust, viewing angle, orbital parameters, gas properties, supernova feedback and total mass alter the structural merger time-scale. Lotz et al. (2008b; 2010a) find that most properties - the total mass, supernova feedback, viewing angle, and orbital properties of mergers have very little influence on the derived time-scales. The mass ratio and gas mass fraction of the merging galaxies affect the derived merger time-scales significantly however.
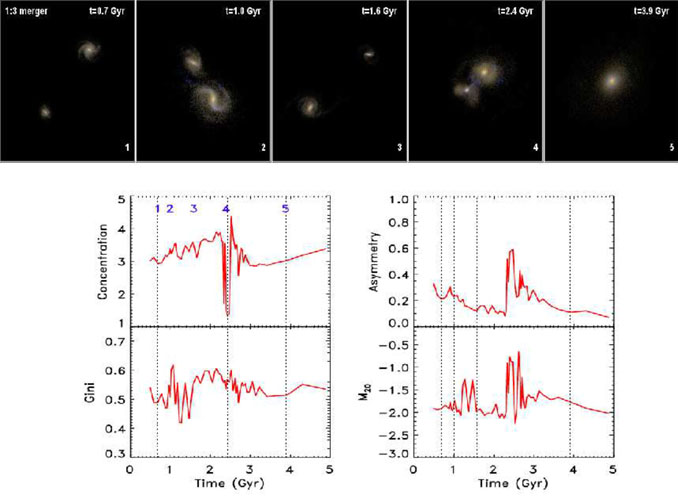 |
Figure 6. An N-body/hydrodynamical model from Lotz et al. (2008, 2010a, b) showing two equal size disk galaxies merging as a function of time. The numbers on the top of the realizations of this model show the various snap shots of time through the simulation while the bottom panel shows the changes in the asymmetry, Gini, concentration and M20 values for this particular simulation. This demonstrates the changing form of quantitative indices during a merger, and how these systems are only identifiable within the different morphological systems as a merger at specific times. (courtesy Jennifer Lotz) |
Mergers are identified within both CAS and Gini/M20 at the first pass of the merger, as well as when the systems finally coalesce to form a remnant (Lotz et al. 2008). However, merging galaxies are not found in the merger area of the non-parametric structural parameters for the entire merger. This however allows the time-scales for structural mergers to be calculated. Lotz et al. (2008, 2010a) find that the asymmetry time-scales for gas-rich major mergers are 0.2-0.4 Gyr, and 0.06 Gyr for minor mergers (Lotz et al. 2010a). The Gini/M20 time scales are τm = 0.2-0.4 Gyr. These are relatively quick time-scales, and thus suggests that the observed merger fraction converts to a high merger rate.
This is similar, but not exactly the same as what is calculated for merger time scales from dynamical friction for merging objects to have a separation change from ri to rf. The dynamical friction time-scale is given by, tfric,
 |
(13) |
where vc is the relative velocity between the two merging galaxies at a given time, M is the mean accreted mass, and the Coulomb logarithm ln Λ = 2 (Dubinski et al. 1999). Dynamical friction calculations such as these have dominated the calculation of galaxy time-scales up until simulations of mergers reveled more subtle results, although the blunt calculations from eq. (13) are often a good rough estimate for merger time-scales, giving values of ~ 0.5 Gyr for equal mass mergers.
Lotz et al. (2008b, 2010a) also find that the asymmetry index is sensitive to major mergers of ratios of 1:4 or less, while the Gini/M20 is sensitive for mergers down to 1:9 – thus probing more minor mergers. Lotz et al. (2010b) however find that very gas rich galaxies, such as those seen in high redshift may have longer time-scales for merging with gas rich progenitors which are likely to be more common at higher redshifts. This would provide a 'merger' asymmetry signal for more minor mergers as long as they were more gas rich. However it is clear that massive galaxies with M0 > 1010 M⊙, where most measurements have been made to date at z < 3, have a low gas mass fraction (e.g., Erb et al. 2006; Mannuci et al. 2010; Conselice et al. 2013)
1 Note that a major merger throughout this review is a merger where the ratio of the stellar masses of the progenitors are 1:3 or greater. A minor merger is one with a mass ratio of less than 1:3. Back.