


The above sections describe how we can measure the structures and morphologies of galaxies through various approaches, and the meaning of this structure. In this section I discuss how these measurements have been applied to galaxies at all redshifts to decipher how evolution is occurring within the galaxy population.
When galaxies were first found in the distant universe, they were not resolved enough to study their structures and morphologies, and the evolution of galaxies was observationally driven by number counting and colors (e.g., Koo & Kron 1992), with the 'faint blue galaxy excess' problem at faint magnitudes dominating the field for twenty years, until redshifts for these systems became available (e.g., Ellis 1997).
The problem of galaxy evolution and formation is a large one, and this review does not focus on this question. However, galaxy structure and morphology reveals information that cannot be provided by other methods. I do however give a brief overview here of the important questions in understanding galaxy evolution. For a general review of galaxy properties at z > 2 see Shapley (2011) for an observational perspective and Silk & Mamon (2012) for a theoretical one. For nearby galaxy's a few recent relevant reviews are Blanton & Moustakas (2009), van der Kruit & Freeman (2011), and Conroy (2013).
Galaxies are now studied up to redshifts z ~ 7-10, although at the highest redshifts less information is available. The most common measures for these distant galaxies are colors, stellar masses, star formation rates, sizes and basic structures. From this we know that the volume integrated star formation rate increases with time from these ultra-high redshifts until around z ~ 2 when the star formation rate begins to decline (see Madau & Dickinson 2014, this volume). Stellar mass measurements roughly agree with this picture, such that about half of all stellar mass is formed by z ~ 1 (e.g., Mortlock et al. 2011). Galaxies are also much bluer in the past (Finkelstein et al. 2012), with some debate and uncertainty concerning the star formation history of individual galaxies and the relevant role and commonality of very old and/or very dusty galaxies at redshifts z > 1.
What is largely unavailable from examining stellar masses, stellar populations and star formation histories is how these galaxies assembled. Clearly galaxies are fed gas, or have very large gas reservoirs in them to sustain and produce star formation. How this gas gets into galaxies is a fundamental question, as is the relative role of mergers vs. star formation in forming galaxies. Since the number of massive galaxies at high redshifts is a factor of ten or so less than those today, clearly much evolution and formation in these systems has occurred.
Galaxy structure provides a way to examine this problem, as it permits us to determine which modes of galaxy formation are active within a galaxy. The first and by far the most common method is to study the merger history through the techniques described in Section 3.2. Another method is to simply examine the visual morphologies of galaxies to determine when the Hubble sequence is in place, and after combining with color, size and star formation rates, to determine when spirals and ellipticals are roughly in their current form. In particular the examination of the sizes of galaxies has provided a very puzzling evolution such that galaxies of similar masses are up to a factor of 2-5 times smaller than corresponding galaxies seen today (e.g., Buitrago et al. 2008; Cassata et al. 2013).
Furthermore, resolved imaging allows us to study the formation history of individual components of galaxies, such as disks, bulges, spiral arms, clumps of star formation, etc which reveals formation information not available when examining the galaxy as a whole. This section, which is the heart of this review article, provides the current observational evidence for morphological and structural evolution and what it implies for galaxy formation.
4.1. Observed Evolution of the Hubble Sequence
The first science result I discuss is how the visual Hubble sequence evolves throughout the universe. This can simply be restated as measuring the number density and relative fractions of galaxy types at a given selection, which are classified as ellipticals, spirals and peculiars. As mentioned earlier, we do not consider irregulars as these are typically lower mass galaxies that are not detected at high redshift due to their faintness. It is also largely impossible to use finer classifications, such as Sa or Sb, on distant galaxies, as the resolution is not good enough, even with Hubble Space Telescope imaging, to resolve this type of detail. More distant galaxies also appear to be quite different from Hubble types, making this type of detailed morphologies unnecessary and undesirable (e.g., Conselice 2005).
This relates to a fundamental question that has been asked since galaxies were discovered, which is whether or not a galaxy retains its morphology over a long period of cosmic time. Otherwise, if morphological transformations do occur, what processes drive this (internal or external), and how often does a galaxy change its morphology?
One of the first observations noted when examining the first deep HST images was that many of the fainter galaxies were peculiar (e.g., Driver et al. 1995; Abraham et al. 1996; Schade et al. 1995). These early studies were limited to examining galaxy number counts, as no redshifts were known for these faint galaxies. In addition to a faint blue excess, it was clear that there was also a peculiar excess, and often for the faintest galaxies. This is where the field remained until redshifts for a significant number of these peculiar galaxies were obtained.
The field of high redshift studies changed dramatically in 1995-1997 with the advent of the both the Hubble Deep Fields (HDF) (Williams et al. 1996; Ferguson et al. 2001) and the discovery of a significant population of high-redshift galaxies that could be discovered by the Lyman-Break technique (Steidel et al. 1996; Shapley 2011) now referred to as Lyman-Break Galaxies (LBGs). The HDF, and later significant campaigns to obtain very deep Hubble imaging, such as the Hubble Deep Field South (Williams et al. 2000), the Great Observatories Origins Deep Survey (GOODS) (Giavalisco et al. 2004), the Hubble Ultra Deep Field (UDF) (Beckwith et al. 2006), the COSMOS field (Scoville et al. 2007), the Extended Groth Strip survey (EGS) (Davis et al. 2007), and most recently the CANDELS survey (Grogin et al. 2011; Koekemoer et al. 2011), have revolutionized the field of galaxy formation studies and in particular the study of morphologies.
The critical nature of these deep fields is not simply that they are deeper than previous deep HST imaging, but that they are the fulcrum of large-scale efforts to obtain photometry at the faintest levels possible at nearly all wavelengths. This allowed redshifts to be measured for most galaxies using photometry through so-called photometric redshifts (e.g., Dahlen et al. (2013) for a recent discussion of the use of this method). The availability of these redshifts allows us to measure evolution over broad redshift ranges which was not possible before as spectroscopic samples were few and far between, even with the use of relatively large multi-slit spectrographs such as LRIS on Keck (e.g., Cohen et al. 1996).
Early observations using a mixture of spectroscopic and photometric redshifts showed that the Hubble sequence was certainly not in place at high redshifts z > 1 (van den Bergh 1996) when examined using WFC2 data. This was verified in the rest-frame optical after deep near-infrared NICMOS observations of the HDF were taken in 1998 (Dickinson 2000). A deeper analysis of this showed that using the rest-frame optical structures of galaxies, the Hubble sequence was nearly completely absent at z > 2, and only at z ~ 1.5 did spirals and ellipticals become as common as peculiar galaxies (Conselice et al. 2005; Buitrago et al. 2013; Figure 7).
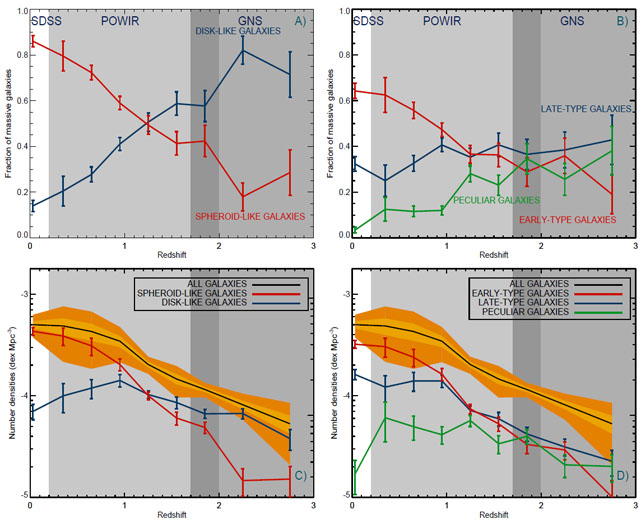 |
Figure 7. The evolution of apparent morphology, and Sérsic index based classifications for massive galaxies with M* > 1011 M⊙ from Buitrago et al. (2013). Shown are the morphologies and structures derived from three different surveys – SDSS for nearby galaxies, POWIR survey (Conselice et al. 2007) for systems up to z ~ 2, and the GOODS NICMOS Survey for systems for systems at z ~ 1.8 - 3. In this plot, disk-like galaxies are those with Sérsic indices n < 2.5, and spheroid-like galaxies are for those with n > 2.5. The right panel shows the morphological evolution as judged from visual estimates. Plotted here is both the fraction of types, as well as the number density evolution. The orange shading gives the total number density of all galaxies as a function of redshift up to z ~ 3. As can be seen, there is a gradual transition from galaxies that appear peculiar and 'disk-like' in their Sérsic indices at high redshifts z > 1.5 which gradually transform into early types today. |
The latest results on the evolution of visual morphology, as defined solely by visual types, from the CANDELS survey, is shown in Figure 8 (Mortlock et al. 2013) for systems with stellar masses M* > 1010 M⊙. It must be stressed that this figure only shows the visual estimates of galaxy morphology. The classification of a spiral, elliptical or peculiar does not imply that these galaxies have a certain star formation rate, color, mass or size. In fact what is often seen is that these visual morphologies do not correlate well with other physical properties (e.g., Conselice et al. 2011b; Mortlock et al. 2013). What is also seen is a stellar mass difference in the formation history of the Hubble sequence, with the highest mass galaxies appearing to form into visual ellipticals and disks before lower mass systems (Mortlock et al. 2013).
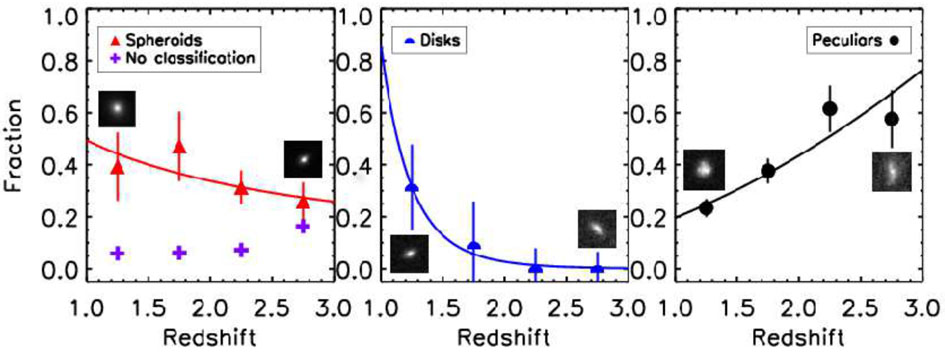 |
Figure 8. The latest version of the evolution of the Hubble sequence with redshift for galaxies with M* > 1010 M⊙. These classifications are corrected for image degradation such that misclassification due to distance are accounted for within these fractions (Mortlock et al. 2013). Examples of images of galaxies in each of these bins is shown in the observed H160-band or rest-frame optical. Further analysis shows that there is a downsizing trend such that the most massive galaxies form into Hubble sequence galaxies earlier than lower mass galaxies (Mortlock et al. 2013). |
What Figures 7 and 8 show is that at z > 2 the dominant morphological type is peculiar, while disks and ellipticals become more common at lower redshifts (see also Conselice et al. 2005; Kriek et al. 2009; Delgado-Serrano et al. 2010; Mortlock et al. 2013). Figures 9 and 10 show images of the most massive galaxies at both z < 1 and z > 2 in the Hubble Ultra Deep Field, demonstrating the stark differences between the two. This review later examines in Section 4.3 what these peculiars are potentially evolving into at lower redshifts. There is however a general trend such that peculiar systems, and galaxies with internal features such as blobs, have a higher star formation rate than smoother galaxies (e.g., Lee et al. 2013). This shows that while the Hubble sequence itself is not formed early in the history of the universe, there are trends which suggest it is becoming established.
 |
Figure 9. Galaxies in the Hubble Ultra Deep Field (UDF) as imaged through the ACS camera ordered by how asymmetric these systems are. These are all galaxies with redshifts 0.5 < z < 1.2 and with stellar masses M* > 1010 M⊙. The ID is the number used in Conselice et al. (2008), and the A value is the value of the asymmetry. At these redshifts most of the massive galaxies can still be classified as being on the Hubble sequence. |
 |
Figure 10. Similar to Figure 9, showing massive galaxies in the Hubble Ultra Deep Field (UDF) as imaged through the ACS camera ordered by the value of their asymmetries from most symmetric to asymmetric. Shown in this figure are systems with stellar masses M* > 1010 M⊙ at redshifts 2.2 < z < 3. These galaxies are typically much smaller, bluer, and have a higher asymmetry and inferred merger fraction than galaxies of comparable mass today (Conselice et al. 2008). |
Another interesting aspect to examine is not only the fraction of different galaxy types at various redshifts, but also their number density evolution as a function of galaxy type. We know from galaxy stellar mass measurements that the most massive systems are largely in place at z ~ 1 at the same number density as at z ~ 1 (e.g., Bundy et al. 2005; Mortlock et al. 2011). It is the lower mass galaxies which typically increase the most in terms of the relative number density from the epoch z ~ 0 - 2. In the nearby universe most of the massive galaxies are ellipticals, thus this implies that most of the evolution in morphology will also be within the lower mass galaxies, which is what is found. In additional to a mass downsizing, we also find a morphological downsizing, such that morphological ellipticals are formed before the other galaxy types, most notably the spirals. However, whether these galaxies are inherently similar to the ellipticals and disks today is a separate question.
4.1.1. THE FORMATION OF ELLIPTICALS AND DISKS - BARS, BULGES, DISKS, AND SPIRAL ARMS One of the major questions in galaxy evolution we would like to address is when modern spirals and ellipticals form. This is related to the formation of the Hubble sequence, but is a more detailed question, as what appears as an elliptical/spiral may be quite different from systems classified this way in the local universe. We thus are interested in determining when systems with the same morphology to galaxies we see in the local universe (i.e., disks and ellipticals) achieve a similar physical state as measured through other properties. While morphological fractions are similar at z ~ 0.5-0.8 as seen in the nearby universe, physical properties of galaxies with similar types - such as colors, star forming knots, and tidal features, have not reach the same level as locally. It is only recently at z < 0.3 that the galaxy population appears in most ways similar to that of today.
This question can also be further divided into many sub-questions, but for the purposes of this review I will examine the formation history of galaxies identifiable as disks and ellipticals in their gross morphology, as well as the formation of more detailed features such as spiral arms, bulges and bars.
One major issue is the bar fraction of galaxies and how it has evolved with time. Early studies found that the bar fraction evolves significantly (Abraham et al. 1999), while later studies find that bars were already in place up to z ~ 1 (Elmegreen, Elmegreen & Hirst 2004; Jogee et al. 2004). Using the two degree area COSMOS HST survey Sheth et al. (2008) find that the bar fraction increases from z = 0.84 to z = 0.2, from 20% to ~ 60% of all disk galaxies. Sheth et al. (2008) however find that the bar fraction is roughly constant with redshift for the most massive and red disk galaxies. In fact most of the observed evolution occurs for the lower mass bluer disk galaxies.
The fraction of spiral galaxies with bars tells us when the disks in these galaxies become dynamically mature enough to form these structures. The fraction of bars also allows us to determine if bars have a role in the evolution of star formation, bulge formation, and the triggering of AGN and the formation of supermassive black holes. The observational studies above all locate bars within disks either through changes in ellipticity and position angle in the surface brightness profiles of galaxies, or through visual inspection. It remains to be seen how the bar fraction holds when observed with a near-infrared band such as within the CANDELS survey.
A related issue is finding the onset of spiral structure, which has remained a problem for a variety of reasons, especially the difficulty of an unambiguous detection due to resolution/depth issues. Several papers published with the advent of ACS on HST showed that there are many examples of disk-like morphological systems at high redshifts. This includes the disks found by Labbe et al. (2003), the Luminous Diffuse Objects of Conselice et al. (2004) and later systems identified by Elmegreen et al. (2007) as clump-clusters. More recently, Law et al. (2012) discovered a galaxy with a likely bona-fide spiral structure at z = 2.18, which also contained a large internal velocity dispersion based on IFU spectroscopy. Spiral arms however appear very rare at high redshift, and likely only a small number are formed before z ~ 1. This is a major problem that needs more addressing and could be done with recently available data. However, there are many galaxies with clumpy features that are potentially spiral arms and disks in formation which we discuss in detail in Section 4.4.
Another feature of spirals and disks if the formation of bugles. While the traditional scenario is that bulges form in mergers (Section 4.3), recent results suggest that bulges can form in multiple ways. Psedo-bulges are different from classical bulges in that they are likely formed through secular processes within a disk. This can be seen in the different correlations between bulge properties and central massive black holes (e.g., Kormendy & Ho 2013).
While morphology itself can often be ambiguous in terms of matching with contemporary Hubble types, integral field unit (IFU) or long slit spectroscopy can remove some degeneracies. In particular the use of integral field spectroscopy on z > 1 systems reveals important clues about the nature of these high redshift galaxies (Förster Schreiber et al. 2009; Glazebrook 2013). Currently the most influential studies have been carried out with the SINFONI IFU on the VLT, as well as some work done with OSIRIS on Keck (Law et al. 2012).
These surveys, most notably the SINS collaboration (e.g., Förster Schreiber et al. 2009) find an equal distribution of different kinematic classes which are: rotationally dominated, mergers, and very compact galaxies with a high velocity dispersions (e.g., Buitrago et al. 2013b for massive galaxies). The true nature of these systems is not yet known, although in general it appears that galaxies at z > 2 which are clumpy tend to have high velocity dispersions. This perhaps reveals the formation modes of disk galaxies at high redshift results in a high velocity dispersion. The future looks promising for combining larger surveys of IFU measurements of distant galaxies with resolved morphologies to decipher evolution. Large surveys with for example KMOS on VLT and MOSFIRE on Keck will revolutionize this area in the coming years.
4.2. Size and Profile Shape Evolution
One of the most important findings in galaxy evolution studies in the past decade has been the discovery that distant galaxies are more compact than systems of the same mass in the local universe (e.g., Daddi et al. 2005; Trujillo et al. 2007; Buitrago et al. 2008; van Dokkum et al. 2008, 2010; Weinzirl et al. 2011; Baro et al. 2013; Williams et al. 2014).
This change in sizes with time is now well characterized, and the evolution of galaxy sizes at a constant stellar mass selection of M* > 1011 M⊙ can be characterized by a power law of the form Re ~ α (1 + z)β. The value of the power-law slope changes with the galaxy surface brightness type, such that the disk-like galaxies with Sérsic indices n < 2.5 evolve with β = -0.82 ± 0.03, while spheroid-like galaxies with n > 2.5 have β = -1.48 ± 0.04 (Figure 11). This demonstrates that there is a faster evolution in measured sizes for spheroid-like galaxies, which therefore have a more effective increase in size over cosmic time than the disk-like objects.
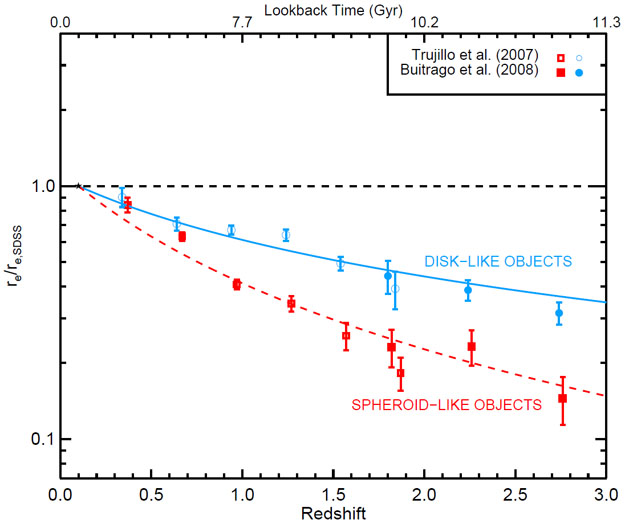 |
Figure 11. The average sizes of massive galaxies selected with M* > 1011 M⊙ as imaged in the POWIR (Conselice et al. 2007) z < 2 data and GNS > 1.5 images (Buitrago et al. 2008; Conselice et al. 2011). The size evolution is divided into galaxies with elliptical-like profiles, with Sérsic indices n > 2.5, and disk-like profiles having n < 2.5. The measured effective radius, re, is plotted as a function of the ratio with the average size of galaxies at the same stellar mass measurements with M* > 1011 M⊙ at z = 0 from Shen et al. (2003). |
This size evolution is such that the effective radii of massive galaxies increases by up to a factor of five between z = 3 and today at the same stellar mass (e.g., Buitrago et al. 2008; Cassata et al. 2013). The form of this evolution has been investigated to determine whether or not the increase is due to the build up of the entire galaxy or just the inner or outer parts. The data to date show that galaxy growth through sizes is occurring in its outer parts, with the central parts in place at early times (e.g., Carrasco et al. 2010; van Dokkum et al. 2010). This indicates that the build up of massive galaxies is an inside out process, whereby the inner parts of massive galaxies are in place before the outer parts with the same stellar mass density as today (e.g., Hopkins et al. 2009).
An alternative way to investigate this problem is to examine the number of compact and ultra-compact galaxies at various redshifts. There is some controversy over whether or not there exist in the local universe compact galaxies with sizes similar to those seen at high redshifts. However, what is clear is that the number densities of these ultra-compact galaxies declines in relative abundance very steeply at z < 2 (Cassata et al. 2013).
The processes responsible for this increase in sizes at lower redshifts is not well understood, and is currently a source of much debate. The most popular explanation is that this size increase is produced through minor mergers (e.g., Bluck et al. 2012; McLure et al. 2013), although other ideas such as AGN performing work on gas is another idea (e.g., Bluck et al. 2011). However, the outer parts of nearby massive galaxies are too old to have been formed in relatively recent star formation, and the star formation observed at high redshift is not sufficient to produce the observed increase in sizes (Ownsworth et al. 2012).
The major idea for the physical mechanism producing galaxy size evolution is through dry minor mergers, as major mergers are not able to produce the observation of increasing size without significantly increasing mass (e.g., Khochfar & Silk 2006; Naab et al. 2009; Bluck et al. 2012; Oser et al. 2012; Shankar et al. 2013). There is currently some controversy over whether or not the observed minor merger rate is high enough to provide this increase in sizes, with the most massive galaxies with M* > 1011 M⊙ appearing to have enough minor mergers (e.g., Kaviraj et al. 2009) to produce this size evolution (Bluck et al. 2012), but this may not be the case for lower mass systems (e.g., Newman et al. 2012). It does appear however that minor mergers are a significant mechanism for producing low levels of star formation in early-types at z ~ 0.8, as well as for adding significant amount of stellar mass to these galaxies (Kaviraj et al. 2009, 2011). One of the major issues is determining not only the number of minor dry mergers, but also the time-scale for these mergers (Section 3.4) which more simulations would help understand.
Along with the evolution of galaxy sizes, there is also a significant evolution in the underlying structures of galaxies at higher redshifts. One of the cleanest ways to see this is through the evolution of the Sérsic parameter, n (Figure 7). When examining the evolution of derived values of n as a function of redshift for both a stellar mass and at a constant number density selection, it is apparent that galaxies have lower n values at higher redshifts for the same selection (e.g., Buitrago et al. 2013). This has been interpreted by some to imply that these galaxies are more 'disk-like' at high redshifts (Bruce et al. 2012), although the morphologies of these systems by visual inspection, and their internal structures and colors, are not similar to modern disks (e.g., Conselice et al. 2011; Mortlock et al. 2013). It appears that these disk-like galaxies, while having light profiles similar to modern disks, are much smaller, have a higher stellar mass, and are often undergoing intense star formation with peculiar morphologies, making them un-disk-like in all other regards. They indeed are likely a type of galaxy with no local counterpart.
One of the primary, if not the primary use of galaxy structure at high redshift at the time of writing, is using it to measure the merger history of galaxies. This is a major issue in extragalactic astronomy, as merging is not only a method for galaxies to form, but is also a potential way in which black holes, star formation and other internal features of galaxies are assembled. Merging is also one of the key predictions of the Cold Dark Matter model which is the dominant idea for how galaxy evolution occurs through cosmic time (e.g., White & Rees 1978; Blumenthal et al. 1984; Cole et al. 2000).
The merger history of galaxies was first measured through galaxies in pairs - systems of at least two galaxies near enough to each other to merge in a reasonable amount of time (typically 20 or 30 kpc), and in the case of kinematic pairs with a low velocity difference of around 200 km s-1(e.g., Patton et al. 1997, 2002; Le Févre et al. 2000; Lopez-Sanjuan et al. 2011, 2012). Simulation results show that most pairs of galaxies selected in this way will eventually merge, and within a time-scale comparable to dynamical friction (e.g., Moreno et al 2013). Using pairs to find galaxies which are merging is still a large industry, and interested readers are referred to the latest papers in this field (e.g., Lopez-Sanjuan et al. 2011, 2012; Tasca et al. 2013). Pairs of galaxies also provide a check on the methodology we use to find major mergers, as it is an independent measure of this formation mode. However the merger fraction measured through pairs is more statistical in nature than structure, and does not reveal for certain whether a galaxy is a merger or not.
A detailed CAS structural study of starburst, ULIRGs, and other merging galaxies shows that another route for measuring the merger history is through the use of the asymmetry index, whereby the most asymmetric galaxies are ones involved in mergers (Conselice 1997; Conselice et al. 2000a, b; Conselice 2003; Section 3.2). The merger history is also measured through other parameters, whereby mergers occupy a unique parameter space (e.g., Lotz et al. 2004; 2008; Freeman et al. 2013).
While there is no perfect 1:1 relation between parameter space definitions of mergers with all mergers identifiable by eye, we still find that about half of all identifiable mergers fall within specific regions of parameter space, and that there is a low contamination from other galaxy types (Section 3.2). Thus, galaxy merger fractions are an observation which has to be interpreted carefully with the use of galaxy merger models.
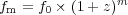
4.3.1. THE MERGER FRACTION EVOLUTION The merger fraction history is the basic observable which reveals how mergers are changing and evolving through cosmic time. It is measured at high redshift through the criteria described in Section 3.2, and the resulting merger fractions are shown in Figure 12 (e.g., Conselice et al. 2008, 2009; Bluck et al. 2012). This figure shows that the inferred merger fraction increases with redshift. This increase is typically fit as a power-law of the form:
 |
(14) |
where f0 is the merger fraction at z = 0 and m is the power-law index for measuring mergers. In general, the higher the value of m the more steeply the merger history increases at higher redshifts. An alternative parameterization of the merger history is given by a combined power-law exponential (e.g., Conselice et al. 2008) whose form is:
 |
(15) |
The local z = 0 merger fraction in this formalism is given by fm(0) = α exp(β), and the merger peak is located at zpeak = -(1 + m/β). This form of the merger fraction evolution appears to fit lower mass galaxy merger fractions better than a single power-law up to z ~ 3, as this allows for a peak at a value of the mergers and a decline at higher redshifts. In fact, only the highest mass galaxies with M* > 1010 M⊙ appear to increase up to z ~ 3, while lower mass galaxies have a merger peak around z ~ 1.5-2.5, and declining at higher redshifts (e.g., Conselice et al. 2008).
 |
Figure 12. A compilation of the merger fraction history for galaxies selected with stellar masses M* > 1010 M⊙ and M* > 1011 M⊙. The points shown here on the left panel are for M* > 1010 M⊙ galaxies, including results from Conselice et al. (2003) at z > 1 in the HDF (solid circles); Conselice et al. (2009) (solid boxes at z < 1.2); and Mortlock et al. (2013) (open boxes at z > 1). Also shown on the left panel are pair merger fractions at separations of < 30 kpc: (Man et al. 2012; crosses at z > 1); Lopez-Sanjuan et al. (2010) (large open boxes). The right panel shows the merger history for M* > 1011 M⊙ systems including results from Conselice et al. (2009) (solid boxes at z < 1.2; Bluck et al. (2009, 2012) (solid circles at z > 0.5); and Mortlock et al. (2013) (open boxes at z > 1). In both panels the line with the dark solid circles is the best fit relation for a merger fraction parameterization as ~ (1 + z)m. The blue dotted line on the left, and the red and cyan dashed lines on the right show the Warm Dark Matter predictions, and the solid black line the Cold Dark Matter predictions using semi-analytical models. For the M* > 1010 M⊙ panel we also show the merger fraction calculation from abundance matching using various WMAP and concordance cosmologies (shown on panel), as well as abundance matching from Stewart et al. (2008) (red crosses). |
While it initially appeared that there were significant differences in merger histories between different studies (e.g., Lin et al. 2004) it is now clear that these are due to several effects. The first is that the value of the power-law index m can vary significantly just due to the value of the anchor redshift at z = 0. Secondly, when comparisons are done between galaxies selected in the same way (stellar mass or absolute magnitude), and correct time-scales are used for different techniques (Section 3.4) then merger rates agree within the uncertainties (e.g., Conselice et al. 2009; Lotz et al. 2011).
The merger history tends to peak at z ~ 2.5 for massive galaxies with M* > 1010 M⊙ at values of fm ~ 0.3-0.4 and decline at lower redshifts. The values for m found in the literature can vary significantly, but most of this is due to different selections, different redshift ranges used, and the use of various values for the local merger fraction. The first studies using pairs find a very steep increase up to z ~ 1, with m = 2.8 ± 0.9 for a luminosity selected sample up to z ~ 0.4 (Patton et al. 1997). The value of m was later found by Patton et al. (2002) to be m = 2.3 ± 0.7 within the CNOC2 redshift survey up to z ~ 0.55. Le Févre et al. (2000) measure the merger fraction using 285 galaxies in the CFRS and LDSS surveys up to z ~ 1 finding a power-law index of m = 3.2 ± 0.6, although this lowers to m = 2.7 ± 0.6 after considering selection effects. Other studies have found similar values, with m = 1.5 ± 0.7 for brighter galaxies in the VVDS (de Ravel et al. 2009), and m = 3.1 ± 0.1 for pairs up to z ~ 1 in the COSMOS field (Kartaltepe et al. 2007). These are however all relatively nearby galaxies at z < 1. For higher redshifts, Bluck et al. (2009) find a power-law of m = 3.0 ± 0.4 for galaxies with M* > 1011 M⊙ using pairs from the GOODS NICMOS Survey.
Within morphological studies, Conselice et al. (2003) find a high m index of m ~ 4 for massive galaxies with M* > 1010 M⊙ , with m values around m ~ 1-2 for lower mass galaxies. This is similar to what is found by Le Févre et al. (2000) when examining the merger history of visually disturbed galaxies in Hubble imaging. This was confirmed by Conselice et al. (2008) using the same methods, but on the Hubble Ultra Deep Field data. Conselice et al. (2003) also show how the merger fraction slope m can vary significantly depending on what redshift limit is used, and whether stellar mass or luminosity cuts are applied to the selected sample. In a detailed study of z < 1 galaxies from the COSMOS survey, Conselice et al. (2009) find an index of m = 2.3 ± 0.4 for galaxies with stellar masses of M* > 1010 M⊙. On the other hand, Lotz et al. (2008) find that the merger fraction does not evolve significantly with redshift between z ~ 0.2 - 1.2, with a weak increase in the merger fraction with m = 0.23 ± 1.03 using the Gini/M20 methods. Later however it was shown that Gini/M20 is very sensitive to minor mergers, and once these effects are considered the fitted parameter is m = 2 up to z ~ 1.2 (Lotz et al. 2011). Other methods of measuring the merger or interaction rate includes looking for ringed galaxies (D'Onghia et al. 2008), a method which derives a merger fraction index with m ~ 3.
4.3.2. GALAXY MERGER RATE EVOLUTION The merger fraction is simply just an observational quantity, as it is the fraction of galaxies in a sample which have merged with another galaxy. This merger fraction can effectively be anything from zero to near unity depending on the mass ratio and time-scales of interest. Merger fractions must therefore be carefully interpreted. The physical quantity we are interested in is the merger rate, which gives the number of mergers occurring per unit time and in some cases per unit volume per unit time.
Bluck et al. (2012), Lotz et al. (2008) and Conselice (2006b) show that CAS is only sensitive to major mergers of mass ratios of 4:1 and greater, and has a particular time-scale of about ~ 0.5 Gyr associated with the merger sensitivity (Section 3.4). This is very similar to the merger parameter sensitivity when using pairs of galaxies with mass ratios of 4:1 or greater (i.e., major pairs). Thus by examining the merger fraction with CAS we are likely tracing the same systems as measured through galaxies in pairs.
The merger fraction is converted into a galaxy merger rate through the use of the merger time-scale, τm which can be derived through simulations (Lotz et al. 2010a) (see Section 3.4), or through the decline in the merger fraction at lower redshifts (Conselice 2009). The result of both approaches is that the CAS merger time-scale is around 0.5 Gyr for a galaxy to remain 'peculiar' in parameter space, with the merger time-scale in Gini/M20 at a similar level but which is more sensitive to minor mergers (Section 3.4).
Using the merger time scale, the merger rate per galaxy is thereby defined by the parameter Γ (e.g. Bluck et al. 2009; Conselice et al. 2009),
 |
(16) |
The value of Γ is in units of Gyr giving the average amount of time between mergers for a galaxy within the given selection property, typically stellar mass, and within a given redshift range. Note that within the definition of Γ the galaxy merger fraction is used rather than the merger fraction (Section 3.2). The value of Γ as a function of redshifts for CAS merger measures and pair selection mergers sample is shown in Figure 13.
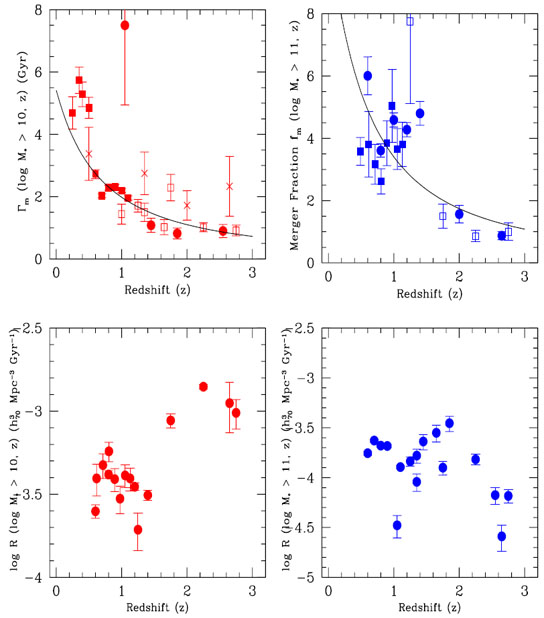 |
Figure 13. The merger rate for galaxies plotted in two different ways. The upper panels plot the merger rate per galaxies, Γ (z) at stellar mass limits of M* > 1010 M⊙ (left) and M* > 1011 M⊙ (right). The units of Γ are Gyr, and represent the average time between mergers for a typical galaxy at the given mass limit. The ultimate realization of the merger rate is shown at these two stellar mass limits in the bottom row, as the number of mergers occurring per Gyr per co-moving Mpc3. The point types in the merger rate per galaxy has the same meaning as the merger fraction plot in Figure 12. |
Using the evolution of the galaxy merger rate, per galaxy, Γ, the the number of mergers that occur between various redshifts is calculated by integrating the inverse of Γ over redshift,
 |
(17) |
The result of this is studied in detail in Conselice et al. (2009) and Bluck et al. (2009) with initial results using simulations discussed in Conselice (2006b). The result of these calculations show that the number of major mergers a galaxy undergoes between z = 3 and z = 1 is 4.3 ± 0.8 major mergers at z < 3 (Conselice et al. 2008) for galaxies selected with stellar masses M* > 1010 M⊙. There also appears to be a limited number of mergers at higher redshifts z > 3 (Conselice & Arnold 2009).
The Γ definition of the merger rate is per galaxy and thus does not take into account the overall merger rate within the universe. Thus ultimately we are interested in the galaxy merger rate, ℜ(M*, z)
 |
(18) |
where nm is the number density of galaxies at a given redshift. While this is the ultimate quantity in galaxy merger studies, it is difficult to measure, and the number density, nm, has its own associated uncertainties (e.g., Mortlock et al. 2011). In Figure 13 we plot the merger rate for galaxies using the CAS systems for pairs and mergers using the number densities of galaxies from Mortlock et al. (2011).
While the number of mergers is an interesting and fundamental quantity, we are ultimately interested in the amount of stellar mass added from mergers to galaxies over time. The total amount of stellar mass accreted into a galaxy is calculated as a double integral over the redshift range of interest (z1 to z2 or look-back times t1 and t2), and over the stellar masses range in which is being probed (M1 to M2), and can be expressed as,
 |
(19) |
where τm(M*) is the merger time-scale, which depends on the stellar mass of the merging pair (Bluck et al. 2012). From this we calculate the total integration of the amount of mass assembled through merging for galaxies with stellar masses M* > 1011 M⊙. For a z < 3 mass complete sample at this limit, Conselice et al. (2013) find a value M*,M / M*(0) = 0.56 ± 0.15, where M*(0) is the initial average stellar mass at z ~ 3, and M*,M is the average amount of stellar mass accreted in mergers at z = 1 - 3. This ratio is the fractional amount of stellar mass added both due to major and minor mergers for systems with stellar mass ratios down to 1:100 for an average massive galaxy after following a merger adjusted constant co-moving density (Conselice et al. 2013). By observing the number of mergers we can get an idea of how much gas is added to galaxies through the merger process. Comparing this to the star formation rate there is a large deficiency, which must be accounted for by gas accreted from the intergalactic medium. Using this number and the observed star formation rate within these galaxies, the gas accretion rate from the intergalactic medium is calculated at around 100 M⊙ year-1, adding roughly the same amount of stellar mass to these galaxies as mergers (Conselice et al. 2013).
4.4. Resolved Morphological Formation Histories
Independent of the formation of the gross, or bulk, galaxy structure is the formation of their stars, and how this correlates with structure and its assembly. This is effectively done by examining the spectral energy distributions of individual components in galaxies (i.e., disks or bulges) and/or a newer technique of examining the SEDs of individual pixels. With resolved imaging it is therefore possible to determine to some extend the star formation history of individual resolution elements (e.g., Abraham et al. 1999; Zibetti et al. 2009) as well as the stellar mass within these (e.g., Lanyon-Foster et al. 2007).
Early results using small samples of few dozen galaxies at z ~ 1, Abraham et al. (1999) demonstrated that many morphologically selected ellipticals in their sample show a diversity in their star formation histories, with recent bursts of star formation commonly seen. Abraham et al. (1999) also showed that bulges in these systems almost always have ages older than their disks. This was followed up with a study of 79 field spheroids by Menanteau et al. (2001) who find that a third of their morphologically regular systems have recent star formation in their centers, with so-called 'blue cores'. It is possible that some of these systems are forming the pseudo-bulges that we see in the nearby universe.
There are other studies of the bulges of distant galaxies, including Hathi et al. (2009) who find that bulges at 0.8 < z < 1.3 have ages of a 1-2 Gyr, with stellar masses up to 1010 M⊙ in the Hubble Ultra Deep Field. They also find that late type bulges are younger than early types, a finding which also exists in the local universe. However, classical bulges up to z ~ 1 with de Vaucouleur profiles are found to have old stellar populations similar to giant ellipticals at the same epoch (Koo et al. 2005).
Another potentially powerful approach towards understanding the formation history of galaxies is to examine their light distribution on a pixel by pixel basis. The idea here is that each pixel or resolution element is independent of others and each has their own SED which can be fit by stellar population analysis methods (e.g., Bothun 1986; Abraham et al. 1999; Lanyon-Foster et al. 2007). Local galaxies have different pixel color magnitude diagrams, depending on morphological type, with early types having a much narrow locus of points than disk galaxies.
Galaxies also often look more symmetrical in stellar mass maps than in light (Lanyon-Foster et al. 2012; Wuyts et al. 2012, Figure 14). Star forming galaxies in the CANDELS survey were recently studied in a pixel by pixel approach in Wuyts et al. (2012) who examined 323 systems at 0.5 < z < 1.5 and a further 326 higher redshift systems at 1.5 < z < 2.5. This study uses the optical ACS and near infrared WFC3 filters to construct SEDs for all pixels in these galaxies. Wuyts et al. (2012) find that the nuclei of star forming galaxies are redder and have older ages than their outer parts. Clumps in these galaxies also generally occupy a smaller fraction of the total mass than the total light, demonstrating that the large clumps seen in distant star forming galaxies are mostly star forming regions. Clumps are also found to be central, off-central, or outer, and these clumps may play a role in forming the bulges of these galaxies through a secular process (Bournaud et al. 2007; Elmegreen et al. 2008; Genzel et al. 2008) (Section 5). This shows that there are methods beyond hierarchical clustering for the formation of structures within galaxies.
 |
Figure 14. Internal pixel structures and profiles for galaxies at z ~ 1-2 with and without star formation. The examples are ID6726 which is a non-star forming galaxy, and ID12924 and ID1954 which contain clumpy star forming knots throughout their structures. These are representative examples of commonly found galaxies at high-redshifts, typically around z ~ 2 as seen in deep WFC3 images from surveys such as CANDELS. For each of these galaxies the top rows demonstrate the image in the IJH HST bands, the rest-frame (U-V) color map, and a map which indicates whether pixels belong to the inner (colored red), outer (green) or clump region (dark blue) for each galaxy. The solid black ellipses show the area which contains half of the rest-frame U-band light for each system. The second row for each galaxy shows the U-band light profile which is color coded by the pixel type labeled in the (U-B) color map and on the right by the location of the various pixels. The lines shown in the middle panels show the separation between the different spatial distributions. The bottom panel shows the distribution in terms of stellar mass. The vertical dashed line shows the resolution limit of WFC3. The final panel shows the stellar mass map for each system, with the inner solid and outer dashed lines showing the location of Re, mass and 2 Re, mass. From Wuyts et al. (2012) and courtesy of Stijn Wuyts. |
4.5. High Redshift AGN/Starbursts and Star Formation Quenching
One of the major ideas behind how mergers drive galaxy formation is that when galaxies merge, gas clouds collide, triggering star formation. At the same time gas is driven to the centers of galaxies, producing active galactic nuclei (AGN) (e.g., Hopkins et al. 2008). Observationally we also know that galaxies which are concentrated, with for example a high Sérsic profile, are more likely to be quenched (e.g., Bell et al. 2012; Fang et al. 2013). There is therefore a strong theoretical reason to expect that structure, as influenced by mergers, should correlate with galaxy formation. There is also strong evidence that the star formation in galaxies is regulated by structure. How these relate however is not yet clear.
Observational it has proven thus far difficult to correlate the presence of mergers, through either pairs or the presence of a distorted or peculiar structures, with the presence of AGN or a star formation excess at high redshift. Recent studies such as Cotini et al. (2013) use CAS indices to show that the fraction of nearby galaxies with AGN are roughly five times more likely than a control sample to have a distorted structure. However, studies at higher redshifts generally do not find that more asymmetric or merging galaxies have a higher AGN fraction (e.g., Grogin et al. 2005; Gabor et al. 2009; Kocevski et al. 2012). This is also found in the deepest ACS Hubble imaging, although it does appear that AGN are found in more concentrated galaxies at higher redshifts (Grogin et al. 2005). There is also a lack of a higher fraction of peculiar/merging galaxies found in the GEMS/STAGES HST survey by Bohm et al. (2013) for AGN with luminosities of LX < 1044 erg s-1. This may be an indication that Type-1 AGN are more likely to be found in early-type massive systems. It remains to be seen if obscured AGN, the Type-2s, are found in more merging systems and thereby represent an earlier phase of the merger.
Another major issue in which morphology and structure play an important role is understanding the origin of dusty star forming galaxies, the so-called ULIRGs or sub-mm galaxies. Sub-mm galaxies are those which appear very bright at sub-mm wavelengths, typically at 850 μm, and are at high-redshift at z > 1. Morphological analyses of these sub-mm galaxies showed early on that they are involved in merger activity, and have peculiar morphologies (e.g., Chapman et al. 2003; Conselice et al. 2003b). Many of these galaxies have structures and morphologies consist with being involved in mergers (e.g., Ricciardelli et al. 2010). Kartaltepe et al. (2012) find that a sample of ULIRGs selected from the CANDELS fields are more likely than a field galaxy sample to be involved in galaxy interactions and mergers (72-7+5% vs. 32 ± 3%). However, Swinbank et al. (2010) argue using a large sample of sub-mm galaxies that their morphologies are not significantly different from other star forming field galaxies at similar redshifts. Swinbank et al. (2010) also find that their sub-mm galaxies have light profiles more similar to early-types than disks. Although, Targett et al. (2011) find that sub-mm galaxies have disk-like profiles, and conclude that these systems are more like forming disks than spheroids forming in mergers. This suggests that the morphology of sub-mm galaxies is still open for debate with results that appear to be conflicting. More detailed work, likely with adaptive optics in the K-band to avoid issues with dust and morphological k-corrections, are needed to make further progress.
Furthermore, as mentioned earlier there is a strong observed correlation between galaxies which have steep surface brightness profiles, with n > 2.5, and the quenching of star formation (e.g., Bell et al. 2012). This shows that galaxy structure either produces a change in the galaxy history, or more likely is a symptom of the effects which produces this quenching. In general, there are a few ways to quench the star formation seen in galaxies at high redshift. Some of these are environmental, such as ram-pressure stripping and strangulation (e.g., Peng et al. 2010). However, these processes will be ineffective for the bulk of field galaxies which we study in this review. What is more likely driving the quenching of typical field galaxies is merger driven, or driven by the stellar/halo mass in some form of feedback process (e.g., Peng et al. 2010; Peng et al. 2012; Lilly et al. 2013; Carollo et al. 2013). The most likely candidates are mergers that either heats gas or removes most of it in giant starbursts, preventing further star formation. The other idea for this feedback is that it is the result of AGN. The idea here is that the ongoing star formation is truncated by the existing gas in a galaxy being heated or removed by an active AGN (e.g., Croton et al. 2006). It is therefore likely that a few critical processes are ongoing to produce the Hubble sequence, and specifically the red, passive and concentrated high mass systems.
By far the bulk of what we know of galaxy structural evolution is at z < 3. The reason for this is simply because this is the limit where we can observe the rest-frame optical using observations in the near-infrared from the Hubble Space Telescope, which is only effective at imaging at filters bluer than the H-band (often H160 with WFC3 and NICMOS). However, there are some observations of galaxy structure at even higher redshifts that provides some information about the formation of these galaxies. To date most of these observations are done in a red filter using the ACS camera on Hubble, either the I814 or z850 band. It must be remembered that these systems are being observed in the rest-frame ultraviolet, and thus their morphologies will be dominated by young stars.
There have only been a few major studies that focus on the structures of these ultra-high redshift galaxies. Ferguson et al. (2004) study the sizes and the axis ratios of Lyman-break galaxies (LBGs) galaxies up to z ~ 6 in the GOODS fields, finding that galaxies are smaller and more 'disk-like' in their axis ratios at higher redshifts. This was also shown in an extensive study of 4700 LBGs by Ravindranath et al. (2006) who find that 40% have exponential light profiles, 30% have de Vaucouleurs profiles, and the remaining 30% have multiple cores. The ellipticity distribution of these LBGs shows that these systems are skewed towards high values with є > 0.5, which cannot be explained by viewing disks and spheroids at various angles (Ravindranath et al. 2006). This is either an indication that these systems are mergers, or that star formation is distributed in the outer parts of these galaxies creating these elliptical structures.
For ultra-high redshift galaxies, Conselice & Arnold (2009) examine the visual morphologies and pair fractions of Lyman-break galaxies in the Hubble Ultra Deep Field ACS Filters from z ~ 4 - 6. These ACS data on the UDF still provide the highest resolution and deepest imaging of the most distant galaxies. Conselice & Arnold (2009) find that the fraction of z ~ 3-6 Lyman-break galaxies which are peculiar in appearance is roughly constant at ~ 30% throughout this redshift range. Conselice & Arnold furthermore demonstrate that many of the LBGs at these redshifts have tidal like features – fans, shells, etc. that resemble merger signatures seen at lower redshifts. The derived merger fraction from LBG pairs also agrees with the merger fraction based on CAS and visual estimates (Conselice & Arnold 2009; Cooke et al. 2010).
It is perhaps surprisingly easier to identify galaxies in pairs at these redshifts than at lower redshifts, as one can use the drop-out band to remove contamination, and thus ensure that two galaxies close by in the sky are at least at a similar redshift. This results in a smaller correction needed to calculate merger fractions, and thus the merger fraction in principle can be measured more accurately (Conselice & Arnold 2009). Jiang et al. (2013) similarly examine the rest-frame UV morphologies of 51 Lyman-α galaxies and 16 Lyman-break galaxies and find a merger fraction for the brightest galaxies of around 50%, and otherwise a diversity in morphology.
Most recently, using WFC3 data from the UDF Oesch et al. (2010) show that z ~ 7-8 galaxies are very compact with a typical size of 0.7 ± 0.3 kpc with little size evolution down to z ~ 6. There is more development down to z ~ 4 with the observation of more extensive wings of light at these lower redshifts, and a corresponding increase in sizes (e.g., Ferguson et al. 2004) following a similar power-law with redshift, as is found for size evolution between z ~ 3 and z ~ 0 (Buitrago et al. 2008; Mosleh et al 2012).
4.7. Role of Environment in Structure Formation
Galaxy morphology is well known to correlate strongly in the local universe with environment (e.g., Dressler 1984; Postman et al. 2005). It is also clear that there is a strong relationship between morphology and stellar mass, such that the most massive galaxies tend to have elliptical morphologies and lack star formation. Combining this with the morphology-redshift relation shows that the structure of a galaxy depends upon its mass, local environment, as well as time. Which of these is the leading cause for producing galaxy evolution is an active area of study.
The problem of galaxy morphology as a function of density is a large area of research and is outside the immediate scope of this article. However, it is relevant to discuss some of the major findings, and how they relate to the evolution of galaxy structure with time. The major effect of morphology is that the type of galaxy, either elliptical or spiral, depends to a large degree in the nearby universe on the local density of that particular galaxy's environment. This relation is such that the higher the density of the local environment, the more likely a galaxy will be early-type and non-star forming (e.g., Dressler 1984; Gomez et al. 2003; Blanton & Moustakas 2009). Disk properties are also highly environmentally driven, with few classical bulge or elliptical systems in low density environments (Kormendy et al. 2010).
It is also the case that more massive galaxies are more likely to be early type. The question is which relationship is more fundamental, and relates to the old issue of ”nature vs. nurture” for galaxy formation. The structures and morphologies of galaxies can help address this problem, especially by examining the limited number of observations we have of galaxy structure in high redshift overdensities, or (proto-)clusters.
Observations of overdensities at high redshifts are just starting in earnest, but already provide some clues to this. Very massive clusters at high redshifts, up to z ~ 1.2, contain a similar pattern of morphologies and densities as local galaxies, such that the denser areas contain a higher fraction of systems which are elliptical. This tends to break down for the limited number of cluster candidates found at higher redshifts, where the galaxy population is irregular and peculiar, as is found for the general high redshift galaxy population (e.g., Papovich et al. 2012).
Detailed studies are however possible up to z ~ 1 both by using field galaxies of various local environments, as well as looking at the morphological and structural distributions of galaxies within rich clusters at various redshifts. For field galaxies, Tasca et al. (2009) examine the morphology-density relationship for 100,000 galaxies in the COSMOS survey. They find that the morphology-density relation changes slightly with redshift, becoming flatter at higher-z (e.g., Grützbauch et al. 2011a, b). Above a stellar mass of about 1010.6 M⊙ the morphologies of galaxies appear to become more dominated by the stellar mass as the critical factor rather than density (e.g., Grützbauch et al. 2011a). The situation in rich clusters at z ~ 1, and the formation of S0s, is such that the trend with environment is not as steep as is found at z ~ 0. This suggests that S0s are not entirely formed yet in these distant clusters, however the elliptical population does seem to be in place compared with the population at z ~ 0.
Another structural feature that can be investigated is the size evolution and how it varies with environment. The limited number of investigations of this have found that galaxies at z > 1 in higher density environments show signs of a more rapid increase of galaxy size with redshift in comparison to the field (e.g., Cooper et al. 2012; Lani et al. 2013). This is one indication whereby a dense environment can facilitate a more rapid evolution in galaxies, although it is a slight effect that needs further confirmation.