


Over the past 18 years, a sea of published measurements of the cosmic SFRD or SMD at many different redshifts have used different data sets and methods. Much of the observational work has been carried out in deep survey fields that have accumulated outstanding multiwavelength data for this purpose and cover different angular scales to different depths (Figure 6). We dot not attempt a comprehensive review of this literature. Instead, we highlight key data sets and analyses from roughly the first decade of cosmic SFR measurements (1996-2006) and then focus on the most important or extensive recent measurements that we use in our analysis in Section 5. Hopkins (2004) and Hopkins & Beacom (2006) provided an extensive compilation of SFRD measurements up to 2006, whereas Wilkins et al. (2008a) summarized SMD derivations through 2007. Other authors have also compiled these data more recently (e.g., Behroozi et al. 2013).
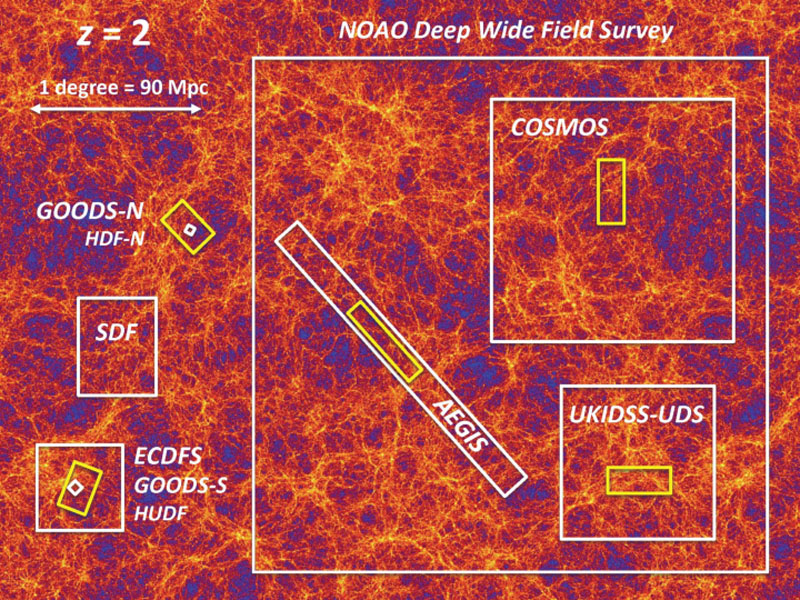 |
Figure 6. Relative sizes of the regions on the sky observed in several important surveys of the distant Universe. The two Great Observatories Origins Deep Survey (GOODS) fields, the Subaru Deep Field (SDF) and the Extended Chandra Deep Field South (ECDFS), are shown on the left. Very-deep surveys such as the Hubble Deep Field North (HDF-N) and the Hubble Ultradeep Field (HUDF) [Advanced Camera for Surveys (ACS) area shown], which are embedded within the GOODS fields, can detect fainter galaxies, but cover only very tiny regions on the sky. Other surveys such as the Cosmic Evolution Survey (COSMOS), the UK Infrared Deep Sky Survey (UKIDSS), the Ultradeep Survey (UDS), the All-Wavelength Extended Groth Strip International Survey (AEGIS) and the National Optical Astronomy Observatory (NOAO) Deep Wide Field Survey cover wider regions of the sky, usually to shallower depths, i.e., with less sensitivity to very faint galaxies. However, they encompass larger and perhaps more statistically representative volumes of the Universe. The yellow boxes indicate the five fields from the Cosmic Assembly Near-Infrared Deep Extragalactic Legacy Survey (CANDELS), each of which is embedded within another famous survey area. The image in the background shows a cosmological N-body simulation performed within the MultiDark project (see http://www.multidark.org/MultiDark/), viewed at z = 2, more than 10 Gyr ago. The colors represent the matter density distribution in a slice 43-Mpc thick, or Δ(z) = 0.03 at that redshift, and all lengths are given in comoving units for h = 0.7. Small surveys may sample under- or over-dense regions, whereas larger surveys can average over density variations, but may not be sensitive to the ordinary, relatively faint galaxies that are most numerous in the Universe. Averaging over redshift intervals that are greater than that shown in the background figure will smooth over density variations, but for any redshift binsize cosmic variance will be smaller for wider surveys or when a survey is divided into fields sampling multiple, independent sightlines. |
The number of papers that present measurements of the cosmic SFR history vastly exceeds the number of different data sets that have been used for this purpose because certain well-trodden surveys such as the HDF-N, the Hubble Ultradeep Field (HUDF), GOODS, and COSMOS have been used repeatedly by many groups or by the same groups who continue to refine their analyses or add new observational information. One should thus be cautious compiling results from many different studies: Although the analyses are independent, the data used and the actual galaxies measured may not be different. For example, the SFH of GOODS-South and COSMOS are particularly well studied, but true cosmic variance due to clustering in those fields will not cancel out from one analysis to another.
The largest number of analyses of the cosmic SFRD have used rest-frame ultraviolet continuum measurements, largely because the method is quite sensitive (see Figure 1) and can be applied over a very broad range of redshifts. Rest-frame FUV (1,500 Å) SFRs at 1.4 < z < 6 can be measured using optical photometry that is (relatively) easily obtained with ground-based or HST imaging. The heavy use of photometric redshifts in recent years has led to much work based on imaging data alone, with little or no spectroscopy. However, in popular deep survey fields such as GOODS or COSMOS, the photo-z' values are typically well calibrated thanks to the widespread availability of thousands of spectroscopic measurements. At z < 1, rest-frame UV measurements ideally require space-based telescopes such as GALEX or HST to reach rest-frame wavelengths near 1,500 Å, but several studies have used blue or U-band imaging to sample mid-UV wavelengths (e.g., 2,800 Å) at z < 1 instead.
The modern era of SFRD measurements arguably began with the analysis of Lilly et al. (1996), who were the first to combine a large and deep (for its time) spectroscopic redshift survey with multiwavelength photometry and to derive LFs and luminosity densities at several different rest-frame wavelengths, including the rest-frame UV. The Canada-France Redshift Survey (CFRS) was carried out using the 4-m Canada-France-Hawaii Telescope and mainly surveyed the Universe out to z < 1. The available BVIK-band photometry permitted direct measurement of 2,800-Å rest-frame luminosities at z > 0.5, and down to z ≈ 0.3 with modest spectral extrapolation. Lilly et al. found that the 2,800-Å luminosity density declined by approximately one order of magnitude from z = 1 to the present, which they interpreted as a steep decline in the SFRD.
Madau et al. (1996) used the then-new HDF observations to extend this analysis to much higher redshift. They employed color-selected LBG samples at < z > = 2.75 and 4. The deep HST WFPC2 photometry allowed luminosities to be measured at 1,500 Å in the rest frame, reaching fainter than contemporaneous ground-based LBG data at z ≈ 3 from Steidel et al. (1996) and thus integrating further down the LF. Madau et al. (1996) quoted only lower limits for the SFRD, without extrapolation to fainter luminosities (relatively small, given the depth of the HDF imaging) and without correction for dust absorption (significant, but at the time little known). Later analyses (e.g., Sawicki et al. 1997, Madau et al. 1998b, Steidel et al. 1999) fit Schechter LFs to the photometric samples to extrapolate to total UV luminosity densities. Connolly et al. (1997) and Pascarelle et al. (1998) combined the optical HST imaging of the HDF with ground-based NIR data to improve photometric redshift analyses in the "redshift desert" at 1 < z < 2, between the regime of Lilly et al. (1996) and that of Madau et al. (1996). Taken together, the HDF measurements at z > 1 and the CFRS measurements at z < 1 suggested a general "rise and fall" picture of a UV luminosity density and, by inference, the cosmic SFH that peaked somewhere between z ≈ 1 and 2.
Various surveys subsequently extended this finding using other data sets or different analyses. Several groups reanalyzed the HDF (and later the HDF-South) data in various ways or made use of deeper spectroscopic surveys with the Keck telescope. Cowie et al. (1999) and Wilson et al. (2002) combined Keck spectroscopy in several fields with deep U-band imaging to measure shorter rest-frame UV wavelengths (,2000-2,500 Å) at z < 1 than were probed in the CFRS analysis of Lilly et al. (1996) and derived a shallower rate of decline in the SFRD. Wolf et al. (2005) used 17-filter intermediate and broadband imaging to obtain high-quality photometric redshifts at z < 1.25 in the Extended Chandra Deep Field South and analyzed the 2,800-Å luminosity density evolution.
Ideally, UV rest-frame observations at z < 1 should be done from space telescopes to sample shorter UV wavelengths than those used in the ground-based studies by Lilly, Wilson, Wolf, and others. In early work, Treyer et al. (1998) and Sullivan et al. (2000) used the FOCA balloon-born UV telescope to measure 2,000-Å luminosity densities at z ≈ 0.15. GALEX has since provided vastly more FUV data, including both wide-area and deeper surveys. Wyder et al. (2005) combined GALEX all-sky imaging survey data with distances from the 2dF Galaxy Redshift Survey (2dFGRS) over 56 deg2 to measure local (z ≈ 0.055) LFs at 1,500 Å and 2,300 Å. Budavári et al. (2005) analyzed a similar total sky area using somewhat deeper GALEX data and SDSS-derived photometric redshifts to compute LFs and densities at z < 0.25. Salim et al. (2007) and Robotham & Driver (2011) have since analyzed much larger GALEX data with SDSS data to cover as much as 830 deg2. Robotham & Driver presented a straightforward derivation of the UV luminosity function (UVLF) and luminosity density, whereas Salim et al. used GALEX photometry as one ingredient to derive SFRs and the total SFRD.
Arnouts et al. (2005) combined much deeper GALEX observations with spectroscopy from the VIMOS VLT Deep Survey (VVDS) and derived 1,500-Å rest-frame LFs at 0.2 < z < 1.2. Schiminovich et al. (2005) integrated these LFs to determine the 1,500-Å luminosity density, measuring evolution consistent with ρFUV ∝ (1 + z)2.5. This remains the most direct and frequently cited GALEX study of FUV luminosity densities at z < 1, which is somewhat surprising, as there are many more deep GALEX observations in fields with extensive spectroscopy (COSMOS, AEGIS, GOODS, etc.). Yet, to to our knowledge, there have been no other published LFs. The Arnouts/Schiminovich analysis is admirable, but it used only ~ 1,000 galaxies with spectroscopic redshifts over the whole range Δ z = 1 in a single field covering 0.5 deg2. Hence, it may be subject to cosmic variance issues. This area is quite ripe for further exploitation of existing archival data.
HST is the only other modern space telescope with UV capabilities, particularly with the UVIS channel of the WFC3 camera. Until recently, only one 50-arcmin2 field in GOODS-South has been surveyed to interesting depths to study distant galaxies (Hathi et al. 2010, Oesch et al. 2010). At z < 1.4, where these data measure FUV rest-frame emission, the survey volume and counting statistics are poor. These data have also been used for Lyman break color selection at z ≈ 1.5-2. The analyses generally support relatively steep UVLFs with α < -1.5 with large uncertainties. Expanded WFC3 UVIS observations in the HUDF and GOODS-North field have been recently completed and should improve the existinf measurements somewhat. A recent WFC3-UVIS survey of gravitationally lensed galaxies behind the massive cluster Abell 1689 (Alavi et al. 2014) has been used for Lyman break color selection to unprecedentedly faint FUV luminosities at z ≈ 2 to MAB ≈ -13, or ~ 1,000 times fainter than L∗ at that redshift. Alavi et al. (2014) found no turnover to the LF down to those limits and measured a faint-end slope α = -1.56 ± 0.13.
Cucciati et al. (2012) analyzed a larger, deeper and more complete spectroscopic sample in the same VVDS survey field studied by Arnouts et al. and Schiminovich et al. They fit SED models to multiband photometry from the U- to the K-bands to extrapolate flux density measurements to FUV rest-frame wavelengths at z < 1.4. They demonstrated consistency with the GALEX luminosity densities from Schiminovich but did not make direct use of the GALEX data. Although the largest and deepest spectroscopic sample used to derive UVLFs at 0 < z < 2, it is based on only one sightline and requires SED extrapolation to rest frame 1,500 Å at lower redshifts. Tresse et al. (2007) presented a similar, earlier analysis using shallower spectroscopy in two VVDS fields.
Over many years, Steidel and collaborators have carried out an extensive campaign of Keck spectroscopy for Lyman break-selected galaxies, especially at z ≈ 2 and 3 (Steidel et al. 2003, 2004). Their survey covers many widely-spread sightlines and provides excellent control over cosmic variance. Among several LF analyses from these data, the most recent and definitive are those of Reddy et al. (2008) and Reddy & Steidel (2009). These still rely on deep photometric color-selected samples to probe the faint-end of the LF, but with a degree of spectroscopic confirmation and calibration for brighter galaxies that is unmatched by any other survey. The use of UV rest-frame selection means that any LBG-based study will miss heavily dust-obscured star formation at these redshifts, but as a measure of the evolving UV luminosity density the LBG surveys have provided the most robust method to date.
At higher redshifts, 4 < z < 7, deep HST observations (discussed below) have dominated surveys for LBGs in recent years, but several ground-based imaging programs have made significant contributions, particularly surveying wider areas at (relatively) shallower depths to constrain the bright end of the LF. The Subaru telescope and its SuPrime Cam imager have been particularly important in this respect, although deep IR imaging from UKIRT and the VLT have also been used. Notable examples (not an exhaustive list) include Ouchi et al. (2004), Yoshida et al. (2006), Iwata et al. (2007) and McLure et al. (2009) at z = 4 to 6 and Ouchi et al. (2009), Castellano et al. (2010a, b), Bowler et al. (2012), and Tilvi et al. (2013) at z ≈ 7.
The installation of the Advanced Camera for Surveys (ACS) enabled substantially more efficient optical HST imaging that covers fields much wider than the original HDF. ACS also offered significant gains in sensitivity at the reddest wavelengths, making Lyman break selection practical out to z ≈ 6. Two major ACS surveys led to new derivations of the cosmic SFRD. GOODS (Giavalisco et al. 2004b) observed two independent fields with combined area > 60 times larger than the HDF through four filters. This provided a sample of several thousand Lyman break candidates at z ≈ 4 and of order 1,000 at z ≈ 5, reaching significantly fainter than L∗ and permitting robust characterization of the luminosity density. LBG selection at z ≈ 6 was less secure from GOODS ACS data alone, as it was based on a single color (i - z) and could sample only relatively bright galaxies. The HUDF (Beckwith et al. 2006) observed a single ACS pointing (~ 11 arcmin2) located within the GOODS-South region with very long exposure times and reaching fainter than the original HDF and with better sensitivity at higher redshifts. Both GOODS and the HUDF have been repeatedly revisited with new observations from HST over the years to add deeper optical imaging as well as NIR data, first from NICMOS (Thompson et al. 2006, Conselice et al. 2011) and later with WFC3 in the HUDF09 and HUDF12 programs (Bouwens et al. 2011b, Ellis et al. 2013) and the Cosmic Assembly Near-Infrared Deep Extragalactic Legacy Survey (CANDELS) of several premier deep survey fields including GOODS (Grogin et al. 2011, Koekemoer et al. 2011). These IR observations make Lyman break selection at z ≈ 6 far more robust and extend the method out to z ≈ 8, with a handful of unconfirmed candidates identified out to z ≈ 12.
Early analyses of the GOODS data (Giavalisco et al. 2004a) found evidence for relatively mild evolution of the UV luminosity density from 2 < z < 5 and clear evidence that there were fewer high-luminosity galaxies at z ≈ 6 (Stanway et al. 2003, Dickinson et al. 2004). Subsequent studies have repeatedly mined the combined GOODS+HUDF observations, using deeper data and more rigorous analyses. At least 20 papers about high-redshift LFs using WFC3 data in the HUDF and GOODS/CANDELS have been published since 2010, augmenting at least a dozen others pre-WFC3. We cannot attempt to review them all here, but they have convincingly demonstrated that the UVLF evolves significantly at z > 4. The current consensus is that this is primarily luminosity evolution, at least at 4 < z < 7, with L∗ brightening over time (e.g., Bouwens et al. 2007, Grazian et al. 2011, Bouwens et al. 2012b). As a result, the number density of bright LBGs increases rapidly with time, more quickly than does the integrated luminosity density. Analyses using the CANDELS and HUDF09+12 NIR imaging point to continued evolution out to z = 8 and perhaps beyond (Oesch et al. 2012, Yan et al. 2012, Lorenzoni et al. 2013, Schenker et al. 2013), although it would be prudent to recall that only a handful of galaxies at z ≈ 7 have reasonably secure spectroscopic confirmation and none at z > 7.5. There is broad agreement that UV spectral slopes for LBGs are bluer at z > 4 than at lower redshifts (Bouwens et al. 2012a, Finkelstein et al. 2012a, Dunlop et al. 2013), which has implications for their dust extinction and total SFRD. Most of these studies have examined the faint-end slope of the LF, measuring very steep values, in some cases approaching or exceeding the divergent value α = -2 (Bouwens et al. 2012b, McLure et al. 2013). Several studies have also extended SFRD analyses to 9 < z < 12, using data from the HUDF (Bouwens et al. 2011a, Ellis et al. 2013) or from lensing cluster studies (Coe et al. 2013). Although still in flux as better data accumulate, these measurements have considerable significance for the earliest phases of galaxy evolution and for the reionization of the IGM (e.g., Robertson et al. 2013), but relatively little impact on the global star-formation budget of the Universe. According to current estimates, only ~ 1% of the cosmic SMD present today was formed at z > 6.
IRAS enabled the first measurements of the local FIR luminosity function (FIRLF) (Lawrence et al. 1986, Soifer et al. 1987, Saunders et al. 1990, Sanders et al. 2003). These were typically measured either at 60-μm observed wavelength or using FIR luminosities integrated over a broader wavelength range. They were also generally extrapolated from the measured IRAS fluxes using fitting formulas. Although various representations of FIR luminosity have been adopted, here we consider LIR as the luminosity integrated over the range 8-1,000 μm, which encompasses most of the bolometric luminosity of dust emission from nearly all sources of interest. The longest wavelength IRAS band was at 100 μm, but AKARI extended all-sky FIR measurements out to 160 μm to provide more reliable measurements of the bolometric luminosity and reduced bias against galaxies with cold dust temperatures. Goto et al. (2011a) and (2011b) reanalyzed the local IRLF incorporating AKARI data. Despite differences in detail, the results are largely consistent with previous IRAS measurements in the luminosity range of overlap. LFs have also been measured for IRAS samples selected at 12 and 25 microns (Rush et al. 1993, Shupe et al. 1998). LFs at longer IR wavelengths were measured for (rather small) local samples with ISO [90 μm (Serjeant et al. 2004); 170 μm (Takeuchi et al. 2006)], Herschel (250-500 μm) (Dey et al. 2010, Vaccari et al. 2010), and with ground-based (sub)-millimeter observations generally for IRAS-selected samples [1.2mm (Franceschini et al. 1998); 850 μm (Dunne et al. 2000)]. New, large-area measurements using the largest Herschel surveys (e.g., H-ATLAS, covering 550 deg2 with observations from 100 to 500 μm) have not yet appeared in the literature.
Nearly all studies found that the bright end of the IRLF cuts off less sharply than does the exponential used in the Schechter function. This has typically been modeled either as a double power law (e.g., Lawrence et al. 1986, Sanders et al. 2003) or as a combined log-normal and power law (e.g., Saunders et al. 1990). Locally, the bright end of the IRLF is dominated by galaxies with warmer dust temperatures, which tend to be starburst galaxies and dusty AGN (Saunders et al. 1990). Several studies have measured a steep faint-end slope α (dN / dL ∝ Lα), e.g., α = -1.6 (Sanders et al. 2003), α = - 1.8 (Goto et al. 2011a), and α = -1.99 (Goto et al. 2011b). However, other studies have found flatter distributions, e.g., α = -1.2 to -1.0 (Saunders et al. 1990, Takeuchi et al. 2003, Vaccari et al. 2010). In practice, the faint-end has not been well-sampled locally except in a few of the IRAS surveys. Future analysis of the widest Herschel surveys may help resolve this.
In local, relatively quiescent spiral galaxies such as the Milky Way, more than half of the FIR luminosity is believed to arise not from dust in active star-forming regions, but from dust in the general ISM that is heated by ambient starlight from intermediate- and older-age stellar populations (Lonsdale Persson & Helou 1987, Sodroski et al. 1997). The luminosity of the Milky Way is typical (LIR ≈ 1010 L⊙ (Sodroski et al. 1997) compared with the knee of the local IRLF at LIR∗ = 1010.5 L⊙ (Sanders et al. 2003). This implies that a significant fraction of the local IR luminosity density is not the direct result of young star formation. Thus, it may not be a good measure of the global SFR today. At higher redshift when the specific SFR of typical galaxies was much larger and the net dust extinction to star-forming regions was, on average, larger (see Section 5.1), we may expect the IRLF and its integral to more reliably trace the total SFRD. However, Salim et al. (2009) suggested that, even at higher redshift (z ≈ 0.7), intermediate-age stars may significantly contribute to MIR dust emission observed by Spitzer at 24 μm.
The deepest surveys with ISO at 15 μm detected a few hundred galaxies, mainly at z ≤ 1, in the HDF and a few other deep survey regions where spectroscopic and photometric redshifts were available (Rowan-Robinson et al. 1997, Flores et al. 1999, Aussel et al. 1999). Analyses of these generally agreed that the emission from dusty star formation increased steeply with redshift, although statistics were generally too poor to construct redshift-dependent LFs. Chary & Elbaz (2001) used measurements from ISO and SCUBA as well as constraints from the FIR background as measured by the COBE satellite to constrain a model for the evolution of the cosmic SFH. Their model exhibited a sharp decline in the SFRD by a factor of 10 or more from z ≈ 0.8 to the present, with a plateau of nearly constant star formation at 0.8 < z < 2. At higher redshifts, the SFRD was more poorly constrained. Submillimeter sources placed a rough lower bound, whereas the cosmic infrared background (CIRB) set an upper limit. Acceptable solutions ranged from flat evolution to an increase by a factor of ~ 10 from z = 4.5 to 2.
Spitzer greatly enhanced the sensitivity and mapping efficiency for deep IR observations, particularly at 24 μm where the beam size (FWHM ≈ 5.7") was small enough to enable relatively straightforward association with optical counterparts. Spitzer also observed in an era when very large spectroscopic redshift surveys were available or underway and when photometric redshift techniques were well established. Le Floc'h et al. (2005) produced an early, seminal analysis of 24-μm sources at 0.3 < z < 1.2 in the Extended Chandra Deep Field South. Integrating over derived IRLFs, they inferred an evolution of the IR luminosity density proportional to (1 + z)3.9 ± 0.4, significantly steeper than the evolving UV luminosity density, ρFUV ∝ (1 + z)2.5 (Schiminovich et al. 2005). With strong luminosity evolution, the fraction of the IR luminosity density produced by LIGs and ULIGs evolved even more steeply: Le Floc'h et al. (2005) found that galaxies with LIR > 1011 L⊙ produced 70% ± 15% of the IR luminosity density at z ≈ 1, compared with 5-15% today, depending on the adopted local LF. Several analyses of LFs, mainly at z < 1, using shallower Spitzer data covering significantly wider areas have also been published. These includes Babbedge et al. (2006) and Rujopakarn et al. (2010) at 24 μm and Patel et al. (2013) at 70 μm and 160 μm. The work by Rujopakarn et al. (2010) is particularly notable for its combination of (relatively) wide area (9 deg2), extensive spectroscopic redshifts (4,047 galaxies with z ≤ 0.65), and 24-μm sensitivity (0.27 mJy, sufficient to reach ~ L∗ out to z = 0.65), making it arguably the best bridge study to date between local (IRAS and AKARI) measurements and deep-field studies at z ≥ 1.
Several studies extended Spitzer 24-μm-based LF measurements to higher redshifts, z ≈ 2 to 2.5 (Pérez-González et al. 2005, Caputi et al. 2007, Rodighiero et al. 2010). Such studies primarily use deeper 24-μm data and fainter spectroscopic and photometric redshifts available in the two GOODS fields. [Pérez-González et al. (2005) used shallower 24-μm data, whereas Caputi et al. (2007) and Rodighiero et al. (2010) employed deeper data from the GOODS team. Rodighiero et al. (2010) also incorporated relatively shallow Spitzer 24-μm data covering 0.85 deg2 in one of the VVDS redshift survey fields.] Dependenig on the analysis, these studies all found flatter IR luminosity density evolution at higher redshifts with modestly lower or higher ρ(LIR) at z = 2 than at z = 1. All three studies also found that the characteristic IR luminosity LIR∗ brightened further at z > 1, such that ULIRGs emitted either close to 50% of the total energy density at z ≈ 2 (Caputi et al. 2007, Rodighiero et al. 2010) or the majority of it (Pérez-González et al. 2005).
Depending on the data, methodology, and assumptions that are used, IRLFs estimated at high redshift have differed at both the faint and bright ends. At the faint end, the available data rarely constrain the slope of the LF at high redshift. Indeed, as noted above, there are significant differences in the faint-end slopes that have been measured at z ≈ 0. Data with a limiting 24-μm flux density of 80 μJy (as found for most of the earlier Spitzer studies described above) reach only a factor of a few fainter than typical estimates of LIR∗ at z ≈ 1, and they barely reach LIR∗ at z ≈ 2. Thus, most analyses are forced to assume a faint-end slope based on measurements at lower redshifts, making them subject to large (typically > 100%) and uncertain extrapolations to total IR luminosity densities.
Moreover, depending on the SED templates that are adopted, there are significant differences in the (large) extrapolations from observed MIR rest-frame measurements (e.g., 8-μm rest-frame at z = 2) to the bolometric IR luminosity and SFR. Indeed, we expect such variations among real galaxies. Compared with several other studies, Pérez-González et al. (2005) found many more galaxies with LIR > 1012 L⊙ at z ≈ 2, in part owing to different assumptions about these bolometric corrections. Also, different procedures to account for AGN emission (which can be particularly strong in the MIR) as well as heavy reliance on photometric redshifts may contribute to systematic issues in the IRLF, particularly at the bright end.
As we noted above (Section 3.1.2), several studies (Papovich et al. 2007, Daddi et al. 2007) stacked data at longer FIR wavelengths (e.g., 70 μm) or in radio and submillimeter data and found that standard SED templates such as those of Chary & Elbaz (2001) tend to overestimate typical bolometric corrections from observed 24-μm data for galaxies at z ≈ 2. This suggested that true FIR measurements were needed to reliably determine luminosities and SFRs at high redshift. Huynh et al. (2007) made early measurements of the IRLF at z < 1 using the deepest available Spitzer 70-μm data in GOODS-North. The sample of detected sources was very small, but it was generally consistent with the earlier 24-μm work by Le Floc'h et al. (2005).
Magnelli et al. (2009, 2011) used comparably deep 70-μm data over a much wider area from the Far-Infrared Deep Extragalactic Legacy survey. In addition to counting detected sources (mostly at z < 1.3, given the depth of the 70-μm data), Magnelli et al. stacked 70-μm data in bins of 24-μm flux and redshift to measure empirically the average conversion between observed MIR and FIR luminosities. Compared with previous studies, they also used significantly deeper 24-μm catalogs, extending down to 30 μJy in the GOODS fields. At z < 1.3, Magnelli et al. (2009) found that the average FIR over MIR flux ratios closely matched predictions from the template library of Chary & Elbaz (2001). They also measured LFs that were similar to previous measurements, but that extended to fainter luminosities significantly below the bend in the IRLF at z ≈ 1 and with better statistics. At z > 1.3, however, Magnelli et al. (2011) confirmed previous suggestions that the average 70-μm to 24-μm flux ratios deviated systematically from the predictions of standard local SED templates. They extrapolated from the averaged 70-μm fluxes to the bolometric IRLF and found only a mild increase in L∗ and the luminosity contribution of ULIRGs from z ≈ 1 to 2. At lower redshifts, the faint-end slope was consistent with α = -1.6 as measured for local IRAS galaxies by Sanders et al. (2003). By z = 2, the data reach only slightly fainter than the IRLF knee, and the slope is not constrained. However, extrapolating with a fixed slope α = -1.6, Magnelli et al. (2011) found that the faint IRLF at z = 2 would be quite similar to that predicted by Reddy et al. (2008) on the basis of UV-selected galaxies and the dust absorption predicted from their UV spectral slopes.
The Herschel Space Observatory significantly improved sensitivity and reduced the beam size for FIR (70-500 μm) observations, and several large programs were dedicated to surveys of the most important multiwavelength-deep fields. Even the deepest Herschel surveys do not detect as many sources per square arcminute as are found in the deepest Spitzer 24-μm observations, but direct access to FIR wavelengths is invaluable for reliably estimating bolometric luminosities and SFRs at high redshift. Several analyses presented preliminary LFs out to z = 2 to 3 using data sets obtained early in the Herschel mission (Eales et al. 2010, Gruppioni et al. 2010, Lapi et al. 2011).
More extensive analyses of larger Herschel data sets have recently appeared in the literature. Gruppioni et al. (2013) used sources selected in Herschel PACS observations at 70, 100, and 160 μm in the two GOODS fields as well as shallower but wider observations of the Extended Chandra Deep Field South and COSMOS. They fit customized IR SED templates to photometry from both the PACS and SPIRE (250-500 μm) instruments instruments and computed IR luminosities based on spectroscopic and photometric redshifts. They derived LFs out to z < 4.2. However, at the highest redshifts (3 < z < 4.2), the data are sensitive only to the rarest hyperluminous sources. Limiting their analysis to z < 2.3, Magnelli et al. (2013) restricted their study to the deepest 70-160-μm data available in the GOODS fields, and extracted FIR fluxes to still-fainter limits at positions of 24-μm-detected sources. Note that, as is often the case, the fields analyzed and the data used in these studies overlap considerably; even if the methods of analysis are different, they cannot be considered to be fully independent. That said, in their range of overlap, the two analyses are generally consistent. They find somewhat stronger luminosity evolution at z > 1 than in the Spitzer analysis of Magnelli et al. (2011) and, hence, demonnstrate a larger contribution of ULIRGs to the total IR luminosity density at z ≈ 2 [but not as large as in some earlier Spitzer studies, e.g., by Pérez-González et al. (2005)]. Magnelli et al. (2011) concluded that this difference (compared with their own very similar Spitzer analysis) is mainly due to better determination of the total IR luminosities of galaxies using the improved Herschel FIR measurements. Gruppioni et al. (2013) found that the characteristic luminosity LIR∗ continued to brighten at z > 2, albeit at a slower rate. Neither survey reliably measured the faint-end slope of the IRLF at high redshift, and both fixed it to values derived locally. Each study adopted distinct values: Magnelli et al. (2011) used α = -1.6, whereas Gruppioni et al. (2013) used α = -1.2. Given these different slopes, it is striking and perhaps surprising that these two analyses derive similar values for the total IR luminosity density at redshifts 0 < z < 2. Broadly speaking, both studies find evolution by a factor of ~ 6 between z = 1.1 and today and comparatively flat evolution at higher redshift to < z > = 2.05 (Magnelli et al. 2011) and < z > = 2.75 (Gruppioni et al. 2013), albeit with an increasing range of values allowed within the measurement uncertainties.
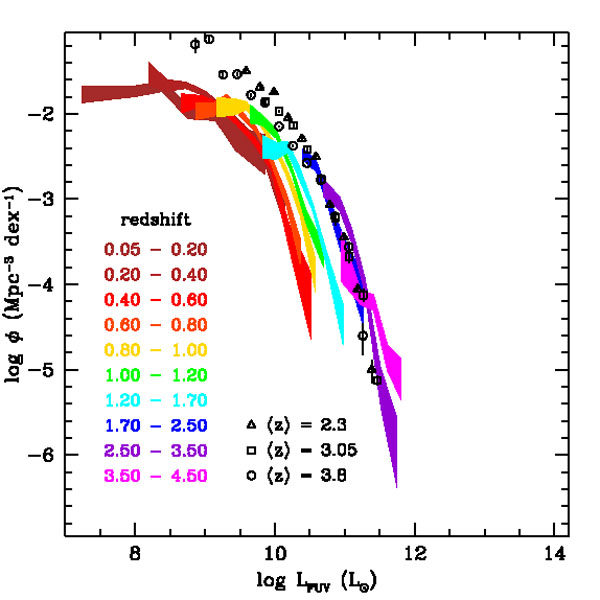
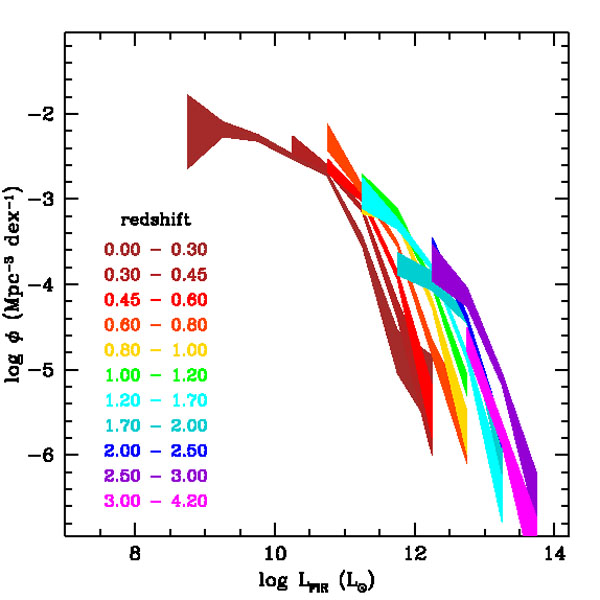
Figure 7 shows recent determinations of the IRLFs and UVLFs at 0 < z < 4. The UVLFs in the figure show the observed luminosities uncorrected for extinction, and are presented in units of solar luminosities for more direct comparison with the IRLFs. This figure illustrates several points that indicate low extinction for galaxies with lower SFRs and a significant contribution from low-luminosity galaxies to the global SFRD at high redshift.
Compared with the UVLFs, the IRLFs cut off less steeply at high luminosities.
The IRLFs extend to much higher luminosities than the UVLFs at the same redshifts, as the most actively star-forming galaxies tend to be strongly obscured by dust.
There is strong luminosity evolution, particularly for the IRLFs, but also in the UV, with more modest density evolution.
The UVLFs shown in Figure 7 (from Cucciati et al. 2012) exhibit a trend toward steeper faint-end slopes at higher redshifts, especially for z > 2. Although this point lacks universal agreement, most studies do measure quite steep UVLF at z > 2 and a trend toward bluer UV colors at faint luminosities.
 |
 |
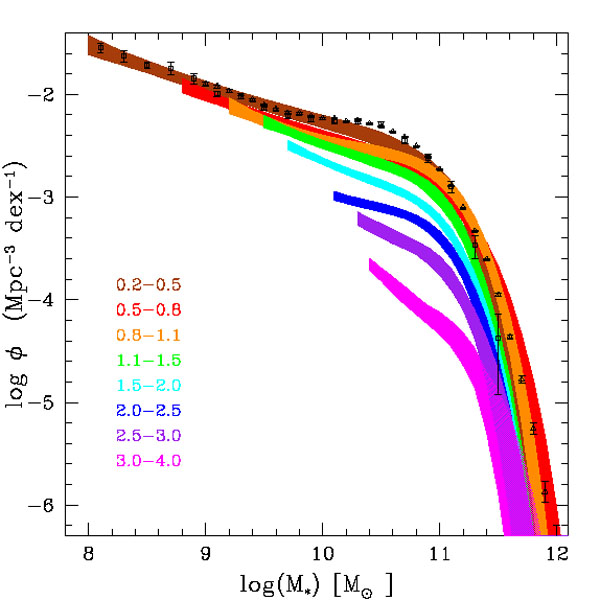 |
Figure 7. (Left panel) Redshift evolution of the FUV luminosity function at 0 < z < 4. The colored bands indicate the 68% confidence intervals on the space densities over the observed luminosities (uncorrected for dust attenuation), in different redshift ranges as indicated by the legend, from Cucciati et al. (2012). Data points, coded by shape, also as indicated in the legend, show the FUV luminosity functions for LBGs at mean redshifts 2.3 and 3.05 from Reddy & Steidel (2009) and 3.8 from Bouwens et al. (2007). These luminosity functions use color selection techniques to extend the measurements to much fainter luminosities than those measured in the purely spectroscopic samples from Cucciati et al. (2012). The FUV luminosity functions at 2.3 < z < 3.8 are observed to be quite similar. (Middle panel) Redshift evolution of the FIR luminosity function at 0 < z < 4 from Gruppioni et al. (2013). The bands indicate the 68% confidence intervals at each redshift, as indicated by the color coding. (Right panel) Galaxy stellar mass function at 0 < z < 4 for a large, deep (Ks < 24) sample of 220,000 galaxies, from Ilbert et al. (2013). Once again, the bands correspond to the 68% confidence intervals at each redshift, including estimated uncertainties in the derived stellar masses. The open triangles and squares correspond to the local estimates by Moustakas et al. (2013) and Baldry et al. (2012), respectively. |
||
Before Spitzer and Herschel, ground-based submillimeter bolometer arrays, especially SCUBA at JCMT, provided an essential glimpse at dusty star formation at very high redshifts. As is frequently noted, the negative K correction at submillimeter wavelengths approximately cancels luminosity distance dimming at z > 1. The flux limits of most submillimeter surveys constrain individual source detections to ultra- and hyper-luminous galaxies, so that only the tip of the IRLF is sampled. In practice, the greatest limitation for deriving LFs or SFRD is identifying galaxy counterparts to submillimeter sources and measuring their redshifts. This limitation is due mainly to the large beam-size of single-dish submillimeter observations, but it is also due to the fact that the optical counterparts are often very faint and sometimes invisible. Another consequence of the negative K correction is that substantial redshift uncertainties translate to only relatively small uncertainties in the bolometric luminosity. Hence, using radio-identified counterparts and very rough radio-millimetric redshift estimates, Barger et al. (2000) were able to make plausible estimates of the SFRD from submillimeter sources in broad redshift bins. Barger et al. (2012) recently updated their findings using a complete submillimeter galaxy (SMG) sample with accurate interferometric positions from the Submillimeter Array and with more extensive redshift information, made possible in part thanks to recent advances in millimetric CO spectroscopy. Chapman et al. (2005) measured optical spectroscopic redshifts for a sample of radio-identified SMGs, and derived the first LF at < z > = 0.9 and < z > = 2.5. These estimates were recently updated by Wardlow et al. (2011) using (mainly) photometric redshifts for another well-defined SMG sample. These analyses demonstrated a significant contribution of dusty SMGs to the cosmic SFRD at high redshift, mainly limited to z ≲ 4. However, recent discoveries of substantial numbers of SMGs out to z = 6.3 (e.g., Riechers et al. 2013) suggest that the dusty ultraluminous population may be important even in the first few billion years of the cosmic SFH.
Although direct FIR detection of individual sources at z ≫ 2 is limited to the most extremely luminous objects (Figure 1), the CIRB provides additional constraints on dusty star formation at the highest redshifts (Pei et al. 1999, Gispert et al. 2000). FIR source counts and the CIRB were reviewed by Lagache et al. (2005) and recent results from Herschel are reviewed by Lutz (2014) in this volume, so we only briefly discuss this topic here. Sources directly detected by Herschel in the deepest observations resolve ~ 75% of the CIRB at 100 and 160 μm (Berta et al. 2011, Magnelli et al. 2013), albeit with significant uncertainties at 100 μm. Stacking Herschel data at the position of sources detected by Spitzer at 24 μm detects an even larger fraction that, with modest extrapolation, can account for the entire CIRB at these wavelengths. At 250 to 500 μm, where confusion is more severe in Herschel SPIRE data, the directly resolved fractions are smaller (from 15% to 5% at 250 to 500 μm), whereas stacking detects 73% to 55%. Again, an extrapolation is consistent with resolving the entire background (Béthermin et al. 2012). Because the deepest Herschel observations were carried out in fields such as GOODS and COSMOS with exceptional ancillary data, it is possible to stack in bins of photometric redshift, to constrain the redshift distribution of the CIRB emission. At higher redshifts, the peak of dust emission from galaxies shifts to longer FIR and submillimeter wavelengths, and the fractional contribution of more distant galaxies increases with the wavelength of the bandpass analyzed. Combining data from Spitzer through Herschel to ground-based submillimeter observations, Béthermin et al. (2012) estimated that 4.7 ± 2.0 nW m-2 sr-1, or 17-9+11% of the integrated CIRB, is produced by galaxies at z > 2. Although the fraction is small, it still allows for a significant amount of dusty star formation to take place at z > 2, beyond what is seen in directly detected sources. However, the 24-μm sources used for these stacking analyses are also subject to strong k-correction dimming at z > 2. Thus, a larger fraction of the high-redshift CIRB may have been missed.
Among the nebular emission lines that have been most frequently used to quantify SFRs at high redshift, Hα is arguably the most useful (see Section 3.1.4). Lines from other elements, most commonly [OII] 3,727 Å, have also been used to measure the cosmic SFR (e.g., Hogg et al. 1998), but their more complex dependence on metallicity and ISM conditions as well as their larger extinction make them problematic. Narrow-band Lyα surveys are popular at high redshift, but Lyα is so strongly subject to resonant scattering and extinction that it must always be regarded as setting only a lower limit on the true SFR.
Hα is accessible with optical observations only at z < 0.5, and NIR observations are needed to follow it out to higher redshifts (z ≲ 2.5). Recent technological developments in IR instrumentation have significantly increased the potential for such measurements. A new generation of wide-field imagers using mosaics of IR arrays is now operating on 4-m- and 8-m-class telescopes (e.g., UKIRT WFCAM, CFHT WIRCAM, NOAO NEWFIRM, VISTA VIRCAM, VLT HAWK-I), thereby significantly increasing the comoving volumes accessible for deep narrow-band imaging. NIR multiobject spectrographs are now becoming mature and efficient (e.g., Subaru MOIRCS and FMOS, Keck MOSFIRE, VLT KMOS, LBT LUCI). Slitless grism spectroscopy with WFC3 on the HST can measure faint Hα lines out to z < 1.5 for all objects within its field of view. Each method has advantages and disadvantages. Narrow-band imaging surveys are tuned to specific, narrow redshift ranges and are strongly subject to density variations due to line-of-sight clustering effects. Flux calibration for objects whose redshifts place emission lines in the wings of the narrow bandpasses can also be problematic. Only statistical corrections can be made for the flux contribution from [NII] or for stellar absorption. Multislit spectroscopy is subject to slit losses that complicate measurements of integrated line fluxes, and atmospheric absorption and emission significant limit the accessible redshifts and can introduce complicated selection effects. (The new VLT KMOS spectrograph uses multiple deployable integral field units, thus eliminating slit-loss concerns, and may prove to be a valuable tool for Hα surveys.) HST WFC3 slitless spectroscopy avoids concerns about the atmosphere and slit losses, but deep observations covering adequately large solid angles are time-intensive. As of this writing, results on Hα LFs from the largest ongoing programs [WISPS (Atek et al. 2010) and 3D-HST (Brammer et al. 2012)] have not appeared in the literature to supersede earlier HST NICMOS results (Yan et al. 1999, Hopkins et al. 2000, Shim et al. 2009). With all methods, reliable extinction corrections depend on the measurement of the Balmer decrement (the ratio of Hα to Hβ line fluxes). This is rarely available for narrow-band surveys, but it is sometimes available for spectroscopic samples. However, in such cases, the sample selection is often limited by the weaker Hβ line. Hence, statistical corrections are often adopted. AGN and LINERs can also contribute significantly to the samples of emission line galaxies and can be reliably taken into account only using high-quality spectroscopic data to measure line-excitation diagnostics. Most careful studies of the local galaxy population using spectroscopy from SDSS or GAMA (see below) have done this, but it is rarely possible at higher redshifts. Thus, most studies have resorted to statistical corrections or none at all.
Much literature discusses LF and SFRD measurements from Hα, [OII] and [OIII], and we note only selected works here. Gunawardhana et al. (2013) included a thorough and up-to-date compilation of these measurements at low and high redshifts.
Using objective prism photographic data, Gallego et al. (1995) presented an important early study of the local Hα LF. Subsequently, the SDSS provided a vast number of spectroscopic redshifts and line-flux measurements, although the small aperture size of the spectroscopic fibers requires careful and inevitably uncertain corrections to the total emission line flux for each galaxy. SDSS spectroscopy covers both Hα and Hβ and can provide a measurement of extinction via the Balmer decrement, although care is needed to account for stellar absorption, flux limits, and selection effects. Brinchmann et al. (2004) conducted a widely-cited study of local star formation from SDSS optical spectroscopy and photometry. They used a full analysis of the emission and absorption line spectroscopy. Thus, their study was not strictly based on Hα alone, although the Balmer lines carry significant weight in the SFR determinations. As noted above, Salim et al. (2007) carried out an independent SDSS analysis based mainly on photometry including GALEX UV measurements but with extensive cross-comparison to the Hα data. By using photometry, the Salim analysis bypasses uncertainties inherent in the spectroscopic Hα aperture corrections. The local SFRDs (normalized to z = 0.1) from the studies by Brinchmann et al. (2004) and Salim et al. (2007) agree extremely well. Most recently, Gunawardhana et al. (2013) combined data from the SDSS with significantly deeper (but also much smaller) fiber spectroscopy from the GAMA survey, to probe fainter down the LF and extend the analysis to higher redshifts (z < 0.35).
Optical spectroscopic surveys have measured Hα SFRD typically out to z < 0.4 (e.g., Tresse & Maddox 1998, Sullivan et al. 2000, Westra et al. 2010, Gunawardhana et al. 2013). Until recently, NIR spectroscopy was measured only for small samples, object by object, typically at 0.5 < z < 1.1 (Glazebrook et al. 1999, Tresse et al. 2002, Doherty et al. 2006). In general, nebular line extinction is not directly measured and can only be assumed. The same is true for corrections for stellar absorption. Larger-scale and deeper spectroscopic surveys from a new generation of multiobject IR spectrographs on 8-10-m telescopes should be forthcoming.
Several studies have exploited slitless grism spectroscopy of Hα at 0.7 < z < 1.9 from the HST NICMOS instrument (Yan et al. 1999, Hopkins et al. 2000, Shim et al. 2009). These studies are of small but relatively unbiased samples that are observed with relatively uniform sensitivity over a broad redshift range and without concerns for flux losses due to a finite spectrograph slit size. Once again, direct measurements of extinction are generally unavailable, and the low-resolution slitless spectroscopy inextricably blends Hα with [NII], thus requiring purely statistical corrections. New, more sensitive grism surveys with HST WFC3 that cover larger solid angles are under way.
The largest number of high-redshift measurements has come from narrow-band imaging surveys, using wide-field CCD cameras out to z ≈ 0.4 and with IR arrays at higher redshifts. These are generally carried out using filters that fit into spectral windows relatively unaffected by atmospheric absorption or emission and that correspond to specific redshifts (z = 0.24, 0.40, 0.84, 1.47, and 2.23 are all common). Using a new generation of wide-field imagers, the current state-of-the-art Hα surveys include those of Ly et al. (2007, 2011), Hayes et al. (2010), and Sobral et al. (2013). The latter survey (HiZELS) combines data from Subaru Suprime-Cam (z = 0.40) and UKIRT WFCAM (z = 0.84, 1.47 and 2.23). It covers ~ 2 deg2 in two survey fields, with deeper but narrower (0.03 deg2) observations at z = 2.23 from the VLT and its HAWK-I imager. Between 500 and 1750 Hα emitters are detected in each redshift window, thereby providing good statistics. These authors measured a steady increase in the characteristic luminosity L∗(Hα) with redshift and a faint-end slope α ≈ 1.6 that is constant with redshift, and is also similar to that found in most of the UV continuum surveys.
Centimeter-wavelength radio continuum emission from star-forming galaxies arises from a combination of flat-spectrum free-free emission, which is prominent at high frequencies, and steep spectrum synchrotron emission, which dominates at lower frequencies. Although the free-free emission should be a direct tracer of SFRs, it has been impractical to observe this at high redshift. However, the improved high-frequency sensitivity of the Jansky VLA should open this capability in the future. The lower-frequency emission arises mainly as a consequence of SNe. As such, it is also related to the SFR. In practice, its calibration as an SFR measurement is primarily empirical, e.g., based on the tight correlation observed between radio and FIR emission for IRAS-selected galaxies in the local Universe (e.g., Yun et al. 2001). This correlation together with insensitivity to dust extinction make radio emission an attractive wavelength for studying star formation.
Problematically, AGN can also produce powerful radio emission. Locally, radio sources with Lν(1.4 GHz) > 1023 W Hz-1 are predominantly AGN. This radio luminosity corresponds to a SFR > 94 M⊙ year-1, using the conversion factor from Murphy et al. (2011) scaled to a Salpeter IMF. Such galaxies are extremely rare locally, so very powerful radio sources are commonly excluded as likely AGN. However, at z > 1, galaxies with these SFRs (corresponding to ULIRGs in terms of their IR luminosities) are common, even "normal" (see Section 3.1.2). Thus, it is problematic to disregard them simply on the basis of their radio emission. Other considerations are needed to distinguish AGN from star-forming radio sources, such as radio spectral index, radio morphology, or radio/IR flux ratios, but these are all more difficult to measure, especially for very faint sources.
The local radio LF has been used to estimate the current SFRD in many studies (for recent examples, see Machalski & Godlowski 2000, Condon et al. 2002, Sadler et al. 2002, Serjeant et al. 2002, Mauch & Sadler 2007). In these studies, the authors carefully employed various criteria to separate AGN from star-forming galaxies. Data were often compared with IRAS IR measurements and excluded objects with a radio excess relative to their IR luminosities.
At z > 1, even the deepest VLA surveys have been able to detect galaxies with SFRs only ≳ 100 M⊙ year-1 (Figure 1) and ≳ 1000 M⊙ year-1 at z > 3, although the Jansky VLA is now pushing to fainter sensitivities. Haarsma et al. (2000) were among the first to combine very deep VLA observations with spectroscopic and photometric redshift information to derive radio LFs and the cosmic SFRD at high redshift, primarily at 0.3 < z < 0.8. However, they also considered one very broad bin from 1 < z < 4.4. Based on individually detected radio sources, this work was updated in later studies that took advantage of more extensive multiwavelength data to distinguish AGN from star-forming galaxies. Seymour et al. (2008) identified AGN based on radio spectral indexes, radio morphology, and radio to NIR and MIR flux ratios. Smolcic et al. (2009) used optical SED criteria to identify star-forming galaxies detected in VLA 1.4 GHz data for COSMOS, at more modest redshifts, z < 1.3. Seymour et al. (2008) assumed pure luminosity evolution for the LF, consistent with the measurements by Smolcic et al. (2009) (and earlier by Haarsma et al. 2000). All these studies found broad agreement between the radio SFRD evolution and optical and IR surveys, noting a steep decline from z = 1 to 0; Seymour et al. (2008) measured a peak SFRD at z ≈ 1.5, albeit with large uncertainties.
Other studies have used radio stacking to probe to fainter luminosities, below the detection limits for individual sources - particularly, stacking for NIR samples that approximate stellar mass selection. Here, the assumption is that, as in the local Universe, radio sources at fainter luminosities will primarily trace star formation, with relatively little AGN contribution. Dunne et al. (2009) stacked VLA 1.4 GHz and GMRT 610 MHz data for K-band-selected sources in bins of redshift and K-band luminosity. They found a linear (but redshift-dependent) relation between radio and NIR luminosity. Using a measurement of the evolving K-band LF from the same data set, they then used this radio/NIR ratio to extrapolate the observations to the total radio luminosity density and SFRD. Karim et al. (2011) used a large 1.4-GHz survey of COSMOS and a Spitzer 3.6-μm-selected sample to carry out the most extensive study of this sort to date. Stacking in bins of stellar mass and photometric redshift and converting the mean radio fluxes to SFRs, they extensively analyzed the SFR-M∗ correlation, and used this and the evolving stellar mass function (SMF) (from Ilbert et al. 2010) to compute the integrated SFRD. Dunne et al. (2009) measured a steady increase in the SFRD from z ≈ 0 to a peak at z ≈ 1.5 that declined at higher redshift to z ≈ 4. By contrast, Karim et al. (2011) found a monotonic decline in the SFRD from z = 3 to today.
4.5. Stellar Mass Density Surveys
As the technology of NIR detectors advanced, so did surveys that used NIR photometry to better sample galaxies by stellar mass at both low and high redshifts (e.g., Cowie et al. 1996, Gavazzi et al. 1996). However, it was not until the turn of the millennium that authors started to routinely use stellar population synthesis models to convert photometry and redshift information to stellar masses for large samples of galaxies, especially at high redshift. Before the era of large, modern redshift surveys such as the SDSS and the 2dFGRS, several authors made estimates of the local baryonic and SMDs (Persic & Salucci 1992, Fukugita et al. 1998, Salucci & Persic 1999). This effort accelerated, however, as new spectroscopic surveys mapped the local Universe. Cole et al. (2001) used 2dFGRS redshifts and NIR photometry from 2MASS to measure the local K-band LF more accurately than had previously been possible. Then, using stellar population modeling, they inferred stellar masses from the galaxy colors and luminosities and derived the local galaxy stellar mass function (GSMF) and the local comoving SMD. Bell et al. (2003) did the same using SDSS and 2MASS. Many studies have subsequently derived the GSMF from incrementally improving SDSS data releases, using additional ancillary data and a variety of methods for stellar population modeling; mass-to-light ratios are sometimes derived from photometry and from the SDSS spectra (Panter et al. 2007, Baldry et al. 2008, Li & White 2009). Moustakas et al. (2013) incorporated photometry from the ultraviolet (GALEX) to the MIR (WISE) in their analysis of the SDSS GSMF. Baldry et al. (2012) analyzed a sample from GAMA, a wide-area spectroscopic survey extending significantly fainter than the SDSS, modeling M / L from optical SDSS photometry. As the samples have grown larger, more elaborate functional forms have been fit to the GSMF, including double and even triple Schechter functions, and there is some evidence that the GSMF slope at low masses (< 109 M⊙) may be steeper than was previously believed (e.g., α = -1.47) (Baldry et al. 2012). Other authors have modeled stellar populations for ensembles of galaxies rather than deriving individual galaxy stellar masses, e.g., by fitting the integrated local luminosity densities for the entire local volume from UV to NIR wavelengths (Baldry & Glazebrook 2003) or by modeling coadded SDSS spectra in bins of luminosity, velocity dispersion, and 4,000-Å break strength (Gallazzi et al. 2008).
At higher redshifts, Brinchmann & Ellis (2000) derived stellar masses for galaxies at z < 1 in fields with both HST and NIR imaging. As expected given the declining cosmic SFRD at those redshifts, they found relatively little evolution in the integrated mass density at 0.4 < z < 0.9, but a marked evolution in the mass breakdown by morphological type. Cohen (2002) similarly found no significant evolution in the SMD at 0.25 < z < 1.05. Because the cosmic SFRD declines steeply with time at z < 1, relatively little new stellar mass accumulates in the late stages of cosmic history. Moustakas et al. (2013) recently broke new ground with a low-resolution prism spectroscopic survey measuring ~ 40,000 redshifts for galaxies at 0.2 < z < 1 in five fields with Spitzer IRAC photometry covering 5.5 deg2. Even with such outstanding data, the evolution in the overall SMF at 0 < z < 1 is nearly imperceptible, but the migration of galaxies from the star-forming to the quiescent population is confirmed with exquisite detail.
Sawicki & Yee (1998), Giallongo et al. (1998), Papovich et al. (2001), and Shapley et al. (2001) pioneered the use of stellar population models to derive stellar masses for LBGs at z ≈ 2-3. Giallongo et al. (1998) computed comoving SMDs out to z ≈ 4 for galaxies from a relatively bright, optically-selected sample, and measured steep evolution, but did not attempt to correct for unobserved galaxies fainter than the limits of their data. Subsequently, Dickinson et al. (2003), Fontana et al. (2003), and Rudnick et al. (2003) used the deepest NIR imaging then available for the two HDFs, HST NICMOS (HDF-N) and VLT ISAAC (HDF-S), together with extensive photometric and spectroscopic redshifts to derive the comoving SMD in several redshift bins out to z ≈ 3. Strong evolution was found over that longer redshift baseline; the SMD at z ≈ 3 measured in the range 5 to 15% of its present-day value, although a somewhat broader range of values would be permitted if systematic assumptions about the galaxy SFHs or stellar metallicities were pushed well beyond the range of models used for standard analysis. The SMD reached half its present-day value somewhere between z = 2 and 1. Strong cosmic variance in these small fields was also evident: At z > 2, red galaxies with high mass-to-light ratios were nearly absent in the HDF-N but were found in moderate abundance in the HDF-S. By contrast, the corresponding SMDs differed substantially. This indicated the importance of surveying larger fields and more sightlines, but obtaining IR imaging to satisfactory depth over these larger regions of sky has proven to be very challenging and has required another decade of effort.
The launch of Spitzer and the impressive performance of its IRAC camera for imaging at 3.6 to 8 μm made it possible to measure rest-frame NIR photometry for galaxies at high redshift, and major public survey imaging campaigns such as GOODS, S-COSMOS, and SWIRE produced widely-accessible and heavily-used imaging data sets spanning a wide range of area-depth parameter space, ideal for deriving SMFs and densities at high redshift. Indeed, NIR imaging has struggled to catch up with IRAC in terms of comparable area-depth coverage. Despite the vast swaths of telescope time that have been invested in obtaining NIR data on popular fields such as GOODS and COSMOS, imaging at 1 to 2.5 μm still tends to fall short of Spitzer's sensitivity at 3.6 and 4.5 μm. At z > 4.5, the ground-based K-band samples rest-frame ultraviolet wavelengths, and IRAC offers the only viable way to measure optical rest-frame light to constrain stellar masses.
From 2006 onward, most (although not all) papers on SMFs and densities at high redshift have made use of IRAC data - often in the same survey fields that are repeatedly analyzed. Among many other papers, Fontana et al. (2006), Pérez-González et al. (2008), Kajisawa et al. (2009), and Marchesini et al. (2009) analyzed stellar masses in the GOODS fields (sometimes in combination with other data sets) for galaxies out to z ≈ 4. Arnouts et al. (2007), Pozzetti et al. (2010), Ilbert et al. (2010), and Brammer et al. (2011) analyzed wider-area but shallower surveys (e.g., COSMOS, VVDS-SWIRE, NMBS), generally focusing on redshifts z ≤ 2. Despite differences in their methodologies, the conclusions of these papers painted a remarkably consistent picture of the evolution of the SMF at 0 < z < 3, with very little change in its shape, characteristic mass M∗, or faint-end slope, but with steady evolution in the characteristic density ϕ∗. There are indications that the faint-end slope of the mass function may steepen at higher redshifts (e.g., Kajisawa et al. 2009, Santini et al. 2012). The integrated SMDs measured in the different analyses generally agreed within factors of 2 at most redshifts, and a consistent picture of mass-build-up emerged.
Some of the most recent additions to this literature have taken advantage of deeper, wider NIR imaging from the largest-format cameras on 4-m-class telescopes (Bielby et al. 2012, Ilbert et al. 2013, Muzzin et al. 2013) to map relatively wide survey areas such as COSMOS or the CFHT Legacy Survey fields to depths previously reserved for small, deep surveys such as GOODS. Together with ever growing spectroscopic surveys and increasingly excellent photometric redshifts, these have yielded the most statistically robust measurements of the SMFs at z < 2.5. However, several of these surveys repeat analysis in COSMOS. Some even use essentially the same imaging data sets, so these analyses are not always robust against cosmic variance.
Spitzer IRAC has been essential for deriving stellar masses at z > 4, and very deep observations are necessary to detect typical galaxies at those redshifts. For this reason, nearly all analyses of SMDs at z > 4 have been carried out in GOODS and the HUDF [in a departure from the GOODS-dominated norm, McLure et al. (2009) stacked relatively shallow IRAC data for LBGs at z = 5 and 6 in the UKIDSS Ultra Deep Survey to measure average SEDs and mass-to-light ratios and, hence, to estimate the SMD] and nearly all have studied UV-selected LBGs, for which there are abundant samples. Early analyses of small samples of galaxies at z = 5 and 6, including estimates of the integrated SMD, were presented by Yan et al. (2006), Eyles et al. (2007), Stark et al. (2007), Verma et al. (2007), and Yabe et al. (2009). These were followed by larger and more systematic analyses of LBG samples at 4 ≥ z ≥ 7 (Stark et al. 2009, González et al. 2011, Lee et al. 2012), all of which used similar procedures, and found broadly similar results. In particular, the derived LBG SMFs have somewhat shallower low-mass slopes than do the UVLFs, because M / LUV decreases at fainter UV luminosities, at least at z = 4 and 5 where this could be measured with some robustness from galaxies with individual IRAC detections (e.g., Lee et al. 2012). Using HST WFC3-selected samples in the HUDF and GOODS/CANDELS fields, Labbé et al. (2013) recently extended this analysis to z ≈ 8.
Exceptionally, some studies have used IRAC selection to avoid the potential bias of UV selection against older or dustier galaxies. Caputi et al. (2011) analyzed an IRAC 4.5-μm-selected sample in the UKIDSS Ultra Deep Survey, thereby computing SMDs at 3 ≤ z ≤ 5. The depth of their IRAC data limited direct detections to a stellar mass completeness limit ≳ 1010.4 M⊙. Their extrapolated mass densities based on Schechter function fits fall somewhat below those from other LBG-based studies (e.g., González et al. 2011, Lee et al. 2012), but this is likely due to uncertainties in the large extrapolation required. Several other authors have analyzed partially or wholly IRAC-selected candidates for massive galaxies at z ≳ 3.5 (Wiklind et al. 2008, Mancini et al. 2009, Marchesini et al. 2010, Caputi et al. 2012). In some cases, they have estimated comoving SMDs, although generally without fitting SMFs and often without rigorous analysis of sample completeness.
Several studies have suggested that LBGs at z ≳ 4 have much stronger optical rest-frame nebular line emission (particularly Hα and [OIII]) than do similar UV-selected galaxies at lower redshifts (Chary et al. 2005, Raiter et al. 2010, Shim et al. 2011, Stark et al. 2013, Labbé et al. 2013). In most cases this has been inferred on the basis of Spitzer IRAC colors that would be unusual for pure stellar populations but that can be explained if strong line emission boosts the IRAC fluxes. This line emission, if not taken into account, can significantly effect derived stellar population parameters and generally leads to overestimated stellar masses. For LBG samples at z = 4 to 8, Stark et al. (2013) and Labbé et al. (2013) estimated that average stellar masses derived from models without nebular lines should be reduced by factors from 10 to 70%, with the effect increasing at higher redshifts. Although the photometric evidence for this strong nebular emission is compelling, it will be vitally important for JWST spectroscopy to confirm and quantify its effects.
4.6. The State of the Art, and What's Wrong with It
4.6.1 LOCAL MEASUREMENTS To be statistically meaningful, measurements of the current SFR or SMD require surveys covering a large fraction of the sky. Salim et al. (2007) and Robotham & Driver (2011) used most or all of the GALEX Medium Imaging Survey data, covering ~ 1,000 deg2 overlapping the SDSS and 2dFGRS spectroscopic surveys, and there is little prospect for improving the UV data in the near future. Only refinements in the analysis can be expected, e.g., incorporating improved photometric data at optical or NIR wavelengths, or further joint analysis with spectroscopic stellar population measurements. As discussed below (Section 5.1, Figure 8), there is significant disagreement in the literature about the net FUV extinction correction at z ≈ 0. Wide-area spectroscopic emission line surveys (e.g., from SDSS or GAMA) (Brinchmann et al. 2004, Gunawardhana et al. 2013) are limited by uncertain aperture corrections to line fluxes, whereas narrow-band imaging surveys have yet to cover enough galaxies over a wide enough area and are usually limited by the absence of direct measurements of extinction from the Balmer decrement, the [NII] contribution to Hα measurements, or the contribution of AGN emission. There is still room for progress in combined narrow-band plus spectroscopic data for large local samples. The local FIRLF has not been drastically revised since the final IRAS analyses (Sanders et al. 2003, Takeuchi et al. 2003); additional AKARI data did not drastically change earlier results (Goto et al. 2011a, b, Sedgwick et al. 2011). The biggest remaining uncertainties pertain to the faint-end slope, where measurements vary significantly from α = -1.2 to -1.8 (or, somewhat implausibly, even -2.0) (e.g., Goto et al. 2011b). Analysis of the widest-area FIR surveys from Herschel, such as H-ATLAS (570 deg2) (Eales et al. 2010) may help with this. The present uncertainties lead to a difference of a factor of at least 2 to 3 in the local FIR luminosity density. Nevertheless, as previously noted, in today's relatively "dead" epoch of cosmic star formation, a significant fraction of the FIR emission from ordinary spiral galaxies may arise from dust heated by intermediate-age and older stellar populations, not newly formed OB stars. Hence, it is not necessarily the best measure of the SFR. At higher redshifts, when the cosmic-specific SFR was much larger, new star formation should dominate dust heating, making the IR emission a more robust global tracer.
Local measurements of the SMD have relied mainly on purely optical data (e.g., SDSS photometry and spectroscopy) or on relatively shallow NIR data from 2MASS. There may still be concerns about missing light, surface brightness biases, etc., in the 2MASS data (e.g., Bell et al. 2003), and deeper very-wide-field NIR data would be helpful. All-sky MIR data from WISE may be valuable and have been used by Moustakas et al. (2013), but without extensive analysis specifically focused on this topic. Deeper NIR data covering a significant fraction of the sky, either from new wide-field ground-based NIR telescopes with large apertures or from space-based surveys with EUCLID or WFIRST, would make a valuable new contribution. Otherwise, as for UV SFRs, the most likely improvements will come from refined stellar population analyses, rather than from new data.
4.6.2 0 < z < 1 During the decline and fall of cosmic star formation, from z ≈ 1 to 0, the greatest weakness of current measurements is that they have generally covered small sky areas and small comoving volumes over few independent sightlines. Hence, they may be subject to significant cosmic variance uncertainties. Fields such as GOODS, which have been analyzed many times, are too small to offer precision measurements in fine redshift bins at z < 1. Even the 2 deg2 COSMOS field subtends less than 100 Mpc at z < 1 and can be spanned by large-scale structure; as a single sightline, it is subject to density fluctuations. Although very good data for measuring the SFRD or SMD at z < 1 exist in many fields, relatively little information has been analyzed thoroughly, in part because intensive effort on spectroscopic (or even photometric) redshifts has been applied to only the few, most famous fields. Sometimes even fields such as AEGIS, which has outstanding spectroscopy and deep GALEX, Spitzer and Herschel data, have not been fully exploited for this purpose.
For example, very deep GALEX data exist for several of the most famous survey fields, but the one widely-cited analysis of the UV luminosity density at z < 1 (Schiminovich et al. 2005) uses only ~ 1,000 sources with redshifts in a single 0.5-deg2 field. Expanded analysis of comparably deep GALEX data in COSMOS, AEGIS, and several other survey fields with existing, extensive spectroscopy is long overdue. There are no opportunities to collect more GALEX data, but deep U-band imaging measuring somewhat longer rest-frame UV wavelengths may be quite adequate for many purposes. Such data exist or could be obtained with wide-field imagers, but the best analysis to date (Cucciati et al. 2012), using ~ 11,000 spectroscopic redshifts, is limited to a single 0.6-deg2 sightline [indeed, the same field analyzed by Schiminovich et al. (2005) with GALEX]. Much more work can be done to improve this situation, with relatively limited new observational effort and often using data that already exist.
Similarly, most analyses of MIR and FIR data from Spitzer and Herschel data have used data from at most three independent sightlines (e.g., Magnelli et al. 2009, Rodighiero et al. 2010, Gruppioni et al. 2013), nearly always combining the two GOODS fields with one shallower but wider data set (e.g., COSMOS or the VVDS-SWIRE field). The widest-area analysis to date is that of Rujopakarn et al. (2010), which used 24-μm-selected sources at z < 0.65 from the 9-deg2 Boötes survey. In practice, more data over more sightlines exist. Large consortium surveys such as the PEP and HerMES Herschel Guaranteed Time programs have mapped many fields, often with an elegant hierarchy of different areas and depths, but these have not yet been exploited and combined into a single, definitive analysis. Typically, this is because the ancillary imaging and spectroscopy needed to identify IR source counterparts and to determine their redshifts is available or adequate in only a few fields (hence, the repeated analyses of GOODS and COSMOS).
Many of these same comments apply to SMD estimates at z < 1. In this case, the state of the art has recently been improved by Moustakas et al. (2013), who analyzed five independent fields with a combined solid angle of 5.5 deg2 with (relatively shallow) IRAC photometry and (low-resolution) spectroscopic redshifts. This is the best combination of area, depth, number of sightlines, and redshift quality for any study of the SMD at z < 1 and is also superior to any data used to date for SFRD studies at similar redshifts. Deeper ground-based NIR data were used by Bielby et al. (2012), who analyzed four fields covering 2.1 deg2, and by several studies of the single 2-deg2 COSMOS field (e.g., Ilbert et al. 2013). New wide-area surveys such as VISTA VIDEO (Jarvis 2012) (ground-based NIR, three fields, 12 deg2) SERVS (Mauduit et al. 2012) (Spitzer IRAC, five fields, 18 deg2, overlapping VIDEO) will provide excellent new data to improve mass function estimates, but only if adequate redshift information and supporting optical photometry are available.
4.6.3 1 < z < 4 At z > 1, deep surveys are needed to probe typical (L∗ and fainter) luminosities and to directly detect the majority of cosmic star formations. In principle, many fields have suitable data. However, in practice, a few survey fields have been re-analyzed many times, in part because they have the best spectroscopic and photometric redshift measurements and in part because they have the richest multiwavelength data. As such, they are magnets for studies of all kinds. In the UV, the 1,500-Å rest-frame is easily probed at z > 1.5 using ground-based or HST optical imaging. At z ≈ 2 and 3, the surveys of LBGs by Steidel and collaborators (e.g., Reddy & Steidel 2009) cover many independent sightlines. They offer excellent control of cosmic variance and have outstanding spectroscopic calibration. UV selection is biased against dusty star formation, but for pure measurements of the UVLF, their surveys are arguably definitive. The best direct measurements of dust emission from Spitzer and Herschel are limited to fewer fields, and still fewer have the very deep data needed to probe galaxies near L∗. As described above, most analysis has revolved around GOODS and COSMOS, and even in GOODS, the Herschel data only barely reach L∗ at z = 2. The faint-end slope of the IRLF is not directly constrained by individually detected sources at z > 2, leading to potentially large uncertainties in any extrapolation to the bolometric IR luminosity density. With no more sensitive FIR space missions on the horizon, there is little prospect for wide-area surveys to fainter flux limits. ALMA can reach fainter submillimeter continuum limits and detect dust continuum from ordinary galaxies at very high redshifts, but only for very small solid angles. Mosaics of hundreds or even thousands of pointings would be needed to survey a field the size of GOODS. Well-designed observations targeting intelligently selected galaxy samples, rather than panoramic mapping, may be required.
Stellar masses below the characteristic mass M∗ can be probed using the best ground-based NIR data, and using Spitzer IRAC even with modest integration times. Thus, more fields have been analyzed, although GOODS and COSMOS still tend to dominate the literature. The extended Spitzer warm mission generated a wealth of valuable data that has yet to be fully exploited. In practice, there is uncannily good agreement between most determinations of the SMF and density at 1 < z < 4, and it is not clear that new surveys are needed, rather than more sophisticated analysis of the existing data. However, the CANDELS HST WFC3 survey reaches fainter multiband NIR fluxes in fields that already have the deepest IRAC data and, hence, provides an important opportunity for measuring photometric redshifts and stellar masses for galaxies fainter than the limits of most studies to date. This should provide a better constraint on the slope of the SMF at low masses.
4.6.4 z > 4 At z ≥ 4, the large majority of UV-based SFR and SMD measurements have been derived from HST data, mainly in the GOODS fields and the HUDF plus its deep parallel fields (also located in and around GOODS-South). Although ground-based imaging can select galaxies at z ≥ 4, in practice the HST surveys have gone deeper, especially at the very red optical wavelengths (I- and z-bands) and the NIR wavelengths needed to select galaxies at the highest redshifts; only with these data can LF measurements probe significantly fainter than L∗. GOODS also has the deepest Spitzer IRAC data, essential for deriving stellar masses at z > 4, where even the K-band samples rest-frame UV wavelengths. Although the comoving volumes in the GOODS fields are significant at these large redshifts (nearly 106 comoving Mpc3 at z = 4 for the combined GOODS fields), one may still worry about clustering and cosmic variance, given only two sightlines. The CANDELS program (Grogin et al. 2011, Koekemoer et al. 2011) is obtaining multiband optical and NIR HST imaging over five fields, each similar in size, including the two GOODS fields. This program is supplemented by very deep IRAC imaging from SEDS (Ashby et al. 2013) and S-CANDELS (G. Fazio, research in progress) and will help with cosmic variance control and improved statistics.
At 6 < z < 8, the HUDF data become essential to get any handle on the faint-end slope of the LF, and one must worry about the very small field size. At z > 8, the HUDF (or lensing clusters) are needed to detect convincing candidates. Hence, nearly all the literature on the SFRD or stellar masses at these redshifts consists of serial and parallel analyses of the same HUDF data sets, as well as recent work from CLASH (Zheng et al. 2012, Coe et al. 2013). Here, the new Hubble Frontier Fields should be important. This program, to be executed from 2013- to 2016, will obtain multiband optical and NIR HST imaging with near-HUDF depth along with ultradeep Spitzer IRAC data for six massive galaxy clusters. Their lensing potentials will magnify the faintest high-redshift background galaxies. In addition, there will be six new "blank" parallel fields that will improve statistics for unlensed sources and provide cosmic variance control for analyses that now depend on the HUDF (and its satellites) alone.
At z > 4, galaxies detected in ground-based NIR data (and at z > 3 for HST observations in the reddest WFC3-IR filters) are observed at rest-frame UV wavelengths. Hence, even with CANDELS, the HUDF, and the Frontier Fields, HST selection will be biased against quiescent or dusty galaxies. Massive galaxies with huge SFRs that are detected at submillimeter wavelengths but invisible even out to the K-band have been detected. Redshifts z > 4 have been confirmed from CO measurements (e.g., Daddi et al. 2009), but it is unknown how much they might contribute to the SFR or SMD. IRAC selection should, in principle, provide a less biased census (e.g., Mancini et al. 2009, Huang et al. 2011, Caputi et al. 2011, 2012), but spectroscopic confirmation or even photometric redshift estimates for this population may prove to be very difficult before the launch of the JWST.