


Fundamentally, deriving the history of star formation in galaxies involves inferring mass from light. We observe the emission from galaxies at various wavelengths, and from those measurements we try to infer either the rates at which the galaxies are forming stars or their integrated stellar masses. Figure 1 illustrates the sensitivity of today's premier multiwavelength surveys to the SFRs and stellar masses of galaxies at high redshift. Rest-frame UV, IR, submillimeter and radio emission, as well as nebular lines such as Hα are all used to measure SFRs and are discussed in this section. In the absence of extinction, UV measurements are more sensitive than current IR or radio data by orders of magnitude, but in practice dust attenuation is often severe. Long-wavelength data are essential to gain a comprehensive picture of cosmic star formation, but are limited by current instrumental sensitivities, although ALMA (Acatama Large Millimeter Array) enables dramatic improvements at submillimeter wavelengths that are particularly valuable at higher redshifts. NIR to mid-infrared (MIR) measurements are critical for deriving stellar masses. Their sensitivity to stellar mass depends critically on the mass-to-light ratio of the stellar population in a distant galaxy, hence on its age, SFH, and extinction. Figure 1b illustrates two limiting cases: a maximum-M / L model defined as a passively evolving stellar population as old as the Universe, and a minimum-M / L model defined as a very young, unreddened, actively star-forming galaxy. In principle, surveys should be mass-complete to the maximum-M / L limits. Much less massive galaxies with young, low-M / L stellar populations can easily be detected, but observations would miss dusty or evolved galaxies with lower masses. The HST WFC3 camera has significantly improved NIR sensitivity compared with most ground-based imaging, but it samples only optical rest-frame light at z < 3. Spitzer's IRAC remains the premier resource for deriving stellar masses at higher redshifts, and James Webb Space Telescope (JWST) will provide a major advance.
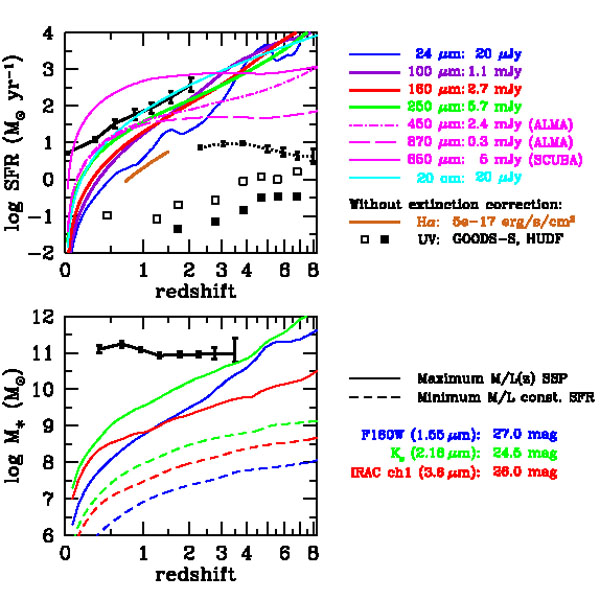 |
Figure 1. (Top panel) Sensitivity to star formation versus redshift for deep survey data at various wavelengths. The key at right indicates the wavelengths and the corresponding flux limits. Most of these limits were computed using data available in the GOODS fields or are simply chosen to be representative values for very deep surveys. For ALMA, we use projected sensitivities of the completed interferometer for modest 10-min integration times, noting that the small ALMA primary beam at 870 μm and 450 μm requires approximately 50 and 170 pointings, respectively, to map 1 square arcminute with uniform sensitivity. All conversions to SFR assume a Salpeter IMF from 0.1 to 100 M⊙. The limits for mid-IR (Spitzer), far-IR (Herschel), submillimeter, and radio data use bolometric corrections from the observed wavelength based on spectral energy distribution templates by Magdis et al. (2012). Open square points show rest-frame 1,500-Å sensitivities assuming no extinction; in practice, dust attenuation can significantly increase these limits. The open squares are based on GOODS data from GALEX, ground-based U-band (Nonino et al. 2009), and HST ACS and WFC3 (CANDELS), whereas the filled points show HST ACS and WFC3 limits for the HUDF (Bouwens et al. 2011b). The Hα curve shown here represents the typical limiting sensitivity of the 3D-HST IR grism spectroscopic survey (Brammer et al. 2012), again assuming no extinction, with conversion to SFR from Kennicutt (1998). The data points (shown as error bars) connected by a solid line show the SFR corresponding to the characteristic infrared luminosity L∗(IR) from Magnelli et al. (2013), and the points connected by a dotted line show the SFR corresponding to the characteristic FUV luminosity L∗(FUV) for Lyman break galaxies at 2 < z < 8, uncorrected for extinction (Reddy & Steidel 2009, Bouwens et al. 2012b). (Bottom panel) Sensitivity to stellar mass versus redshift, for flux limits at several wavelengths, as indicated at right. The solid curves assume a passively evolving simple stellar population with the age of the Universe, solar metallicity, a Salpeter IMF, and no extinction, computed using the models of Conroy et al. (2009). This approximates the maximum mass-to-light ratio potentially visible at any redshift and, hence, provides an upper bound to the mass completeness limit for a given survey. Less massive galaxies can easily be detected, however, if they have young stellar populations. The dashed curves show sensitivities for an unreddened galaxy with a constant SFR and age of 107 years, when M / L at these wavelengths reaches a minimum value. The IR sensitivity limits (given in AB magnitudes) are chosen to be representative of deep surveys such as GOODS and CANDELS [e.g., Ks data from Retzlaff et al. (2010) or Wang et al. (2010)], but are not specific to a particular data set. The data points (shown as error bars) connected by a solid line show the characteristic stellar mass M∗ at redshifts 0.2 < z < 4 (Ilbert et al. 2013). |
The conversions from light to mass are derived or calibrated using stellar population synthesis models, which encode our knowledge of stellar evolution and of the SEDs of stars, and compute the emergent spectrum for a galaxy with given properties. This knowledge is imperfect, although astronomers have made great progress developing population synthesis models and improving the libraries of empirical and theoretical stellar spectra that they use (for a recent review, see Conroy 2013).
A galaxy (or the Universe as a whole) consists of stars that span a wide range of masses, ages, and metal abundances. The light from those stars may be attenuated by dust before it emerges from the galaxy; the dust dims and generally reddens the galaxy spectrum, and the heated dust re-emits energy in the IR. A galaxy spectrum arises from a composite stellar population whose true distribution of properties is generally unknown. For nearby galaxies, resolved color-magnitude diagrams can reveal the actual distributions of stellar properties, but for most galaxies we can observe only their integrated light, and properties of the emergent spectrum (particularly broadband colors) are often degenerate to different intrinsic properties. An often-noted example is the degeneracy between age, metallicity, and dust attenuation, all of which can redden the spectrum of a galaxy. Observations at higher spectral resolution, for example, of individual spectral lines, can help to resolve some degeneracies (e.g., to constrain stellar metallicities, population ages from absorption line strengths, or reddening from emission line ratios), but never all: The inherently composite nature of stellar populations requires that we make simplifying assumptions when interpreting the light, assumptions that generally cannot be uniquely tested for individual galaxies. Examples of such assumptions include the form of the IMF, the stellar metallicity distribution, the wavelength dependence of dust attenuation, or the precise SFH of the galaxy. The hope is that these assumptions can be made as reasonably as possible, that their impact on derived masses or SFRs can be estimated, and that ultimately they may be tested or constrained by observations in various ways.
The IMF underlies the relation between mass, light, and stellar population age. It controls the ratio of hot, bright stars that dominate the light to cool, faint stars that usually dominate the mass. It regulates the luminosity and color evolution of the integrated stellar population, as stars with different masses evolve at different rates. It also affects the time evolution of the integrated stellar mass, which changes as more massive stars lose gas to the ISM via winds or detonate as SNe.
It is essentially impossible to constrain the IMF from photometric measurements of the integrated light from galaxies: The color of a galaxy does not uniquely reveal its underlying IMF, as there are too many degeneracies to permit useful constraints. Even detailed spectroscopy does not usually offer strong constraints on the IMF overall, although certain spectral features can be useful diagnostics of the number of stars in a given mass range (e.g., Leitherer et al. 1999). The most direct constraints on the IMF come from counting stars as a function of mass in resolved, nearby stellar populations, but they must be very nearby (within our Galaxy and its satellites) to detect sub-solar dwarf stars that dominate the mass of a stellar system. The next-best constraints come from integrated measurements of the mass-to-light ratio for star clusters or galaxies, using kinematics (velocity dispersions or rotation curves) to derive a mass for comparison to the luminosity. However, these measurements are difficult to make for faint galaxies at high redshift, and require careful modeling to account for the role of dark matter and many other effects.
For lack of better information, astronomers often assume that the IMF is universal, with the same shape at all times and in all galaxies. Although the IMF of various stellar populations within the Milky Way appears to be invariant (for a review, see Bastian et al. 2010), recent studies suggest that the low-mass IMF slope may be a function of the global galactic potential, becoming increasingly shallow (bottom-light) with decreasing galaxy velocity dispersion (Conroy & van Dokkum 2012, Geha et al. 2013). It is still unknown, however, how galaxy to galaxy variations may affect the "cosmic" volume-averaged IMF as a function of redshift. In Section 5, we see how a universal IMF can provide a reasonably consistent picture of the global SFH. The exact shape of the IMF at low stellar masses is fairly unimportant for deriving relative stellar masses or SFRs for galaxies. Low-mass stars contribute most of the mass but almost none of the light, and do not evolve over a Hubble time. Therefore, changing the low-mass IMF mainly rescales the mass-to-light ration M / L and, hence, affects both stellar masses and SFRs derived from photometry to a similar degree. Changes to the intermediate- and high-mass region of the IMF, however, can have significant effects on the luminosity, color evolution, and the galaxy properties derived from photometry. It is quite common to adopt the simple power-law IMF of Salpeter (1955), truncated over a finite mass range (generally, 0.1 to 100 M⊙, as adopted in this review). However, most observations show that the actual IMF turns over from the Salpeter slope at masses < 1 M⊙, resulting in smaller M / L ratios than those predicted by the Salpeter IMF. Some common versions of such an IMF are the broken power-law representation used by Kroupa (2001) and the log-normal turnover suggested by Chabrier (2003).
Dust extinction is another important effect that must often be assumed or inferred, rather than directly measured. The shape of the extinction law depends on the properties of the dust grains causing the extinction. For observations of a single star, photons may be absorbed by dust or scattered out of the observed sightline. However, galaxies are 3D structures with mixed and varying distributions of stars and dust. Photons may be scattered both into and out of the sightline, and the optical depth of dust along the line of sight to the observer will be different for every star in the galaxy. These effects are generally lumped together into the simplifying assumption of a net dust attenuation curve, and such relations have been derived for local galaxy samples both empirically (e.g., Calzetti et al. 2000) and using theoretical modeling (Charlot & Fall 2000). However, all galaxies are not equal, and no net attenuation law is equally appropriate for all galaxies. There can always be stars that are completely obscured behind optically thick dust such that little or none of their light emerges directly from the galaxy, except re-radiated as dust emission. Although this may not be a significant factor for many galaxies, there are certainly some starburst galaxies in which huge and bolometrically dominant star-formation activity takes place in regions screened by hundreds of magnitudes of dust extinction. UV/optical measurements will never detect this light, but the star formation can be detected and measured at other wavelengths, e.g., with FIR or radio data.
In order to derive SFRs or stellar masses for galaxies using stellar population synthesis models, astronomers typically assume relatively simple, parameterized SFHs. However, the SFHs of individual galaxies are unlikely to be smooth and simple; they may vary on both long and short timescales. The fact that young stars are more luminous than older stars leads to the problem of "outshining" (e.g., Papovich et al. 2001, Maraston et al. 2010) - the light from older stars can be lost in the glare of more recent star formation and contributes relatively little to the observed photometry from a galaxy, even if those stars contribute significantly to its mass. SED model fits to galaxies with recent star formation tend to be driven largely by the younger, brighter starlight, and may not constrain the mass (or other properties) of older stars that may be present.
For the Universe as a whole there is one "cosmic" IMF that represents the global average at a given time or redshift, regardless of whether the IMF varies from one galaxy to another. Similarly, there is a "cosmic" distribution of metallicities, a "cosmic" net attenuation of starlight by dust at a given wavelength, and the Universe as a whole obeys one "cosmic" SFH that, moreover, was probably relatively smooth over time - i.e., any stochasticity or "burstiness" averages out when considered for the Universe as a whole. In principle, these facts can simplify the determination of the cosmic SFH, particularly when it is derived from measurements of integrated light averaging over all galaxies. In practice, however, astronomers often derive SFRs and stellar masses for individual galaxies in their deep surveys, and then sum them to derive comoving volume averages. In which case, some of the advantages of the "cosmic averaging" are reduced.
There are many ways in which to infer SFRs from observations of the integrated light from galaxies. Kennicutt (1998) and Kennicutt & Evans (2012) have presented extensive reviews of this topic, and here we recap only points that are especially relevant for measurements of the global SFH, particularly at high redshift. Virtually all observational tracers of star formation fundamentally measure the rate of massive star formation, because massive stars emit most of the energy from a young stellar population. However, different observational tracers are sensitive to different ranges of stellar masses: hence, they respond differently as a function of stellar population age. For example, Hα emission arises primarily from HII regions photoionized by O stars with lifetimes shorter than 20 Myr, whereas the UV continuum is produced by stars with a broader mass range and with longer lifetimes. The time-dependence of different indicators can complicate efforts to derive accurate SFRs for individual galaxies, especially if their SFRs may be rapidly changing (e.g., during a starburst event), but they should average out when summing over a whole population of galaxies.
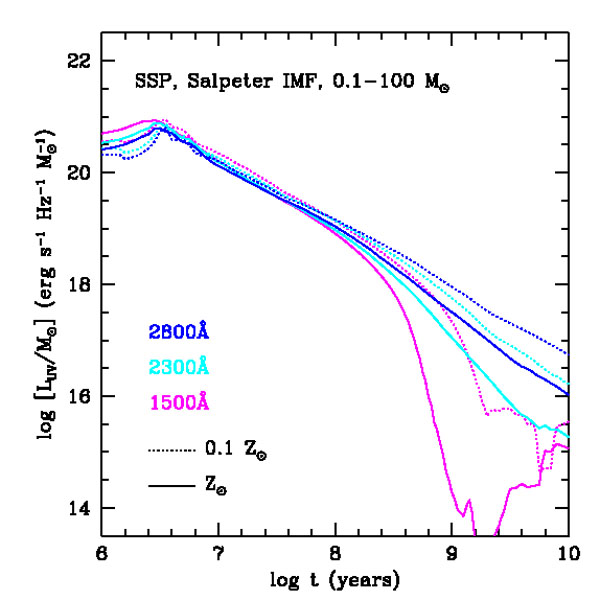
3.1.1 UV light Newly-formed stellar populations emit radiation over a broad spectrum. For a normal IMF, low-mass stars dominate the mass integrated over the whole stellar population, but at young ages the luminosity is dominated by ultraviolet emission from massive stars. These stars have short lifetimes, so the UV emission fades quickly. For a Salpeter IMF, the 1,500-Å luminosity from an evolving simple stellar population (SSP) (i.e., an ensemble of stars formed instantaneously and evolving together) with solar metallicity fades by a factor of 100 after 108 years, and by factors of 103 to 106 after 109 years, depending on metallicity (Figure 2). Bolometrically, at least half of the luminous energy that an SSP produces over a 10-Gyr cosmic lifetime emerges in the first 100 Myr, mostly in the UV, making this a natural wavelength from which to infer SFRs.
For a galaxy forming stars at a constant rate, the 1,500-Å luminosity stabilizes once O-stars start to evolve off the main sequence. For solar metallicity, by an age of 107.5 years, the 1,500-Å luminosity has reached 75% of its asymptotic value, although convergence is somewhat slower at lower metallicity (Figure 2). For these reasons, the UV luminosity at wavelengths of ~ 1,500 Å (wavelengths from 1400 Å to 1700 Å have been used in the literature for both local and high redshift studies) is regarded as a good tracer of the formation rate of massive stars, provided that the timescale for significant fluctuations in the SFR is longer than a few 107 years. For shorter bursts or dips in the SFR, changes in the UV continuum flux may lag those in the SFR and smooth over such variations.
 |
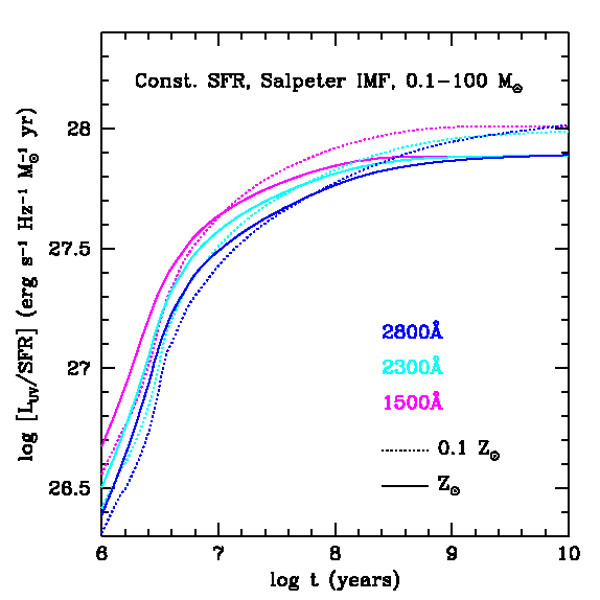 |
Figure 2. (Left panel) Time dependence of the UV luminosity of an SSP with initial mass 1 M⊙, formed with a Salpeter IMF in the range 0.1-100 M⊙, measured at three wavelengths, 1,500 Å, 2,300 Å, and 2,800 Å, and computed with the stellar population synthesis models of Conroy et al. (2009): (solid lines) solar metallicity (Z∗ = 0.02), (dashed lines 1/10th solar metallicity (Z∗ = 0.002). (Right panel) Time dependence of the UV luminosity per unit SFR for a model with a constant SFR, shown for the same UV wavelengths and metallicities as in the left panel. |
|
Although the 1,500-Å rest frame is readily accessible with ground-based optical observations of galaxies at redshifts z ≳ 1.4, measurements at lower redshifts require space-based UV data (e.g., from GALEX or HST) or are limited to longer UV wavelengths. Mid-UV reference wavelengths that have been used in the literature include 2,300 Å (the approximate central wavelength of the GALEX near-UV passband) and 2,800 Å (used, e.g., by Lilly et al. 1996). The mid-UV emission from a galaxy can have a larger contribution from longer-lived, lower-mass stars, particularly at later ages, and the time evolution of the luminosity is more gradual. This is particularly true after ~ 250 Myr, when the 1,500-Å luminosity of an SSP drops off sharply, whereas the 2,800-Å luminosity continues to fade at an approximately exponential rate (Figure 2). For a constant SFR, the UV spectral slope reddens moderately with time, as the 1,500 Å luminosity reaches a steady-state level earlier, while longer-lived (B and A) stars continue to build up and contribute to the 2,800 Å luminosity. This complicates the conversion from luminosity to SFR, as well as any correction for dust extinction based on the UV spectral slope. Still, for young ages, both shorter and longer UV wavelengths usefully trace the SFR and have been used extensively in the literature. Moreover, longer UV wavelengths are subject to somewhat lesser dust attenuation. Wavelengths shorter than that of Lyα (1,216 Å) are rarely used to estimate SFRs, particularly at high redshift where absorption from neutral hydrogen in the IGM is strong.
The UV luminosity output by a stellar population also depends on its metallicity, which affects stellar temperatures and line blanketing. Generally speaking, less-metal-rich stars produce more UV light. The amplitude of this effect is not insignificant, and depends on the details of the SFH. From a Salpeter IMF and constant SFR, the range of FUV luminosity per unit SFR for stars spanning a factor of 100 in metallicity (from Z = 0.0003 to 0.03) is less than 0.24 dex, or 70%. These variations are larger at higher metallicities and older ages; therefore, we may expect significant evolution in the LFUV to the SFR conversion factor as the global metallicity of galaxies evolves.
We express the conversion factor between the intrinsic FUV-specific luminosity Lν(FUV) (before extinction, or corrected for extinction) and the ongoing SFR as
 |
(10) |
where Lν(FUV) is expressed in units of erg
s-1 Hz-1 and SFR in units of
M⊙ year-1.
The precise value of the conversion factor
 FUV is sensitive
to the recent SFH and metal-enrichment history as well as to the choice
of the IMF. It is relatively insensitive to the exact FUV wavelength, as
the UV spectrum of a galaxy
with a constant SFR is quite flat in fν units, at least
for ages much longer than 107 years. Generally in this
review, we use FUV to refer to 1,500-Å
emission or are explicit when we refer to other UV wavelengths.
For a Salpeter IMF in the mass range 0.1-100 M⊙
and constant SFR, the flexible stellar population synthesis (FSPS)
models of
Conroy et al. (2009)
yield FUV =
(1.55, 1.3, 1.1, 1.0) × 10-28 for
logZ∗ / Z⊙ = (+0.2, 0,
-0.5, -1.0)
at age
FUV is sensitive
to the recent SFH and metal-enrichment history as well as to the choice
of the IMF. It is relatively insensitive to the exact FUV wavelength, as
the UV spectrum of a galaxy
with a constant SFR is quite flat in fν units, at least
for ages much longer than 107 years. Generally in this
review, we use FUV to refer to 1,500-Å
emission or are explicit when we refer to other UV wavelengths.
For a Salpeter IMF in the mass range 0.1-100 M⊙
and constant SFR, the flexible stellar population synthesis (FSPS)
models of
Conroy et al. (2009)
yield FUV =
(1.55, 1.3, 1.1, 1.0) × 10-28 for
logZ∗ / Z⊙ = (+0.2, 0,
-0.5, -1.0)
at age  300
Myr. The GALAXEV models of
Bruzual & Charlot
(2003)
yield values of
FUV that are ~
5% smaller.
300
Myr. The GALAXEV models of
Bruzual & Charlot
(2003)
yield values of
FUV that are ~
5% smaller.
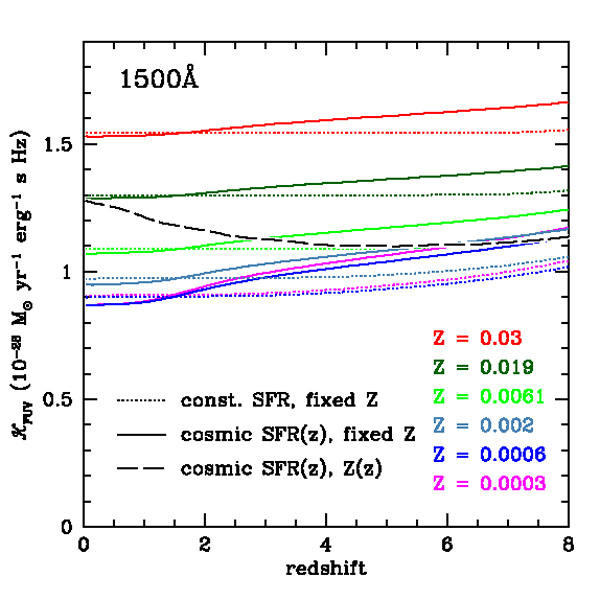
Figure 3 illustrates the combined effects of the
evolution of the global SFR and metal density on the global mean
UV-to-SFR conversion factor as a function of redshift, on the basis of
the FSPS models. Concentrating on the FUV behavior at
1,500 Å, for constant ψ(z), the conversion factor
is nearly constant, though slightly elevated at the highest redshifts as
the cosmic age gets young, particularly for lower metallicity models. A
SFH that increases with time from z = 12 to 1.7, so that the
UV-emitting population is on average younger over that redshift range,
leads to a more gradually declining trend in
FUV(z) with
time. The figure also illustrates one scenario for a global change in
the metallicity of the star-forming population, evolving as
Z∗ = Z⊙
10-0.15z
(Kewley & Kobulnicky
2007).
This particular evolution is only moderately well constrained at lower
redshifts and should be taken as illustrative only, but we may certainly
expect metallicities to be lower on average at higher redshift. The
effects of metallicity dominate over those of age in this scenario, but
the two counterbalance each other other to a certain degree, so that
FUV(z)
changes by less than 20%. At 2,800 Å, the redshift dependence
of NUV(z)
is stronger, particularly at
z < 2 as the global SFRD declines with time, although this may
be partially canceled by the effects of metallicity evolution. This is
an example of why shorter FUV wavelengths should be preferred for
deriving galaxy SFRs.
 |
 |
Figure 3. Age and metallicity
dependence of the SFR to UV luminosity ratio
(= |
|
In this review, we adopt a constant FUV conversion factor
FUV = 1.15
× 10-28 M⊙ year-1
erg-1 Hz
(we typically leave out the units) as a compromise value based on the
evolutionary scenario from Figure 3.
The widely used value from
Kennicutt (1998)
(and based on the calibration by
Madau et al. 1998b),
FUV = 1.4
× 10-28, is 20% larger than our calibration. Other
recent analyses based on the GALAXEV libraries have also found lower
mean conversion factors, both for low- and high-redshift galaxy
populations (e.g.,
Salim et al. 2007,
Haardt & Madau 2012).
The FUV conversion tabulated in
Kennicutt & Evans
(2012)
(from
Murphy et al. 2011),
if rescaled from the Kroupa to Salpeter IMF, is very close to the
z = 0, solar metallicity value
of FUV(z)
in Figure 3, but our somewhat smaller value should
be more representative for the peak era of cosmic star formation at high
redshift. Some authors express FUV luminosity as LFUV
= ν Lν in solar units.
In that case, FUV = 2.2 × 10⁻¹⁰
M⊙ year-1
L⊙-1
at 1,500Å, and the conversion factor will depend on the wavelength.
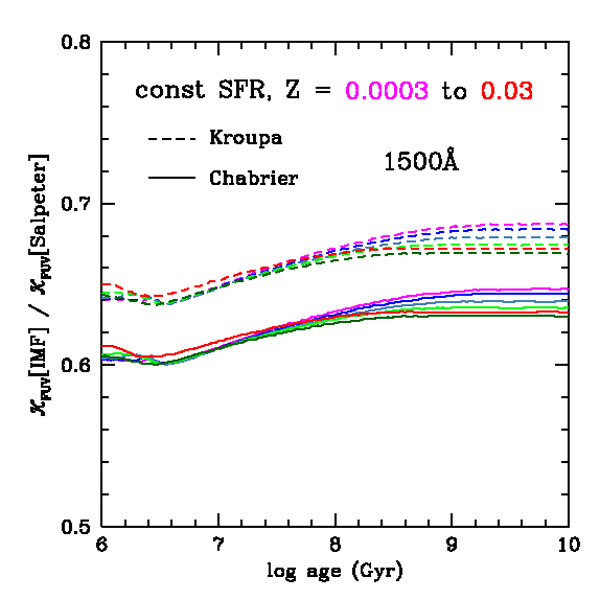
Figure 4 shows the ratio of
FUV for the Chabrier
or Kroupa IMFs to that for the Salpeter IMF as a function of age for a
constant SFR calculated using FSPS. This ratio is nearly constant,
varying by only 5% with age and 3% over a factor of 100 in
metallicity. Where necessary to convert SFRs from the literature from
Chabrier or Kroupa IMFs to the Salpeter IMF, we divide by constant
factors of 0.63 (Chabrier) or 0.67 (Kroupa). Similarly,
Figure 4 examines mass-to-light ratios for an
SSP as a
function of age, in various bandpasses, comparing values for the
Chabrier or Kroupa IMFs to the Salpeter IMF. Again, these ratios are
fairly constant with age and have very little dependence on the
bandpass. In other words, the color evolution for an SSP with Chabrier
or Kroupa IMFs is very similar to that for the Salpeter IMF, showing a
roughly constant offset in M / L. [The similar time
dependence of M / L for the "bottom-light" Chabrier or
Kroupa IMFs to that for the Salpeter IMF is something of a coincidence
(or a conspiracy). The rate of luminosity evolution for an SSP depends
on the logarithmic IMF slope at masses greater than 1
M⊙, and is faster for the flatter x = 1.3
(Kroupa or Chabrier) than for the Salpeter value x =
1.35. However, the evolution of the recycled mass fraction is also
faster for the Kroupa and Chabrier IMFs because their low-mass turnovers
give them smaller mass fractions of long-lived stars. These two effects
roughly cancel for x = 1.3, resulting in a time dependence for
M / L that is nearly the same as that for the Salpeter
IMF. For an SSP with a "bottom-light" IMF with a Salpeter slope x
= 1.35, the ratio of M / L compared with that for a
Salpeter IMF would decrease by ~ 16% over ~ 5 Gyr, and a constant IMF
rescaling factor for derived stellar masses would be inappropriate.]
The dependence on metallicity (not shown) is very weak. To rescale
stellar masses from Chabrier or Kroupa to Salpeter IMF, we divide by
constant factors 0.61 and 0.66, respectively.
 |
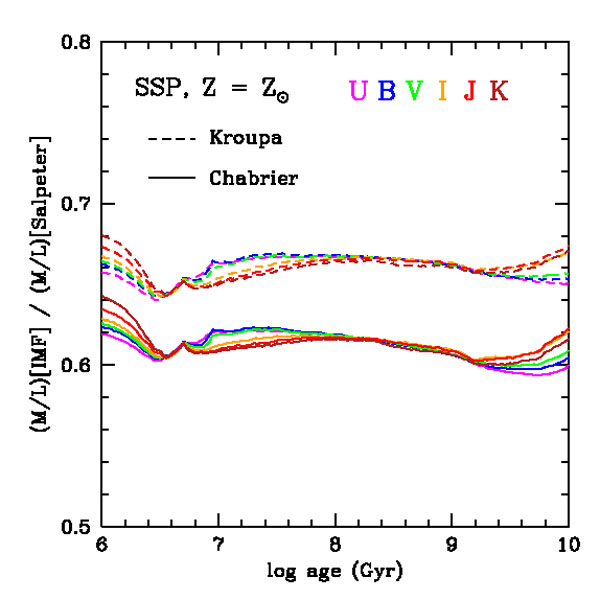 |
Figure 4. (Left panel) The
ratio of SFR / LFUV conversion factors
|
|
The greatest drawback for UV measurements of star formation is the obscuring effect of dust. Extinction is strong in the UV, so even modest amounts of dust can dramatically suppress the emerging UV flux. Dust re-emits the absorbed energy in the IR, which we discuss in the next section. A reliable measurement of SFRs from UV light must either correct for the effects of dust absorption, or measure the absorbed energy directly through IR emission. We will return to the relation between UV dust attenuation and IR emission in Section 3.1.3 below.
3.1.2 INFRARED EMISSION The energy that dust absorbs from the UV is re-radiated at MIR and FIR wavelengths, making IR observations another important tool for measuring SFRs. The effect of dust extinction at FIR wavelengths is generally regarded as negligible, although in the MIR extinction can still be relevant for the most deeply buried star formation and active galactic nuclei (AGN). The total IR luminosity (LIR, usually defined as being integrated over the wavelength range 8-1000 μm) is a measurement of the energy that was absorbed by dust, mainly at UV wavelengths. Because most UV emission comes from star formation, the IR luminosity is often interpreted as being directly proportional to the absorbed fraction of the energy from star formation. However, active nuclei can also produce strong UV emission, often in dusty environments, and may contribute to IR emission by heating dust in the torus and clouds surrounding the AGN. Older stellar populations can also heat dust that is present in the ISM of a galaxy, contributing to the FIR emission. This is important particularly for "mature" galaxies with low current SFRs in the nearby Universe: For a galaxy such as our Milky Way, perhaps half of the FIR emission comes from dust heated by older stars, not from young star-forming regions (Lonsdale Persson & Helou 1987). However, for very actively star-forming galaxies without AGN it is generally assumed that most of the IR emission arises from new star formation. Ideally, a galaxy's total IR luminosity would be measured by fitting a dust emission model to observations at several wavelengths, hopefully spanning the peak of dust emission. In practice, however, such multiwavelength data are often unavailable, and astronomers frequently use an SED template that is often derived from observations of local galaxies to extrapolate from a single observed flux density at some MIR or FIR wavelength, not necessarily close to the dust emission peak, to a total LIR. Thus, variations in the dust emission properties from galaxy to galaxy can lead to significant uncertainties in not only this bolometric correction, but also in the estimation of SFRs.
Arising from various components heated to different temperatures, the spectrum of dust emission is fairly complex. Most of the dust mass in a galaxy is usually in the form of relatively cold dust (15-60 K) that contributes strongly to the emission at FIR and submillimeter wavelengths (30-1,000 μm). Dust at several different temperatures may be present, including both colder grains in the ambient ISM and warmer grains in star-forming regions. Emission from still hotter, small-grain dust in star-forming regions, usually transiently heated by single photons and not in thermal equilibrium, can dominate the MIR continuum (λ < 30 μm) and may serve as a useful SFR indicator (e.g., Calzetti et al. 2007). The MIR spectral region (3-20 μm) is both spectrally and physically complex: It has strong emission bands from polycyclic aromatic hydrocarbons and absorption bands primarily from silicates. The strength of emission from polycyclic aromatic hydrocarbons can depend strongly on ISM metallicity and radiation field intensity (e.g., Engelbracht et al. 2005, 2008, Smith et al. 2007). Strong silicate absorption features are seen when the column density of dust and gas is particularly large toward obscured AGN and perhaps even nuclear starburst regions. AGN may contribute strong continuum emission from warm dust, and can dominate over star formation at MIR wavelengths. By contrast, in the FIR, their role is less prominent.
The Infrared Space Observatory (ISO) and the Spitzer Space Telescope were the first telescopes with MIR sensitivities sufficient to detect galaxies at cosmological redshifts. In particular, Spitzer observations at 24 μm with the MIPS instrument are very sensitive and capable of detecting "normal" star-forming galaxies out to z ≈ 2 in modest integration times. Spitzer is also very efficient for mapping large sky areas. It has a 24-μm beam size that is small enough (5.7 arcsec) to reliably identify faint galaxy counterparts to the IR emission. However, only a fraction of the total IR luminosity emerges in the MIR. As noted above, it is a complicated spectral region that leads to large and potentially quite uncertain bolometric corrections from the observed MIR flux to the total IR luminosity. At z ≈ 2, where 24-μm observations sample rest-frame wavelengths around 8 μm, where the strongest polycyclic aromatic hydrocarbon bands are found, spectral templates based on local galaxies span more than an order of magnitude in the ratio LIR / L8μ m (e.g., Chary & Elbaz 2001, Dale & Helou 2002, Dale et al. 2005). More information about the type of galaxy being observed is needed to choose with confidence an appropriate template to convert the observed MIR luminosity to LIR or a SFR.
The FIR thermal emission is a simpler and more direct measurement of star-formation energy. Partly owing to their large beam sizes that resulted in significant confusion and blending of sources and in difficulty localizing galaxy counterparts, ISO and Spitzer offer only relatively limited FIR sensitivity for deep observations. The Herschel Space Observatory dramatically improved such observations: Its 3.5-m mirror diameter provided a point spread function FWHM (full width half maximum) small enough to minimize confusion and to identify source counterparts in observations from 70 to 250 μm. However, at the longest wavelengths of the Herschel SPIRE instrument, 350 and 500 μm, confusion becomes severe. Herschel observations can directly detect galaxies near the peak of their FIR dust emission: Dust SEDs typically peak at 60-100 μm in the rest frame, within the range of Herschel observations out to z < 4. Temperature variations in galaxies lead to variations in the bolometric corrections for observations at a single wavelength, but these differences are much smaller than for MIR data, generally less then factors of 2.
Despite Herschel's FIR sensitivity, deep Spitzer 24-μm observations, in general, still detect more high-z sources down to lower limiting IR luminosities or SFRs. At z ≈ 2, the deepest Herschel observations only barely reach to roughly LIR∗ [the characteristic luminosity of the "knee" of the IR luminosity function (IRLF)], leaving a large fraction of the total cosmic SFRD undetected, at least for individual sources, although stacking can be used to probe to fainter levels. Deep Spitzer 24-μm observations detect galaxies with SFRs several times lower, and many fields were surveyed to faint limiting fluxes at 24-μm during Spitzer's cryogenic lifetime. Therefore, there is still value in trying to understand and calibrate ways to measure star formation from deep MIR data, despite the large and potentially uncertain bolometric corrections.
In practice, observations of IR-luminous galaxies detected at high redshift with both Spitzer and Herschel have demonstrated that the IR SEDs for many galaxies are well-behaved and that variations can be understood at least in part. Several pre-Herschel studies (Papovich et al. 2007, Daddi et al. 2007, Magnelli et al. 2009, 2011) compared 24-μm observations of distant galaxies with those of other SFR tracers, including Spitzer FIR measurements (either individual detections or stacked averages) and radio emission. On average, the MIR to FIR flux ratios for galaxies at z ≲ 1.3 match those predicted by local IR SED templates such as those of Chary & Elbaz (2001), implying that 24-μm-derived SFRs should be reliable. However, at higher redshift, 1.3 < z < 2.5, the 24-μm fluxes were brighter than expected relative to the FIR or radio data, i.e., SFRs derived from 24-μm data using local SED templates may be systematically overestimated at z ≈ 2. This result was upheld by early Herschel studies (Nordon et al. 2010, Elbaz et al. 2010). In a joint analysis of the IR SED properties of both nearby and high-redshift IR-luminous galaxies, Elbaz et al. (2011) provided an explanatory framework for these observations in terms of the distinction between a majority population of galaxies obeying a "main-sequence" correlation between their SFRs and stellar masses and a minority "starburst" population with substantially higher SFRs per unit mass (or sSFR). Locally, starburst galaxies have more compact, high surface density star forming regions, whereas normal disk galaxies on the star-forming main sequence have star formation distributed on larger scales with lower surface density. Starbursts also have warmer average dust temperatures and a significantly larger ratio between their FIR and 8-μm rest-frame luminosities than those of the main-sequence disk galaxies. Locally, most luminous and ultraluminous IR galaxies (LIRGs and ULIRGs, with LIR > 1011 L⊙ and > 1012 L⊙, respectively) are merger-driven starbursts, but at z ≈ 2 where the SFRs and sSFRs of galaxies are globally much larger, the majority of LIRGs and ULIRGs are "normal" main-sequence galaxies. Their IR SEDs are more similar to those of ordinary, local star-forming spiral galaxies, and have smaller bolometric corrections from observed 24-μm data (rest frame λ ≈ 8 μm) than those predicted by SED templates designed to match local LIRGs and ULIRGs. Elbaz et al. (2011) constructed a "universal" main-sequence SED from the ensemble of high-z Spitzer and Herschel photometry for galaxies in the Great Observatories Origins Deep Survey (GOODS) fields at 0.3 < z < 2.5. This SED leads to consistent total IR luminosities for the large majority of galaxies over that redshift range. Although no single template can be used to accurately derive LIR or SFR from MIR observations for all galaxies, we now have a better understanding of how this can be done on average, which may be sufficient for deriving the global redshift evolution of the IR luminosity density or its corresponding SFRD. Rodighiero et al. (2011) (see also Sargent et al. 2012) showed that starbursts (whose IR SEDs deviate significantly from those of the main-sequence population) account for only 10% of the global SFRD at z ≈ 2. With the data now available from Herschel and Spitzer, a broad understanding of the evolving IRLF and IR luminosity density, at least at 0 < z < 2.5, seems within reach.
MIR and FIR observations require space-based telescopes, but at submillimeter and millimeter wavelengths, observations can once again be made from the ground within certain atmospheric transmission windows. The advent of submillimeter bolometer array cameras such as SCUBA on the JCMT revolutionized the field, and led to the first detections of a large population of ULIRGs at high redshift (e.g., Smail et al. 1997, Hughes et al. 1998, Barger et al. 1998). Until recently, only the most luminous high-z objects could be readily detected, but the new ALMA interferometer will improve detection sensitivities by more than an order of magnitude, albeit over small fields of view. As noted above, submillimeter observations measure emission beyond the peak of dust emission, where flux is declining steeply with wavelength in the Rayleigh-Jeans part of the SED. This leads to a negative K correction so strong that it cancels out the effects of distance: A galaxy with a given IR luminosity will have roughly constant submillimeter flux if it is observed at any redshift 1 < z < 10. By contrast, the bolometric corrections from the observed submillimeter wavelengths to the total IR luminosities are large and depend strongly on dust temperature. This can lead to significant uncertainties interpreting submillimeter fluxes from high-redshift sources, and a bias toward detecting galaxies with the coldest dust emission.
By analogy with Equation 10, we express the conversion from IR luminosity (LIR) to ongoing SFR as
 |
(11) |
where LIR is the IR luminosity integrated over the
wavelength range from 8 to 1,000 μm. Here, it is assumed that
the IR emission is entirely due to recent star formation, but in
practice, AGN and older stars can contribute to dust
heating. Furthermore, if the net dust opacity to young star-forming
regions in a galaxy is not large, and if a significant amount of UV
radiation emerges, then the SFR derived from the IR luminosity will
represent only a fraction of the total. Hence, we write
SFRIR in Equation 11 to
indicate that this is only the dust-obscured component of the SFR. For
this reason, some authors advocate summing the SFRs derived from the
observed IR and UV luminosity densities, the latter uncorrected for
extinction. Once again, we calibrate the conversion factor
IR using the FSPS
models of
Conroy et al. (2009),
which also incorporate dust attenuation and re-emission. We assume
simple foreground-screen dust attenuation from
Calzetti et al. (2000),
although the details of the dust absorption
model matter relatively little. The luminosity integrated from 8 to
1000 μm depends only mildly on the detailed dust emission
parameters (essentially, the dust temperature distribution) for a broad
range of reasonable values. Because the dust luminosity is primarily
reprocessed UV emission from young star formation, the conversion factor
IR also depends
on the details of the SFH and on metallicity. In practice, we may expect
that galaxies with substantial extinction and bolometrically dominant
dust emission are unlikely to have low metallicities; here we assume
solar metallicity for our calibration. We modify Equation 11 to account
for both the FUV and FIR components of star formation:
 |
(12) |
where LFUV is the observed FUV luminosity at
1,500 Åwith no correction for extinction. We use FSPS models
with a Salpeter IMF, solar metallicity, and constant SFR to compute
LFUV and LIR as a function of age
for various levels of dust attenuation: we then solve for
IR.
Figure 5 shows the result of this calculation:
SFR is expressed in units of
M⊙ year-1, and both
the FUV and IR luminosities are expressed in solar units (with
LFUV = ν Lν) to display both
on the same scale. As shown in Section 3.1.1, the
FUV emission reaches a steady
state after ~ 300 Myr, and for this calculation, we use the asymptotic
value FUV = 2.5
× 10-10
M⊙ year-1
L⊙-1 (equivalently,
FUV = 1.3 ×
10-28 M⊙ year-1
erg-1 Hz). Instead, LIR
increases slowly (hence, KIR decreases) as the optical
rest-frame luminosity of longer-lived stars continues to build, some
fraction of which is then absorbed by dust and re-emitted. This model
with constant SFR and constant dust attenuation results in a modest
effect of ~ 0.1 dex in
logIR per dex in
logt. However, in practice,
older stars will likely have lower dust extinction than younger stars,
thus further reducing this trend. At ages of a
few 108 years, KIR depends very
little on the total extinction.
Kennicutt (1998)
proposed a calibration
factor IR = 1.73
× 10-10
M⊙ year-1
L⊙-1, which is fully consistent with
the models shown in Figure 5 for an age of
300 Myr. We adopt that value for this review. For luminosities
measured in cgs units, we can write
IR = 4.5 ×
10-44
M⊙ year-1 erg-1 s.
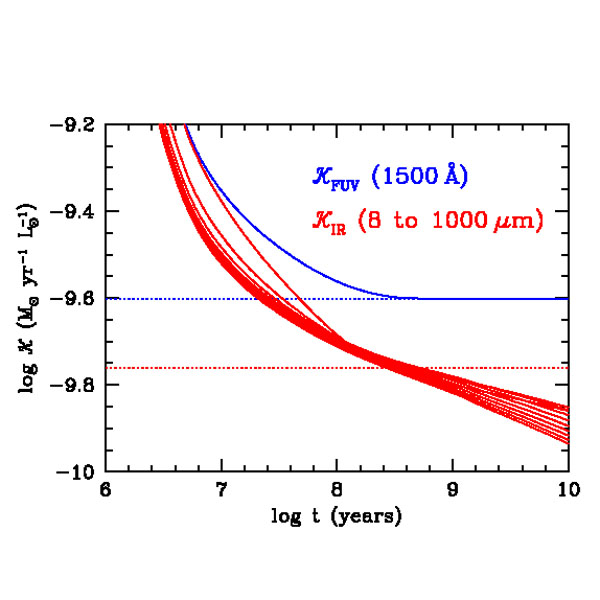 |
Figure 5. The SFR to luminosity ratio
|
3.1.3 UV EXTINCTION AND IR EMISSION As noted above, dust can substantially attenuate UV emission, not only compromising its utility for measuring SFRs, but also producing IR emission, which is a valuable tracer of star-formation activity. Considerable effort has been invested in understanding the physics and phenomenology of extinction in galaxies (for a review, see Calzetti 2001). In principle, the best way to account for the effect of dust attenuation is to directly measure the energy emitted at both UV and IR wavelengths, i.e., both the luminosity that escapes the galaxy directly and that which is absorbed and re-radiated by dust. This provides a "bolometric" approach to measuring SFRs. In practice, however, data sensitive enough to measure FIR luminosities of high-redshift galaxies are often unavailable. Herschel greatly advanced these sorts of observations, but its sensitivity, although impressive, was sufficient to detect only galaxies with high SFRs > 100 M⊙ yr-1, at z > 2.
For star-forming galaxies with moderate extinction at z > 1, optical photometry measuring rest-frame UV light is obtained much more easily than are suitably deep FIR, submillimeter or radio data. Current observations of UV light are also typically much more sensitive to star formation than are those at other wavelengths (Figure 1). As a result, trying to infer SFRs from rest-frame UV observations alone it tempting, but this requires reliable estimates of dust extinction corrections. For example, Lyman break galaxies (LBGs) are a UV-selected population of star-forming high-redshift galaxies. Their selection would favor relatively low extinction, but even LBGs are quite dusty: Reddy et al. (2012) used Herschel observations to determine that, on average, 80% of the FUV emission from typical (~ LFUV∗) LBGs at z ≈ 2 is absorbed by dust and re-radiated in the FIR. Many more massive galaxies with high SFRs have greater extinction. So-called dust-obscured galaxies (Dey et al. 2008) have MIR to UV flux density ratios > 1,000 (typically corresponding to LIR / LFUV > 100) (Penner et al. 2012) and are quite common, contributing 5-10% of the SFRD at z ≈ 2 (Pope et al. 2008); many of these are nearly or entirely invisible in deep optical images.
Nevertheless, the widespread availability of rest-frame UV data for high-redshift galaxies encourages their use for measuring the cosmic SFH. Presently, at z ≫ 2, there is little alternative: Even the deepest Spitzer, Herschel, radio, or submillimeter surveys can detect only the rarest and most ultraluminous galaxies at such redshifts. By contrast, deep optical and NIR surveys have now identified samples of thousands of UV-selected star-forming galaxies out to z ≈ 7 and beyond.
Attempts to measure and correct for dust extinction in high-z galaxies have generally used the ultraviolet spectral slope (designated β) as a measure of UV reddening, and have adopted empirical correlations between UV reddening and UV extinction. Calzetti et al. (1994, 2000) used ultraviolet and optical spectroscopy to derive an empirical, average dust attenuation curve for a sample of local UV-bright star-forming galaxies. Meurer et al. (1999) (later updated by Overzier et al. 2011) used UV and FIR data for a similar local sample to empirically calibrate the relation between UV reddening (β) and UV extinction (IRX ≡ LIR / LFUV, which can be directly related to AFUV). The reasonably tight IRX-β relation obeyed by the local UV-bright galaxies is broadly consistent with the Calzetti attenuation law, hence reinforcing its popularity. However, other local studies showed clearly that some galaxies deviate from these relations. Goldader et al. (2002) found that nearby ULIRGs deviate strongly from the Meurer IRX-β relation; these ULIRGs have very large values of IRX but often with relatively blue UV spectral index β. This was interpreted to mean that that the observed UV light from local ULIRGs is relatively unreddened star formation in the host galaxy that is unrelated to the bolometrically dominant star formation, which is entirely obscured from view at UV-optical wavelengths, and detected only in the FIR. Instead, observations of ordinary spiral galaxies (Kong et al. 2004, Buat et al. 2005) measured redder values of β for a given IRX. This is generally taken as evidence that light from older and less massive stars contributes significantly to the near-UV emission, leading to redder UV colors for reasons unrelated to extinction. In general, different relative distributions of stars and dust can lead to different net attenuation properties. Extinction can easily be patchy: Winds from star-forming regions can blow away dust on certain timescales, whereas other regions that are younger or more deeply embedded in the galaxy's ISM remain more heavily obscured. Dust heating also depends on geometry, leading to different distributions of dust temperatures and different emission spectra at IR and submillimeter wavelengths.
At high redshift there are only relatively limited tests of the relation between UV reddening and extinction. Reddy et al. (2004, 2006, 2010, 2012) have compared various SFR tracers (including radio, Spitzer 24-μm, and Herschel 100-160-μm emission) to show that Calzetti/Meurer UV extinction laws are broadly appropriate for the majority of L∗ LBGs at z ≈ 2. However, they found evidence for systematic deviations for galaxies with the largest SFRs (> 100 M⊙ year-1), which, similar to local ULIRGs, show "grayer" effective attenuation (i.e., less UV reddening for their net UV extinction). They also found evidence for systematic deviations for the youngest galaxies, which show stronger reddening for their net FUV extinction, perhaps because of the metallicity or geometric effects that steepen the wavelength dependence of the UV reddening function compared with results from the Calzetti law. Assuming Calzetti attenuation, Daddi et al. (2007) and Magdis et al. (2010) also found broad consistency between UV-based and IR- or radio-based SFR measurements for samples at z ≈ 2-3 (although, see Carilli et al. 2008). However, studies that have selected galaxies primarily on the basis of their IR emission have tended to find significant deviations from Meurer/Calzetti attenuation. In general, these deviations indicate that UV-based SFRs using Meurer/Calzetti UV slope corrections significantly underestimate total SFRs (e.g., Chapman et al. 2005, Papovich et al. 2007). Such studies have also found that differently-selected populations may obey systematically different net dust attenuation relations depending on the properties of the galaxies (Buat et al. 2012, Penner et al. 2012).
Therefore, we must remain cautious about SFRs derived from UV data alone, even when estimates of UV reddening are available. Current evidence suggests that these may work well on average for UV-bright LBGs with relatively low reddening but may fail for other galaxies including the most IR-luminous objects that dominate the most rapidly star-forming galaxy population. Star formation that is obscured by too much dust, e.g., in compact starburst regions, will be unrecorded by UV observations, and can be measured directly only with deep IR, submillimeter, or radio measurements.
3.1.4 OTHER INDICATORS: NEBULAR LINE, RADIO, AND X-RAY EMISSION Star formation also produces nebular line emission from excited and ionized gas in HII regions. Recombination lines of hydrogen such as Hα and Lyα are often used to measure SFRs, because they have a close relation to photoionization rates that are mainly due to intense UV radiation from OB stars. Hence, they trace massive star formation quite directly, although the presence of AGN can also contribute to these lines. Other lines from heavier elements such as [OII] 3,727 Å or [OIII] 5,007 Å have been used, but they tend to have more complex dependence on ISM conditions such as metallicity or excitation. Emission lines are also subject to absorption by dust in the star-forming regions. This is particularly true for Lyα, which is a resonance line, scattered by encounters with neutral hydrogen atoms. Such encounters can greatly increase the path length of travel for Lyα, and hence increase the likelihood that it may encounter a dust grain and be absorbed. Overall, Hα is regarded as the most reliable among the easily accessible nebular SFR tracers (e.g., Moustakas et al. 2006). Weaker but less extinguished hydrogen lines in the NIR, like Paschen α, can be very useful for measuring SFRs in dusty galaxies, but they are generally accessible only at very low redshift, although the JWST will open the possibility for measuring these for significant numbers of galaxies at cosmological distances.
Radio emission is also correlated with star formation, as SN-accelerated electrons emit non-thermal radiation at centimeter wavelengths; thermal (free-free) emission from electrons in HII regions can also contribute, particularly at higher frequencies (> 5 GHz). The physics is somewhat complicated and not entirely understood, but a remarkably tight correlation is observed between radio emission and FIR emission in local galaxies spanning many orders of magnitude in luminosity (e.g., Condon 1992, Yun et al. 2001). Radio emission is free from dust extinction, and thus offers a relatively unbiased tracer of star formation. However, it is difficult to obtain radio observations deep enough to detect ordinary star-forming galaxies at high redshift, although recent upgrades to the Karl G. Jansky VLA have significantly improved its sensitivity. AGN can also contribute to radio emission, occasionally dominating for radio-loud AGN (which are a minority population). Radio emission should also be suppressed at earlier cosmic epochs, as electrons should lose energy by inverse Compton scattering off microwave background photons whose energy density increases at high redshift. Recent studies have found little evidence for redshift evolution in the FIR to radio correlation (Appleton et al. 2004; Ivison et al. 2010a, b; Sargent et al. 2010a, b; Mao et al. 2011).
Even X-rays have been used to trace SFRs. X-rays are typically regarded as a quintessential signature of AGN activity in galaxies, but they are also produced by young stellar populations, notably by X-ray binaries. In the absence of an AGN, X-ray emission may be measured from individual star-forming galaxies out to z ≈ 1 in the deepest Chandra fields, and stacking measurements have been used to reach fainter fluxes in studies of UV-selected galaxies, with detections at 1 < z < 4 and upper limits at higher redshifts (Reddy & Steidel 2004; Lehmer et al. 2005; Laird et al. 2005, 2006; Basu-Zych et al. 2013). However, the proportionality between X-ray luminosity and SFR may vary with stellar population age and other parameters that could affect the mix of low- and high-mass X-ray binaries present in a galaxy; various calibrations that differ significantly have been published (e.g., Ranalli et al. 2003, Persic et al. 2004). Overall, because most of the cosmic X-ray background arises from AGN (for a review, see Brandt & Hasinger 2005), the value of using X-rays to measure the cosmic SFH seems limited (we do not discuss this method further).
Whereas hot young stars emit most of their energy at UV wavelengths, the cooler low-mass stars that dominate the stellar mass of a galaxy emit most of their light at red optical and NIR wavelengths. If we examine the SED of an evolving SSP from ages older than 109 years, the bulk of the luminosity (in λ fλ energy units) is emitted in a broad plateau between 0.4 and 2.5 μm, peaking at ~ 1 μm for ages > 2 Gyr. (In fν flux density or AB magnitude units, the SED peak is at approximately 1.6 μm, where there is a minimum in the H- opacity of cool stellar atmospheres.) The effects of dust extinction are also greatly reduced at NIR wavelengths: For Calzetti attenuation, the extinction (in magnitudes) A in the K-band is 10 times smaller than that in the V-band and 25 times smaller than that at 1,600 Å.
The luminosity, and hence the mass-to-light ratio, of a stellar population evolves very steeply with time at UV and blue wavelengths: Young stars evolve quickly off the main sequence but more slowly at red and NIR wavelengths. Therefore, observations in the NIR rest frame more closely trace the integrated stellar mass of a galaxy, but we cannot neglect the effects of evolution: The flux at 1 μm still changes by more than an order of magnitude as a stellar population ages from 0.1 to 10 Gyr (see, e.g., figure 9 from Bruzual & Charlot 2003). Therefore, we need to do more than simply measure the NIR luminosity to infer a stellar mass.
In effect, astronomers use the colors or SED of a galaxy to infer the expected mass-to-light ratio at some wavelength (preferably in the red or NIR) and then multiply the observed luminosity by M / L to estimate the stellar mass (M∗). The most common method is to fit spectral templates generated by stellar population synthesis models to broadband photometry in whatever bands are available that span rest-frame UV to NIR wavelengths, where stellar photospheric emission dominates the galaxy light. Generally speaking, researchers generate a large suite of models that span a wide range of stellar population parameters, including the past SFH, age, metallicity, and dust attenuation. The IMF is typically fixed, because there is almost no photometric signature that can usefully constrain it. The suite of models is redshifted to match a galaxy of interest. The models are then convolved by the filter bandpasses to generate synthetic broadband fluxes that are fit to the photometry, allowing the luminosity normalization to vary and minimizing χ2 or some other likelihood parameter. The unnormalized models have a specified unit mass; therefore, the normalization of the best-fitting model provides the best estimate of the galaxy's stellar mass, given the range of input parameters that were allowed.
In principle, this method can be used to constrain other stellar population parameters such as the galaxy's age, SFRs, or the degree of extinction that is present. In practice, the fitting results for various parameters are often quite degenerate. For example, age, extinction, and metallicity all affect the integrated colors of a galaxy. As a result, the derived values of these parameters tend to be highly covariant: A galaxy may be red because it is old, dusty, or very metal rich. With very good photometry, particularly spanning a large range of wavelength and with many bandpasses that can more accurately sample the detailed spectral shape (e.g., measuring relatively sharp age-sensitive features such as the Balmer or 4,000-Å breaks), these constraints can be improved, but it is hard to avoid significant degeneracies. Careful practitioners may consider joint probability distributions for models that fit with acceptable likelihood. The stellar mass tends to be the best-constrained parameter, largely because the degeneracies in other parameters all tend to affect the net M / L of the model in similar ways. Redder colors from age, dust, or metallicity all tend to affect M / L to a similar (but not identical) degree. Whereas parameters such as age or reddening may be individually uncertain, the net M / L of acceptable models does not vary so much. Thus, the total mass is well constrained. Many papers have discussed stellar population modeling uncertainties in estimating galaxy masses; these are very thoroughly reviewed by Conroy (2013).
Other than the choice of the IMF, the largest uncertainty that affects the derived stellar mass is usually the necessarily imperfect knowledge of the galaxy's past SFH. Fundamentally, more recently formed stars can easily outshine older stars and dominate the observed light, even at red wavelengths. The observed photometry may be dominated by the younger starlight, even though the actual galaxy mass may be dominated by older stars that are lost in the glare of the younger stars ("outshining", e.g., Papovich et al. 2001, Maraston et al. 2010) and thus have little impact on the choice of the best-fitting models. Therefore, the model fitting often underestimates the age of the galaxy or the potential contribution of older stars to the mass, and it may also underestimate the mass. If the actual SFH were well known (which is almost never the case in practice) this might not be a problem. For example, the models used to fit the photometry are often assumed to have smoothly-varying SFRs, but the actual SFHs of real galaxies can be complex and nonmonotonic, fluctuating with time and perhaps punctuated by short-duration bursts. Even if very large suites of models with complex SFHs are considered, outshining tends to ensure that recently formed stars drive the model fitting, whereas the mass in older stars is poorly constrained. This effect generally leads to underestimation of galaxy stellar masses (Pforr et al. 2012). Realistically constraining the distribution of allowable past SFHs for real galaxies, especially at high redshift, remains a basic limitation when deriving stellar masses.
In practice, these SFH degeneracies are largest for galaxies with recent star formation. For galaxies that have not formed stars in a long while (say > 1 Gyr) or for which the current SFR is small compared with the stellar mass (often quantified by the sSFR), the outshining is small and, thus, so is the resulting systematic uncertainty on M / L. Therefore, stellar masses for present-day elliptical galaxies, which are old with little or no ongoing star formation, or for ordinary spiral galaxies such as the Milky Way tend to be reasonably well-constrained, whereas those for very actively star-forming galaxies are less certain. As an example, Papovich et al. (2001) fit models to HST WFPC2 and NICMOS photometry for faint LBGs at z ≈ 2.5 in the Hubble Deep Field North (HDF-N). When using models with smoothly-varying SFHs, they found stellar mass uncertainties to be σ(logM∗) < 0.5 dex, with typical uncertainties of 0.25 dex, i.e., less than a factor of 2. However, if they considered "maximal M / L" models, which allowed for as much older stellar mass as possible within the χ2 fitting constraints, formed at z = ∞, the masses could in principle be as much as 3 to 8 times larger. In practice, such extreme models seem unlikely. Moreover, the early work of Papovich et al. (2001) used photometry only out to the K-band or rest-frame wavelengths ~ 6,000 Å at z = 2.5. Today, deep Spitzer IRAC photometry routinely measures fluxes for high-z galaxies at redder rest-frame wavelengths and can significantly improve stellar mass constraints. Nevertheless, even with the best data from Spitzer (or the JWST in the future) the effects of outshining fundamentally limit our certainty about stellar mass estimates for individual objects. These effects can be reduced only if reasonable prior assumptions can more tightly constrain the range of allowable SFHs.
Interestingly, at very high redshifts some of these SFH uncertainties are reduced, simply because the Universe is much younger. At z > 6, the Universe is less than 1 Gyr old, and the oldest stars in the galaxies must be younger than that; this sets a cap on M / L for a hypothetical unseen old population and thus on its possible contribution to the total stellar mass. Curtis-Lake et al. (2013) provided a recent and detailed discussion of stellar population modeling uncertainties for galaxies at z ~ 6.
Additionally, the practitioners who create stellar population models have not reached complete consensus: Questions regarding evolutionary tracks, the contributions of certain stellar sub-populations, and the behavior of stellar populations at low and high metallicities remain topics of debate or are poorly calibrated by observations. One widely recognized example of such uncertainties was highlighted by Maraston (2005), whose models featured significantly greater contributions of emission from thermally pulsating asymptotic giant branch (TP-AGB) stars to the red and NIR rest-frame light at SSP ages between a few hundred million years and ~ 2 Gyr. The enhanced red luminosity led to lower M / L at these wavelengths and redder colors, with potentially quite significant effects (factors of 2 or more) in derived stellar masses for galaxies dominated by stars in this age range. Although such populations may not dominate in most present-day galaxies, at z ≈ 2-4 when the Universe was only a few billion years old their role must be accurately modeled to ensure proper estimates of stellar masses. Maraston et al. (2006) found that this could reduce derived stellar masses by ~ 60% on average for K-band-selected star-forming galaxies at z ≈ 2 compared with results computed using the popular models of Bruzual & Charlot (2003). Although Bruzual et al. (2013) released new models in 2007 that featured enhanced TP-AGB emission, they have argued in recent conference presentations for weaker TP-AGB emission more similar to that in the older models. Given the lack of completely satisfactory way to compute this contribution on theoretical principles, a lot hangs on the sparseness of data available to empirically calibrate the emission and evolution of TP-AGB stars.