


The observed demographics of supermassive black holes (BHs) and their implications for the coevolution (or not) of BHs and host galaxies are discussed in Kormendy & Ho (2013). This is a 143-page ARA&A review that revisits methods used to measure BH masses M• using spatially resolved stellar and gas dynamics. It also provides a detailed analysis of host galaxy morphologies and properties. Careful treatment of the M• and galaxy measurements allows Kormendy and Ho to reach a number of new science conclusions. They are summarized in this section.
Graham (2015) reviews the same subject in the present book. Some of his review is historical, especially up to the beginning of his Section 4.1 but also sporadically thereafter. I do not comment here on the historical review. However, on the science, I cannot “duck” my responsibility as author of this concluding chapter :
I disagree with most of the scientific conclusions in Graham (2015). Starting in his Section 4.1, his discussion uses data and repeats conclusions from Graham & Scott (2013, 2015). Problems with the 2013 data are listed in KH13 (p.555); a point made there that is not repeated further here is that many of Graham's galaxy classifications are incorrect. Here, rather than write a point-by-point rebuttal to Graham (2015), I first concentrate on a summary of the unique strengths of the KH13 analysis and data. However, a few comments are added to further explain the origin of the disagreements with Graham (2015). I then summarize the KH13 results and conclusions about M• – host-galaxy correlations (Sections 6.1 and 6.2).
Before I begin, a comment is in order about how readers react to disagreements in the literature. The most common reaction is that the subject needs more work. Specialists may know enough to decide who is correct. But the clientele community of non-specialists who mainly want to use the results often do not delve into the details deeply enough to decide who is correct. Rather, their reaction is that this subject needs further work until everybody agrees that the disagreement is resolved. Sometimes, this is an appropriate reaction, when the issues are more complicated than our understanding of the physics, or when measurements are still too difficult, or when results under debate have low significance compared to statistical errors or systematic effects. My reading of the community is that reactions to disagreements on BH demographics take this form.
However, I suggest that we already know enough to decide who is correct in the disagreement between KH13 and Graham (2015). Our ARA&A review and the Graham & Scott papers both provide enough detail to judge the data and the analysis. It is particularly important to note how these separate discussions do or do not connect up with a wide body of results in other published work, including other chapters in this book. A strength of the Kormendy & Ho analysis is that it connects up with – i.e., it uses and it has implications for – a wide variety of aspects of galaxy formation.
Strengths of the data and suppoprting science that are used by KH13 include the following. Some of these points are discussed more fully in the Supplemental Material of KH13.
These procedural differences plus others summarized in KH13 or omitted here for the sake of brevity account for most of the differences in the correlation plots shown in Graham (2015) and those in KH13. Generically, they have the following effects (ones in italics also apply to McConnell & Ma 2013). (1) At the high-M• end, Graham's BH masses are biased low, because he uses underestimated values from emission-line rotation curves, because he uses M• values that are not corrected for effects of halo dark matter, and because he does not consistently use the Rusli et al. (2013) high-M• galaxies. (2) At the low-M• end, Graham's BH masses are biased low, because he includes pseudobulges. Differentiating barred and unbarred galaxies is not sufficient to solve this problem. McConnell and Ma also include pseudobulges, differentiating early- and late-type galaxies helps, although many S0s contain pseudobulges. (3) Graham regards MM32 as pathological and omits it. KFCB show that it is a normal, tiny elliptical. Including it in KH13 helps to anchor the BH correlations at low BH masses. (4) The result is that the BH–host correlations have much larger scatter in Graham (2015) and in McConnell & Ma (2013) than they do in KH13 (see Figures 5 and 7 below). Also, Graham sees a kink in the logM• – MK,bulge correlation whereas we do not, and he sees no kink in the logM• – logσ whereas we see signs of a kink at high σ where M• becomes largely independent of σ. McConnell & Ma (2013) and KH13 agree on the kinks (and lack of kinks) in the M•–host-galaxy correlations.
6.1. Correlations Between BH Mass and Host Galaxy Properties from Kormendy & Ho (2013)
This section summarizes the BH–host-galaxy correlations from KH13.
The procedures summarized above lead in KH13 to Table 2 for 44 elliptical galaxies and Table 3 for 20 classical bulges and 21 pseudobulges. Figure 5 shows the resulting logM• – MK,bulge and logM• – logσ correlations for classical bulges and ellipticals. Mergers in progress are omitted as explained above, and three “monster” BHs that deviate above the correlations are illustrated in faint symbols but are omitted from the fits. Also shown are symmetric, least-squares fits (Tremaine et al. 2002) symmetrized around LK,bulge = 1011 LK⊙ and σe = 200 km s−1:
 |
(1) |
 |
(2) |
Here, we adopt equal errors of Δ MK,bulge = 0.2 and Δ logM• = 0.117, i.e., the mean for all fitted galaxies. Then the intrinsic scatters in Equations (1) and (2) are 0.30 dex and 0.29 dex, respectively. In physically more transparent terms,
 |
(3) |
 |
(4) |
Both relations have shifted to higher BH masses because of corrections to M•, because mergers in progress are omitted, and because pseudobulges are postponed.
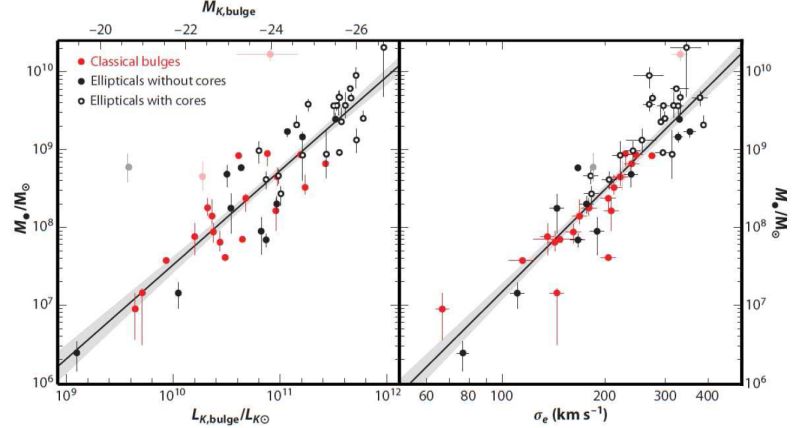 |
Figure 5. Correlations of BH mass M• with the K-band absolute magnitude and luminosity of the host bulge (left panel) and with its velocity dispersion at radii where σe is unaffected by the BH (right panel). Black points are for ellipticals; a white center indicates that this galaxy has a core. Red points are for classical bulges. The lines are Equations (1) and (2). Note: the M• – MK,bulge correlation remains log-linear with no kink at high luminosities. In contrast, the biggest BH masses look essentially independent of σe in ellipticals that have cores. From KH13. |
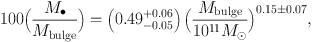
The logM• – LK,bulge correlation in Figure 5 is converted to a correlation with bulge stellar mass Mbulge by applying mass-to-light ratios that were engineered by KH13 to be independent of the papers that determine M•, to have zeropoints based on the Williams et al. (2009) dynamical models, but also to take variations in stellar population age into account. The resulting mass correlation is:
 |
(5) |
with an intrinsic scatter of 0.28 dex. The BH mass fraction, M• / Mbulge = 0.49−0.05+0.06% at Mbulge = 1011 M⊙, is approximately a factor of 4 larger than we thought before the M• values were corrected (Merritt & Ferrarese 2001; Kormendy & Gebhardt 2001; McClure & Dunlop 2002; Marconi & Hunt 2003; Sani et al. 2011).
Note again that M• – Lbulge is a single power law with no kink, whereas M• – σ is a power law that “saturates” at high M• (see also McConnell & Ma 2013). That is, M• becomes nearly independent of σ in the highest-σ galaxies that also have cores (Figure 5). We understand why: The Faber-Jackson L – σ correlation saturates at high L, because σ does not grow very much once galaxies are massive enough so that all mergers are dry (Figure 6). This is seen in simulations of dry, major mergers by (e.g.) Boylan-Kolchin, Ma, & Quataert (2006) and by Hilz et al. (2012). Section 4.1.1 reviewed arguments why core ellipticals are remnants of dry mergers.
 |
Figure 6. Faber-Jackson (1976) correlations for core ellipticals (black) and coreless ellipticals (red). Total V-band absolute magnitudes MV,total, velocity dispersions σ, and profile types are mostly from Lauer et al. (2007b) or otherwise from KFCB. The lines are symmetric least-squares fits to core Es (black line) and coreless Es (red line) with 1-σ uncertainties shaded. The coreless galaxies show the familiar relation, σ ∝ LV0.27 ± 0.02. But velocity dispersions in core ellipticals increase only very slowly with luminosity, σ ∝ LV0.12 ± 0.02. As a result, M• becomes almost independent of σ for the highest-σ galaxies in Figure 5. This figure from KH13 is based on Kormendy & Bender (2013). Lauer et al. (2007a) and Cappellari et al. (2013a, b) show closely similar diagrams. |
The pseudobulges that were postponed from Figure 5 are added to the BH–host correlations in Figure 7. Hu (2008) was the first person to show that pseudobulges deviate from the M• – σe correlation in having small BH masses. This was confirmed with larger samples and extended to the M• – MK,bulge and M• – Mbulge correlations by Greene et al. (2010) and by Kormendy, Bender, & Cornell (2011). Figure 7 now shows this result for the largest available sample, that of KH13.
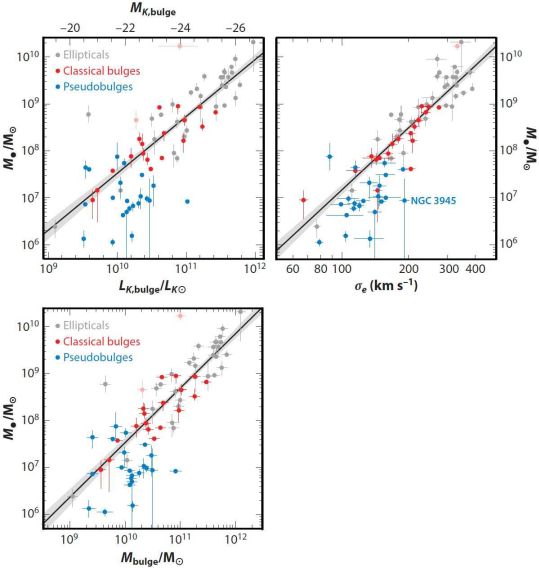 |
Figure 7. Correlations of BH mass with the K-band absolute magnitude and luminosity of the host bulge (top-left panel), with its stellar mass (bottom panel), and with the mean velocity dispersion of the host bulge at radii that are large enough so that σe is unaffected by the BH (right panel). Gray points are for ellipticals, red points are for classical bulges, and blue points are for pseudobulges. The lines with shaded 1-σ uncertainties are symmetric least-squares fits to the classical bulges and ellipticals. In all panels, pseudobulge BHs are offset toward smaller M• from the correlations for classical bulges and ellipticals. Absent any guidance from the red and gray points, we conclude the pseudobulge BHs do not correlate with their hosts in any way that is strong enough to imply BH-host coevolution. From KH13, who tabulate the data and give sources. |
Hints of this result are seen in McConnell & Ma (2013); they compare early- and late-type galaxies and note that many late-type galaxies have undermassive BHs. This captures some of the result in Figure 7 but not all of it, because many S0 galaxies contain pseudobulges. Similarly, Graham (2015) compares barred and unbarred galaxies and concludes that many barred galaxies have undermassive BHs. Again, this result is related to Figure 7 – many (but not all) barred galaxies contain pseudobulges, and many (but not all) unbarred galaxies contain classical bulges.
In Figure 7, the highest-M• pseudobulge BHs largely agree with the correlations for classical bulges and ellipticals; the lowest-M• BHs deviate, but not by much more than an order of magnitude. Note that the BHs that we find in pseudobulges may be only the high-M• envelope of a distribution that extends to much lower BH masses. Still, why are pseudobulge BHs even close to the correlations? KH13 argue that this natural: even one major merger converts a pseudobulge to a classical bulge, and then merger averaging manufactures an essentially linear correlation with a zeropoint near the upper end of the mass distribution of progenitors (see Figure 37 in KH13 and Peng 2007; Gaskell 2010, 2011; Hirschmann et al. 2010; Jahnke & Macciò 2011, who developed this idea).
Turning next to disks: Figure 8 confirms the conclusion reached in Kormendy & Gebhardt (2001) and in Kormendy, Bender, & Cornell (2011) that BH masses are completely uncorrelated with properties of their host disks.
 |
Figure 8. Black hole mass M• vs K-band absolute magnitude of the disk of the host galaxy. Filled circles are for galaxies with BH detections based on spatially resolved stellar or gas dynamics; open circles are for galaxies with upper limits on M•. The strongest upper limit is M• ≲ 1500 M⊙ in M33 (Gebhardt et al. 2001). Red and blue circles are for galaxies with classical and pseudo bulges, respectively. Green points are for galaxies with no classical bulge and (almost) no pseudobulge but only a nuclear star cluster. From KH13, who tabulate the data and give sources. |
, with its strong upper limit on M•, briefly gave us the feeling that pure disks might not contain BHs. But it was clear all along that they can have AGNs. Figure 8 includes bulgeless galaxies in which we find 106 ± 1 - M⊙ BHs. The prototypical example is NGC 4395, a dwarf Sd galaxy with MV = −18.2, with no classical or pseudo bulge, but with only a nuclear star cluster that has an absolute magnitude of MB ≃ −11.0 and a velocity dispersion of σ ≲ 30 ± 5 km s−1 (Filippenko & Ho 2003; Ho et al. 2009). And yet, NGC 4395 is the nearest Seyfert 1 galaxy known (Filippenko & Ho 2003). It shows the signatures of BH accretion – broad optical and UV emission lines (Filippenko, Ho & Sargent 1993), variable X-ray emission (Shih, Iwasawa, & Fabian 2003), and a compact, flat-spectrum radio core (Wrobel & Ho 2006). Peterson et al. (2005) get M• = (3.6 ± 1.1) × 105 M⊙ by reverberation mapping. This is the smallest BH mass measured by reverberation mapping. But the BH in NGC 4395 is much more massive than M• ≲ 1500 M⊙ in the brighter pure-disk galaxy M33 (MV = −19.0).
This is the best example of many that are revealed in the observing programs of Ho, Barth, Greene, and collaborators and reviewed by Ho (2008) and by KH13. Other important galaxies include Pox 52 (Barth et al. 2004; Thornton et al. 2008) and Henize 2-10 (Reines et al. 2011). Broader AGN surveys to find low-mass BHs, many of them in late-type, pure-disk galaxies, include Greene & Ho (2004, 2007), Barth, Greene, & Ho (2008), and Dong et al. (2012). The general conclusion is that classical and even pseudo bulges are not necessary equipment for the formation and nurture of supermassive BHs.
We need one more result before we discuss implications for galaxy evolution:
Very popular for more than a decade has been the suggestion that the fundamental correlation between BHs and their host galaxies is not one with bulge properties but rather is a correlation with halo DM. This was suggested by Ferrarese (2002) and supported by papers such as Baes et al. (2003). The idea is attractive for galaxy formation theory, because then halo mass is the natural parameter to control AGN feedback (e.g., Booth & Schaye 2010). The most robust part of our effort to model galaxy formation is the calculation of DM hiararchical clustering. Conveniently, DM mass is then provided by halo-finder algorithms.
However, we can now be confident that halo DM does not correlate directly with M• independent of whether or not the galaxy contains a bulge (Kormendy & Bender 2011). This result is reviewed in detail and with the largest galaxy sample in KH13. They list eight arguments against Ferrarese's conclusion. Some are based on examining the proxy parameters that she used to make her arguments (σ for M• and Vcirc for the DM; e.g. we now know that σ is not a proxy for BH mass for pseudobulge galaxies: Figure 7 here). Some arguments are based on the direct correlation of measured M• with Vcirc: there is essentially no correlation unless the galaxy has a classical bulge. Perhaps the most telling argument is based on the well determined relationship between the stellar mass M* and the DM mass MDM of galaxies. Behroozi, Wechsler, & Conroy (2013) show that M* / MDM reaches a maximum at MDM ≃ 1012 M⊙ and is smaller at both higher and lower MDM (see also Fig. 9 here). Together with the correlation (Equation 5) between M• and Mbulge ≃ M* (exact for ellipticals and approximate for bulge-dominated galaxies), Behroozi's result implies that the relationship between M• and MDM is complicated,
 |
(6) |
but
 |
(7) |
with a kink in the correlation at MDM ≃ 1012M⊙. Meanwhile, the M•–Mbulge correlation is log linear with small scatter from the lowest to the highest bulge masses in Figure 5. This correlation shows no kink at MDM ∼ 1012 M⊙ corresponding to Mbulge ∼ 3 × 10¹⁰ M⊙ (see Figure 7). The simplicity of M• – Mbulge versus the complexity of M• – MDM is another argument in favor of the conclusion that BHs coevolve with bulges and ellipticals but not directly with DM halos.
6.2. AGN Feedback and the Coevolution (Or Not) of Supermassive Black Holes and Host Galaxies
Implications for the coevolution (or not) of BHs and host galaxies are reviewed by Kormendy & Ho (2013). They distinguish four modes of AGN feedback:
In summary, KH13 provides the largest available database on BH detections via spatially resolved dynamics, putting the many heterogeneous discovery papers on a homogeneous system of (for example) distances and magnitudes, and incorporating many M• corrections from the recent literature. Homogeneous data are also provided for all BH host galaxies, including all disk-galaxy hosts, many of which had not previously been studied. Bulge-pseudobulge classifications are provided based on multiple classification criteria (cf.Section2.1 here), and (pseudo)bulge-disk photometric decompositions are derived for all galaxies that did not previously have photometry. The results (their Tables 2 and 3) are an accurate enough database to allow Kormendy & Ho (2013) to derive a number of new conclusions about BH-host correlations and their implications. Some of these are reviewed above. Others, such as correlations (or not) with nuclear star clusters and globular cluster systems, are omitted here, in part to keep the length of this paper manageable, and in part because the connection with galaxy bulges is less direct than it is for subjects that we cover.
Many of our conclusions disagree with Graham (2015). Within the subjects that I have reviewed in this paper, I have tried to explain why. Readers are encouraged to compare the accuracy of our data sets (particularly M• measurements), our results, and the physical picture in which they are embedded. We believe that the observational conclusions reached in KH13 are robust, and the essential implications for galaxy evolution – the big picture of what happens, if not the engineering details – are well established. Section 7 is an important example.