
| © CAMBRIDGE UNIVERSITY PRESS 1983, 1993
| |


1.6 Structures on the largest scale
A galaxy that is not a member of a group of galaxies is called a field galaxy. Other galaxies are members of groups or clusters that may contain from a handful to hundreds of big galaxies. Our galaxy, for example, is a member of a group of ~ 20 galaxies, known as the Local Group, that are separated by distances of up to ~ 1 Mpc. The nearest members of the group are the Large and Small Magellanic Clouds, which are located ~ 50 kpc from us,
| Name of cluster | Distance from Earth a (Mpc) |
| Virgo | 21 |
| Pisces | 82 |
| Perseus | 100 |
| Coma | 122 |
| Hercules | 190 |
| Gemini | 430 |
| Hydra II | 1110 |
| a Distances corresponding to H0 = 50km s-1 Mpc-1. | |
Table 1.1 lists a few of the larger clusters (see Figure 1.17). The distances quoted in this table are not exact because of the uncertainty surrounding the measurements of extragalactic distances. The extragalactic distance scale is related to the magnitude of Hubble's constant (see section 1.8). Currently there is disagreement among astronomers as to the true value of this constant. The ratios of these numbers should, however, give us reliable estimates of the relative distances of these clusters.

|
Fig. 1.17. The Coma Cluster of galaxies. (Courtesy of Kitt Peak National Observatory.) |
G. Abell has catalogued clusters out to distances of the order of that of Hydra II using strict criteria of what constitutes a cluster. In order to pick out a cluster one has to look for an enhancement of the number density of galaxies within a specified region compared with the overall background density. The order of ``richness'' of a cluster is accordingly fixed by specifying the size, brightness range, and background. F. Zwicky has also catalogued clusters of galaxies, but with less strict criteria than those adopted by Abell.
How much matter is contained in a cluster? We will attempt to answer
this question in section 9.4. For the time being we may say that a
cluster may contain a mass of the order of ~ 1014
M . Further, if we try
to estimate the mean density of matter in the universe by taking account
of how much matter we see in clusters of galaxies then we come up with a
figure lying between 10-31 and 10-30 g
cm-3. However, as we shall see in
Chapters 7 and 9, even clusters may have dark matter in substantial
amounts. Thus these density estimates may have to be enhanced.
. Further, if we try
to estimate the mean density of matter in the universe by taking account
of how much matter we see in clusters of galaxies then we come up with a
figure lying between 10-31 and 10-30 g
cm-3. However, as we shall see in
Chapters 7 and 9, even clusters may have dark matter in substantial
amounts. Thus these density estimates may have to be enhanced.
The mean density of matter in a galaxy, on the other hand, is ~
10-24 g cm-3. Thus the volume occupied by galaxies
is  10-6 of the total volume
of the universe. This also explains why galaxies are considered as
points when cosmological models are constructed.
10-6 of the total volume
of the universe. This also explains why galaxies are considered as
points when cosmological models are constructed.
Apart from optical emission, clusters of galaxies also show radio and X-ray emission. These arise not only from individual sources located in the clusters, but also in a diffuse fashion throughout the clusters.
Does a structure larger than clusters exist in the universe? This can be decided by studying the distribution of galaxies across the sky and looking for nonrandomness (that is, grouping or clumping) on larger and larger scales. Such studies have revealed the existence of larger structures on the scale of ~ 50 Mpc, compared to cluster scales of ~ 5 Mpc. These larger units are referred to as superclusters.
For example, G. de Vaucouleurs has found that our Local Group is a member of a supercluster centred on the Virgo cluster of galaxies. C. D. Shane and co-workers at the Lick Observatory found similar clumpiness in other regions of the sky. Abell also found clumpiness in an analysis of the plates in the National Geographic-Palomar Sky Survey.
In the 1970s and 1980s there were considerable improvements in the techniques of observing discrete extragalactic objects. With distances determined by Hubble's law (section 1.8) it became possible to have three-dimensional perspective of matter distributions in the universe. These are beginning to indicate that discrete objects show a large-scale inhomogeneity of distribution. There are, for example, the following features revealed by such surveys:
Superclusters: As was seen above, these are on the scales of ~ 50 Mpc or more and contain several thousand galaxies. For example, the Local Supercluster containing the Local Group is shaped like a flattened ellipsoid which has a plane of symmetry called the supergalactic plane. It passes through the centre of the Virgo cluster and the centre of our own Galaxy.
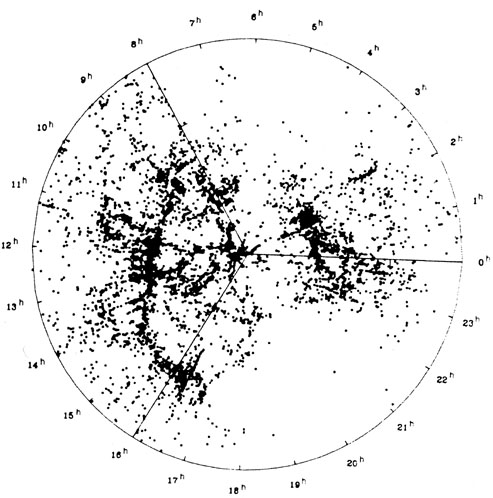
Voids: These are gaps in the distribution of large superclusters, with sizes of the order of 100-200 Mpc. There are apparently no galaxies in these regions (see Figure 1.18)

|
Fig. 1.18. Galaxy distributions show giant voids and long filaments. The above region contains the Perseus and Pegasus superclusters. The circles are galaxies while the closed dashed curves enclose the Abell clusters. (After J.O. Burns, Scientific American, July 1986, p. 40.) |
Filaments: The boundaries of voids are filamentary distributions of galaxies in clusters and superclusters. Figure 1.18 indicates this feature clearly.
The Great Attractor and the Great Wall: In the late 1980s it became apparent that galaxies in and around the Local Group seem to have a large-scale streaming motion towards the Hydra-Centaurus supercluster in the Southern sky. The typical streaming velocity is around 600 km s-1, against the reference frame in which the cosmic microwave background (see section 1.9) is isotropic. This motion is believed to have been caused by a ``great attractor'' mass of some tens of thousands of galaxies. The volume of the attractor is as large as 106 Mpc3. Such massive structures may be present elsewhere in the universe also.
Mapping of the universe on a large scale also indicates the presence of a large but thin sheet of mass. Known as the ``great wall'', it has an extent of 60 x 170 Mpc2 (using a Hubble constant of 100 km s-1 Mpc-1). Figure 1.19 shows its existence. These structural inhomogeneities therefore span distances as large as 10 percent of the characteristic size of the universe as given in section 1.10.
In the 1920s and 1930s the general belief was that the universe is homogeneous on the large scale. The cosmological models which arose in those days make this simple assumption. In Chapters 3 and 4 we will outline these models. But it is now becoming apparent that these models were too simplistic. They face the problem of explaining how such a large-scale structure came into existence.
|
Fig. 1.19. The distribution of galaxies in a thin sheet called the ``great wall''. (Source: M.J. Geller and H.P. Huchra, Science, 246, 897 (1989)). |