
| © CAMBRIDGE UNIVERSITY PRESS 1997
| |


1.3 The Local Abundance Distribution

|
Fig. 1.4. The ``local galactic'' abundance distribution of nuclear physics, normalised to 106 28Si atoms, adapted from Cameron (1982). |
Fig. 1.4 shows the ``local galactic'' abundances of isobars, based on a combination of elemental and isotopic determinations in the Solar System with data from nearby stars and emission nebulae. These are sometimes referred to as ``cosmic abundances'', but because there are significant variations among stars and between and across galaxies this term is best avoided. The curve shows a number of features that give clues to the origin of the various elements:
| (1) | Hydrogen is by far the most abundant element,
followed fairly closely by helium.
This is mainly formed in the Big Bang, with some topping up of
the primordial
helium abundance (Yp |
| (2) | The fragile nuclei Li, Be and B are very scarce, being
destroyed in the harsh
environment of stellar interiors although some of them may also
be created there. (The lithium abundance comes from measurements in
meteorites; it is still lower in the solar photosphere because of
destruction by mixing with hotter
layers below.) On the other hand, they are much more abundant in primary
cosmic rays as a result of |
| (3) | Although still more fragile than Li, Be and B, deuterium is vastly more abundant (comparable to Si and 5). D is virtually completely destroyed in gas recycled through stars and there are no plausible mechanisms for creating it there in such quantities, but it is nicely accounted for by the Big Bang. The observed abundance is a lower limit to the primordial abundance. The light helium isotope 3He is the main product when deuterium is destroyed and can also be freshly produced in stars. It has comparable abundance to D and some is made in the Big Bang, but in this case the interpretation of the observed abundance is more complicated. |
| (4) | Nuclei from carbon to calcium show a fairly regular downward progression modulated by odd:even and shell effects in nuclei which affect their binding energy (see Chapter 2). These arise from successive stages in stellar evolution when the exhaustion of one fuel is followed by gravitational contraction and heating enabling the previous ashes to ``burn''. The onset of carbon burning, which leads to Mg and nearby elements, is accompanied by a drastic acceleration of stellar evolution due to neutrino emission. This occurs because at the high densities and temperatures required for such burning, much of the energy released comes out in the form of neutrinos which directly escape from the interior of the star, relative to photons for which it takes of the order of 106 yrs for their energy to reach the surface. It is this rapid loss of energy that speeds up the stellar evolution (cf. Chapter 5). |
| (5) | The iron-group elements show an approximation to nuclear statistical equilibrium at a temperature of several x 109 K or several tenths of an MeV leading to the iron peak, This was referred to by B2FH as the ``e-process'' referring to thermodynamic equilibrium. Because the neutrinos escape, complete thermodynamic equilibrium does not apply here, but one has an approach to statistical equilibrium in which forward and reverse nuclear reactions balance. The iron peak is thought to result from explosive nucleosynthesis which may occur in one or other of two typical situations. One of these involves the shock that emerges from the core of a massive star that has collapsed into a neutron star; heat from the shock ignites the overlying silicon and oxygen layers in a Type II (or related) supernova outburst. Another possible cause is the sudden ignition of carbon in a white dwarf that has accreted enough material from a companion to bring it over the Chandrasekhar mass limit (supernova Type Ia). In either case, the quasi-equilibrium is frozen at a distribution characteristic of the highest temperature reached in the shock before the material is cooled by expansion, but the initial neutron-proton ratio is another important parameter. Calculations and observations both indicate that the dominant product is actually 56Ni, the ``doubly magic'' most stable nucleus with equal numbers of protons and neutrons, which later decays into 56Fe. |
| (6) | Once iron-group elements have been produced, all nuclear
binding energy has been extracted and further gravitational contraction
merely leads to photodisintegration of nuclei with a catastrophic
consumption of energy. This is one of
several mechanisms that either drive or accelerate core collapse. By contrast,
the SN Ia explosion of a white dwarf simply leads to disintegration of the
entire star. Consequently charged-particle reactions do not lead
to significant
nucleosynthesis beyond the iron group and the majority of heavier
nuclei result from neutron captures. One or more such captures on a seed
nucleus (in practice mostly 56Fe) lead to the production of a
|
Neutron capture processes give rise to the so-called magic-number peaks in the abundance curve, corresponding to closed shells with 50, 82 or 126 neutrons (see Chapter 2). In the case of the s-process, the closed shells lead to low neutron-capture cross-sections and hence to abundance peaks in the neighbourhood of Sr, Ba and Pb (cf. Fig. 1.4), since such nuclei will predominate after exposure to a chain of neutron captures. In the r-process, radioactive progenitors with closed shells are more stable and hence more abundant than their neighbours and their subsequent decay leads to the peaks around Ge, Xe and Pt on the low-A side of the corresponding s-process peak.
|
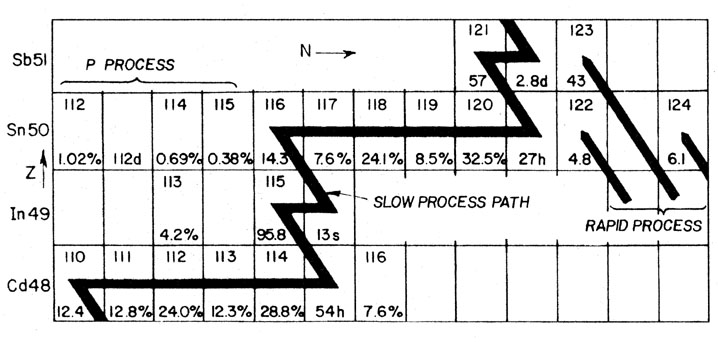
Fig. 1.5. Paths of the r-, s- and
p-processes in the neighbourhood of the tin isotopes. Numbers
in the boxes give mass numbers and percentage abundance of the
isotope for stable species, and
|
 0.24) by subsequent H-burning in stars (Y
  -
-
 -unstable nucleus
(e.g. 59Fe) and the
eventual outcome then depends on the relative time-scales for
neutron addition and
-unstable nucleus
(e.g. 59Fe) and the
eventual outcome then depends on the relative time-scales for
neutron addition and  ) captures are
balanced by (
) captures are
balanced by (