


2.1 The Cosmological Principle
Pietronero [13] argues that the evidence from redshift catalogs and deep galaxy counts is that the galaxy distribution is best described as a scale-invariant fractal with dimension D ~ 2. Others disagree ([14], [15]). I am heavily influenced by another line of argument: it is difficult to reconcile a fractal universe with the isotropy observed in deep surveys (examples of which are illustrated in Figs. 3.7 to 3.11 in [11] and are discussed in connection with the fractal universe in pp. 209 - 224 in [11]).
|
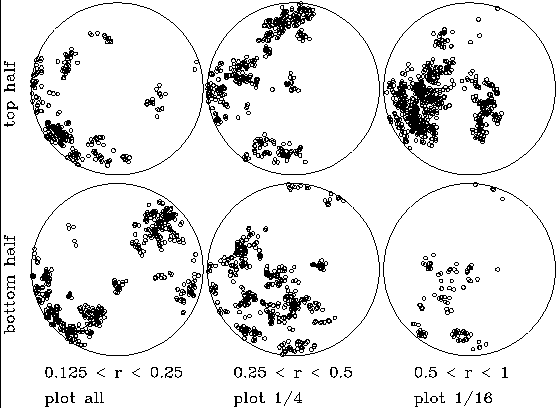
Figure 1. Angular distributions of particles in a realization of a fractal with dimension D = 2 viewed from one of the particles in the realization. The fraction of particles plotted in each distance bin has been scaled so the expected number of particles plotted is the same in each bin. |
Fig. 1 shows angular positions of particles in
three ranges of
distance from a particle in a fractal realization with dimension
D = 2 in
three dimensions. At D = 2 the expected number of neighbors
scales with distance R as N (< R)
 R2, and
I have scaled the fraction of particles plotted as R-2 to
get about the same number in each plot.
The fractal is constructed by placing a stick of length
L, placing on either end the centers of sticks of length
L /
R2, and
I have scaled the fraction of particles plotted as R-2 to
get about the same number in each plot.
The fractal is constructed by placing a stick of length
L, placing on either end the centers of sticks of length
L /  , where = 21/D, with
random orientation, and iterating to smaller and larger scales. The
particles are placed on the ends of the
shortest sticks in the clustering hierarchy. This construction
with D = 1.23 (and some adjustments to fit the galaxy three- and
four-point correlation functions) gives a good description of the
small-scale galaxy clustering
[16]. The fractal in
Fig. 1, with D = 2, the dimension
Pietronero proposes, does not look at all like deep sky maps of
galaxy distributions, which show an approach to isotropy with
increasing depth. This cannot happen in a scale-invariant
fractal: it has no characteristic length.
, where = 21/D, with
random orientation, and iterating to smaller and larger scales. The
particles are placed on the ends of the
shortest sticks in the clustering hierarchy. This construction
with D = 1.23 (and some adjustments to fit the galaxy three- and
four-point correlation functions) gives a good description of the
small-scale galaxy clustering
[16]. The fractal in
Fig. 1, with D = 2, the dimension
Pietronero proposes, does not look at all like deep sky maps of
galaxy distributions, which show an approach to isotropy with
increasing depth. This cannot happen in a scale-invariant
fractal: it has no characteristic length.
A characteristic clustering length for galaxies may be expressed in terms of the dimensionless two-point correlation function defined by the joint probability of finding galaxies centered in the volume elements dV1 and dV2 at separation r,
The galaxy two-point function is quite close to a power law,
where the clustering length is
and the Hubble parameter is
The rms fluctuation in galaxy counts in a randomly placed sphere
is
The isotropy observed in deep sky maps is consistent with a
universe that is inhomogeneous
but spherically symmetric about our position. There are
tests, as discussed by Paczynski and Piran
[17]. For
example, we have a successful theory for the
origin of the light elements as remnants of the expansion and
cooling of the universe through kT ~ 1 MeV
[18].
If there were a strong radial matter density gradient out to the
Hubble length we could be using the wrong local entropy per
baryon, based on conditions at the Hubble length where
the CBR came from, yet the theory seems to be successful. But to
most people the compelling argument is that distant galaxies look
like equally good homes for observers like us: it would be
startling if we lived in one of the very few close to the center of symmetry.
Mandelbrot [19]
points out that other fractal
constructions could do better than the one in
Fig. 1. His example
does have more particles in the voids defined by the strongest
concentrations in the sky, but it seems to me to share the
distinctly clumpy character of
Fig. 1. It would be interesting to
see a statistical test. A common one expands the angular
distribution in a given range of distances in spherical harmonics,
where
where
In the approximation of the sum as an integral el is
the contribution to the variance of the angular distribution per
logarithmic interval of
l. It will be recalled that the zeros of the real and
imaginary parts of Ylm are at separation
I can think of two ways to define the dimension of a fractal that
produces a close to isotropic sky. First, each octant of a full
sky sample has half the diameter of the full sample, so
one might define D by the fractional departure of
the mean density within each octant from the mean in the full
sample,
Thus in Fig. 1, with D = 2, the
quadrupole anisotropy e2 is on
the order of unity. Second, one can see the idea that the mean
particle density varies with distance r from a particle as
r-(3-D). Then the small angle (large l) Limber
approximation to the angular correlation function w (
To find el differentiate with respect to l.
At D = 2 this gives el ~ 1: the surface density
fluctuations
are independent of scale. At 0 < 3 - D << 1, el
~ (3 - D) / l.
The X-ray background fluctuates by about
The universe is not exactly homogeneous, but it seems to be
remarkably close to it on the scale of the Hubble length.
It would be interesting to know whether there is a fractal
construction that allows a significantly larger
value of 3 - D for given el than in this calculation.

 N/N = 1 at sphere
radius r = 1.4r0 ~ 6h-1 Mpc, to
be compared to the Hubble distance (at which the recession
velocity approaches the velocity of light),
cH0-1 = 3000h-1 Mpc.
N/N = 1 at sphere
radius r = 1.4r0 ~ 6h-1 Mpc, to
be compared to the Hubble distance (at which the recession
velocity approaches the velocity of light),
cH0-1 = 3000h-1 Mpc.
 is the surface mass
density as a function of
direction
is the surface mass
density as a function of
direction  in the sky. The
integral becomes
a sum if the fractal is represented as a set of particles.
A measure of the angular fluctuations is
in the sky. The
integral becomes
a sum if the fractal is represented as a set of particles.
A measure of the angular fluctuations is
 =
=  / l in
the shorter direction, except where the zeros crowd together near
the poles and Ylm is close to zero. Thus
el is the
variance of the fractional fluctuation in density across the sky
on the angular scale ~ / l and in the chosen range of
distances from the observer.
/ l in
the shorter direction, except where the zeros crowd together near
the poles and Ylm is close to zero. Thus
el is the
variance of the fractional fluctuation in density across the sky
on the angular scale ~ / l and in the chosen range of
distances from the observer.
 ) is
[20]
) is
[20]
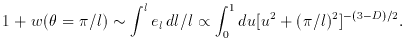 (9)
f / f ~ 0.05 at
= 5°, or l ~
30. This is equivalent to
D ~ 3 - l (f
/ f)2 ~ 2.9 in the fractal model in Eq. (9).
(9)
f / f ~ 0.05 at
= 5°, or l ~
30. This is equivalent to
D ~ 3 - l (f
/ f)2 ~ 2.9 in the fractal model in Eq. (9).