This was the advertised title of the Workshop, and with appropriate rewording, became the first topic for the debate:
Q1: Most of the > 1012
L ULIGs are
predominantly powered by AGN ? or Starburst ? ULIGs are
predominantly powered by AGN ? or Starburst ?
|
We define the words ``most'' and ``predominantly'' in the way that they have been used throughout this workshop, i.e. to mean ``> 50 %''.
From the beginning it seemed clear that the AGN camp could relatively easily
reach a consensus on dominant AGNs for those ULIGs with ``warm'' mid-infrared
colors, nearly all of which have Seyfert-like optical and/or near-infrared
spectra, and for the most luminous ULIGs, i.e. the hyperluminous objects with
Lir > 1013
L, where
all of the currently
identified objects indeed have ``warm'' colors and typically Seyfert 2
emission lines in direct optical emission (e.g. IRAS F09105+4108:
Kleinmann & Keel 1987;
IRAS F15307+3252:
Cutri et al. 1994;
IRAS F10214+4724:
Rowan-Robinson et
al. 1991),
but have been shown to contain hidden broad line
regions in polarized optical light (e.g.
Hines et al. 1995),
or in direct near-infrared emission (e.g.
Veilleux, Sanders,
& Kim 1997,
1999).
There was little or no agreement on the dominant energy source for the cooler ULIGs which make up the bulk of the ULIG population by number. As more complete multiwavelength data sets were assembled for individual objects, what was intriguing was the fact that for a significant fraction of the cool ULIGs, different wavelength data often gave contradictory results; for example relatively strong X-ray emission, or the clear presence of an AGN-like radio core, while mid-infrared and optical line diagnostics favored starbursts. What was also apparent was that previous statements about AGN-like properties of ULIGs often used as a benchmark objects which were radio-loud (e.g. 3C sources such as 3C 273) when referring to the mean radio and/or X-ray properties of AGN, despite the fact that the great majority of QSOs are radio-quiet and relatively X-ray week.
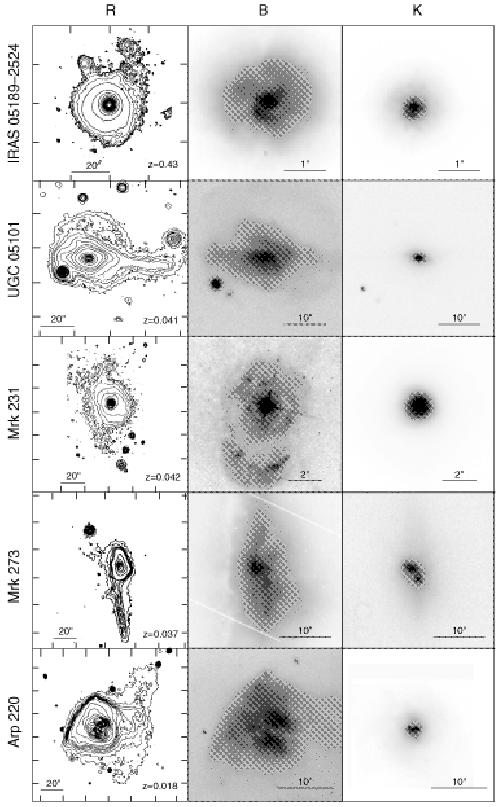
It was decided that the best way to attack Topic 1 was an in depth study of the five nearest ULIGs, objects for which a substantial body of high resolution, multiwavelength data already exists, and then to compare the properties of these objects with the mean properties of radio-quiet QSOs (RQQSOs). Figure 1 presents images of the 5 nearest ULIGs and Table 1 summarizes the large scale properties of each.
|
Figure 1. The five nearest ULIGs from the original IRAS BGS (Soifer et al. 1987). The large scale R-band images were obtained with the Palomar 5 m telescope (Sanders et al. 1988a, b, c). Tick marks represent intervals of 20". The logarithmic stretch is designed to reveal both faint large scale features and bright nuclei. The optical (B-band) HST images are from Surace et al. (1998). The K-band images are from Surace et al. (1998) and Scoville et al. (1999). The plate scale for the B and K images is indicated in the lower right corner of each panel. The greyscale for the B and K images has been adjusted to show only the brightest features. For each object (row) all three wavelength panels (R,B,K) are centered at the same (R.A., Dec). |