Copyright © 1988 by Annual Reviews. All rights reserved
| Annu. Rev. Astron. Astrophys. 1988. 26:
631-86 Copyright © 1988 by Annual Reviews. All rights reserved |


In this section I consider the superclustering of clusters and discuss the identification and properties of individual superclusters. This approach complements the statistical studies of correlation functions, providing specific information about type, shape, structure, and content of superclusters. For a recent review paper on superclusters, see Oort (1983). A review of voids is presented in this volume by Rood (1988).
In order to investigate the properties of the large-scale clustering
of clusters, a complete, well-defined catalog of superclusters -
defined as clusters of clusters of galaxies - is required. Early lists
of superclusters (e.g.
Abell 1961,
Rood 1976,
Murray et al 1978)
used the projected distribution of rich Abell clusters plus estimated
cluster redshifts (from Abell's magnitudes of the tenth brightest
cluster galaxy), since very few redshift data were available. (The
latter were used by
Rood 1976.)
Later on,
Thuan (1980)
used measured
redshifts of the 77 nearest Abell clusters, with a single selection
parameter; no comparisons with random catalogs were available. More
recently,
Bahcall & Soneira
(1984)
(hereinafter BS84) constructed a supercluster catalog to
z  0.08 using the
complete redshift sample of
104 nearby Abell clusters (D
4,
z
0.08 using the
complete redshift sample of
104 nearby Abell clusters (D
4,
z  0.1)
described in Section 2 and
an objective selection criterion of a spatial density enhancement. I
describe below the main properties of these catalogs.
0.1)
described in Section 2 and
an objective selection criterion of a spatial density enhancement. I
describe below the main properties of these catalogs.
In the BS84 catalog, all volumes of space with a spatial density of clusters f times larger than the mean cluster density are identified as superclusters for a specified value of f. The superclusters densities are therefore given by

| (18) |
where
n(sc) is the spatial density of clusters in the supercluster,
and n0 is the mean cluster density in the sample. The
supercluster selection process was repeated for various overdensity
values f, from
f = 10 to f = 400, yielding specific supercluster catalogs
for each f
value. The higher over-density values identify the dense cores of
superclusters; lower f values represent superclusters with lower
densities and include the outskirts of high-density superclusters. The
supercluster boundaries clearly do not set strict physical limits on
the superclusters but rather define volumes of various levels of
overdensities. The procedure was carried out for the redshift sample
of 104 clusters of richness R
 1, as well as for the larger
redshift sample of 175 R
0 clusters.
1, as well as for the larger
redshift sample of 175 R
0 clusters.
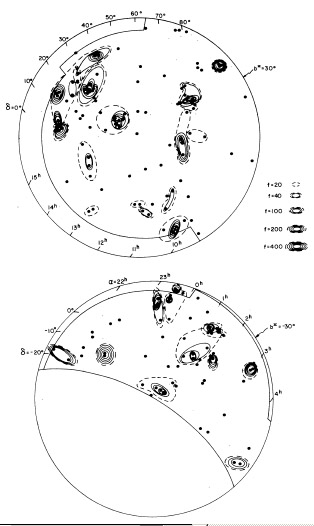
A map of the supercluster catalog for the R
0 sample is presented
in Figure 15. Additional supercluster maps
(e.g. the R 1 sample), as
well as a listing of the supercluster catalog itself and its member
clusters for each of several f values, are given in BS84. A total of
16 superclusters are cataloged for R
1 and f = 20, and 26
superclusters for R 0
and f = 20.
|
Figure 15. Projected area map of the
northern (top) and southern
(bottom) clusters and superclusters in the D
|
Some global properties of the Bahcall-Soneira superclusters are
summarized in Table 2. The number of clusters per
supercluster varies from 2 to 15 for the f = 20 superclusters
and reduces to a value of 2
to 3 clusters per f = 400 supercluster. The average number of
clusters
per supercluster is approximately three. The superclusters contain a
large fraction of all clusters; this fraction,
Fcl(sc),
is 54% at f = 20 and reduces to 16% at f =
400. Comparisons with random catalogs
show that these fractions are considerably higher than those expected
by chance (Figure 16). This indicates that most
of the high
overdensity superclusters are real physical systems of the largest
scale yet observed. The linear size of the largest observed
superclusters are
 100h-1 Mpc (at f = 20; e.g. the Corona
Borealis supercluster at
~ 15h + 30°). Elongated structures are suggested in
these cases. The fractional volume of space occupied by the
superclusters is, however, very small; it is ~ 3% at f = 20 and
decreases rapidly with increasing f.
100h-1 Mpc (at f = 20; e.g. the Corona
Borealis supercluster at
~ 15h + 30°). Elongated structures are suggested in
these cases. The fractional volume of space occupied by the
superclusters is, however, very small; it is ~ 3% at f = 20 and
decreases rapidly with increasing f.
| f | ||||
| Property | 20 | 40 | 100 | 400 |
| Nsc | 16 | 12 | 11 | 7 |
| ncl/sc | 2-15 | 2-7 | 2-7 | 2-3 |
 Rmax (Mpc)
| 145 | 36 | 36 | 13 |
| <
rx> (Mpc)
| 27.1 | 7.6 | 7.6 | 4.5 |
| <
Rz> (Mpc)
| 28.6 | 14.5 | 13.5 | 4.5 |
| Fcl(sc) | 0.54 | 0.34 | 0.30 | 0.16 |
| Vsc/V | 0.03 | 0.008 | 0.003 | 0.0004 |
a The quantities listed are
for the R
| ||||

|
Figure 16. The Fraction of all R
|
Thuan (1980) constructed a supercluster catalog from the nearest 77 Abell clusters by finding all cluster neighbors within a given separation of 65h-1 Mpc. While the selection criteria differ somewhat from those of BS84, there is general consistency between the catalogs.
Rood (1976) determined the superclustering of the nearest 27 Abell clusters using the clusters' measured redshifts and the criterion of having at least one cluster neighbor within 25h-1 Mpc. In the region of overlap, a general consistency exists among the Rood. Thuan, and Bahcall & Soneira catalogs. Kalinkov et al. (1984) determined the superclustering of the nearby Abell clusters using measured as well as estimated redshifts. Batuski & Burns (1985b) used measured as well as estimated redshifts (from Abell's m10 magnitude) for all Abell clusters in order to identify a large list of candidate superclusters. Further redshift measurements are required before the reality of these suggested superclusters can be determined
6.2. The Multiplicity Function of Superclusters
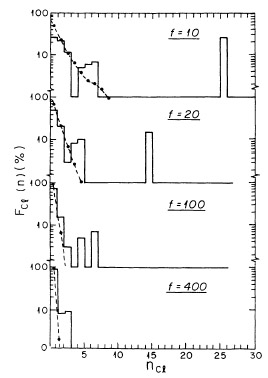
Approximately one half of all rich clusters are observed to be members of superclusters (Section 6.1). The frequency distribution of clusters among superclusters of different richnesses, ncl/sc (where ncl/sc is the number of clusters in a supercluster), is the multiplicity function of the clusters, Fcl(ncl/sc). This multiplicity function was determined by BS84 for their complete sample of superclusters (Section 6.1) and compared with the multiplicity function expected from random samples.
The multiplicity function is presented in
Figure 17, showing the
fraction of clusters that are members of superclusters of any given
richness. The frequency distributions are plotted for different values
of density enhancement selection value f, from f = 10 to
400, for both
the data and the average of 100 random cluster catalogs. Figure 17
shows that the observed and random catalogs yield different
distributions. The fraction
Fcl for the random catalog falls off
smoothly and steeply with increasing richness (for f
10); thus, the
random catalogs have essentially no power at large richness. The
observed superclusters have systems with more members than seen in the
random catalogs for all f
10. The observed high-richness
superclusters (high
ncl/sc) appear to grow rapidly (in
richness and size) as f decreases. As these richest, largest
scale structures grow,
a gap of medium-richness superclusters appears to be rapidly forming
(Figure 17). Neither the gap nor the related
largest scale structure exists in the random catalogs.
|
Figure 17. The frequency distribution of
R |
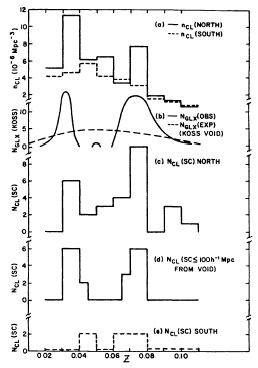
6.3. Superclusters Surrounding Galaxy Voids
The BS84 supercluster catalog was used by
Bahcall & Soneira
(1982a)
to study the area around the large (~ 60h-1 Mpc
diameter) void of galaxies in Bootes that was detected by
Kirshner et al. (1981).
The largest,
densest superclusters are located near and around the area devoid of
galaxies. The Bootes void, at approximately
14.5h + 50°, is located
near superclusters BS 12 and BS 15+16 (~ 100h-1 Mpc
away in projection;
see Figure 15 and BS84). In addition, the
overdensity of galaxies observed by
Kirshner et al. (1981)
on both redshift sides of the void, at
z  0.03 and
z 0.08
(Figure 18), coincides in
redshift space with
these nearby dense superclusters: BS 15 + 16 (Hercules supercluster) at
z 0.03, and BS 12
(Corona Borealis supercluster) at
z 0.08
(Figure 18). This suggests that the large
superclusters surround the
galaxy void, and that the tails of their galaxy distributions account
for the neighboring overdensities observed
100h-1 Mpc away by
Kirshner et al. This connection provides another indication of long
tails to rich superclusters.
0.03 and
z 0.08
(Figure 18), coincides in
redshift space with
these nearby dense superclusters: BS 15 + 16 (Hercules supercluster) at
z 0.03, and BS 12
(Corona Borealis supercluster) at
z 0.08
(Figure 18). This suggests that the large
superclusters surround the
galaxy void, and that the tails of their galaxy distributions account
for the neighboring overdensities observed
100h-1 Mpc away by
Kirshner et al. This connection provides another indication of long
tails to rich superclusters.
Previous observational evidence (Gregory & Thompson 1978, Gregory et al. 1981, Chincarini et al. 1981), together with these results as well as more recent redshift surveys (Giovanelli et al. 1986, de Lapparant et al. 1986, da Costa et al. 1988), suggests that galaxy voids may generally be associated with surrounding galaxy excesses: the bigger the void, the stronger may be the related excess.
|
Figure 18. The frequency distribution of
Abell clusters, Ncl, and galaxies in the Bootes direction
(Kirshner et al. 1981),
Nglx as a
function of redshift. The Bootes void at
z |
A huge void of cataloged nearby rich clusters of galaxies was
suggested by
Bahcall & Soneira
(1982b)
in the complete D 4 Abell
sample discussed above. The void, located at
l ~ 180°, b ~ 30 - 50°, is
in the approximate redshift range of
z 0.03 - 0.08, and it
extends ~ 100° across the sky (i.e.
~ 300h-1 Mpc). Its projected area is
completely devoid of nearby - but not distant - rich clusters (R
1). The void does not appear to
be caused by absorption in the
Galaxy. If this apparent void in nearby rich clusters is real, it
subtends a volume of more than
106h-3 Mpc3. Simulations with
100 random catalogs indicate that the probability of finding such a
large void by chance is
10-2
[Bahcall & Soneira
1982b;
see, however,
Politzer & Preskill
(1986),
who estimate a higher random probability].
Recent work by
Lipovetsky (1987),
who studied the space distribution
of Markarian galaxies from the First Byurakan Survey (using a UV
excess technique), indicates a large void in the galaxy distribution
in exactly the same rich-cluster void region as was suggested by
Bahcall & Soneira
(1982b).
The cluster catalog of
Shectman (1985),
which lists poorer clusters than Abell's
(Section 2), also has a
significant underdensity of poor clusters in this region. Shectman
finds 14 poor clusters in this area compared with an expected number
of 32 (based on the density of clusters in the same Galactic latitude
bin but different longitude). Other large voids in the distribution
of rich clusters were suggested by
Batuski & Burns
(1985b),
but no comparisons with random distributions were made. More recently,
Huchra (1988)
suggested the existence of similar huge voids of clusters using
redshift observations of a deep (z
0.2)
subsample of Abell clusters.
Proving that a void exists in a sparse distribution of rich clusters is obviously difficult and can be achieved only for very large regions devoid of clusters. On the other hand, if clusters are observed to be overdense on supercluster scales (~ 100h-1 Mpc), it is reasonable to expect that similar underdense regions exist also.
 error bars are shown for the
random points. The curves are power-law fits for f >> 1
(Section 6).
error bars are shown for the
random points. The curves are power-law fits for f >> 1
(Section 6).