Copyright © 1988 by Annual Reviews. All rights reserved
| Annu. Rev. Astron. Astrophys. 1988. 26:
631-86 Copyright © 1988 by Annual Reviews. All rights reserved |


5.1. Long Tails to Galaxy Clusters
The galaxy correlations depend, at least partially, on the rich cluster correlations, since clusters contain galaxies. If all galaxies were members of rich clusters, the two correlation functions should be approximately the same on large scales. The fraction of galaxies in clusters is clearly less than unity. The fraction of galaxies, f, that are associated with rich clusters represents the probability that a randomly chosen galaxy is correlated with a rich cluster. These associations may include large structures (tens of megaparsecs), comparable to the separations observed in the cluster correlation function (and well above the standard Abell radius of 1.5h-1 Mpc).
The galaxy correlation function contains contributions from three terms (Bahcall 1986): galaxy pairs from the fraction f of galaxies that are cluster members, pairs from the fraction 1 - f of galaxies that are noncluster members ("field"), and cross-term pairs. Inserting the analytic expressions for each of these terms into the expression for the overall galaxy correlation function yields
| (17) |
The above ratio of the cluster to galaxy correlation strength
depends on two parameters: the fraction of galaxies in clusters, f,
and the ratio of the "field" galaxy correlation strength,
 ggf (i.e. the
correlation of the 1 - f fraction of galaxies outside the rich
clusters) to the overall galaxy correlation
gg. If
all galaxies were associated
with rich clusters, i.e. f = 1, then the galaxy and cluster
correlations are identical on large scales, as expected. However, for
any fraction f < 1, the galaxy correlations will be smaller
than the
parent cluster correlations due to the reducing effect of the less
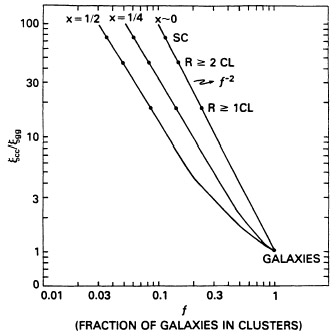
clustered "field" galaxies. Figure 13
represents graphically Equation 17. The curves are the expected
cc /
gg(f )
relations for selected values of the parameter
x
ggf (i.e. the
correlation of the 1 - f fraction of galaxies outside the rich
clusters) to the overall galaxy correlation
gg. If
all galaxies were associated
with rich clusters, i.e. f = 1, then the galaxy and cluster
correlations are identical on large scales, as expected. However, for
any fraction f < 1, the galaxy correlations will be smaller
than the
parent cluster correlations due to the reducing effect of the less
clustered "field" galaxies. Figure 13
represents graphically Equation 17. The curves are the expected
cc /
gg(f )
relations for selected values of the parameter
x  ggf /
gg. The
observed correlation strengths are
represented by the data points. The observed ratio
cc /
gg
ggf /
gg. The
observed correlation strengths are
represented by the data points. The observed ratio
cc /
gg
 18 for R
 1 clusters yields a fraction of
galaxies in clusters that ranges from
f 25% for
x 0 to f
15% for
x 1/4. Therefore, if
approximately
20% of all galaxies are associated with rich (R
1) clusters, the
galaxy correlation function will be, as observed, ~ 18 times weaker
than the cluster correlations.
1 clusters yields a fraction of
galaxies in clusters that ranges from
f 25% for
x 0 to f
15% for
x 1/4. Therefore, if
approximately
20% of all galaxies are associated with rich (R
1) clusters, the
galaxy correlation function will be, as observed, ~ 18 times weaker
than the cluster correlations.
|
Figure 13. The ratio of the cluster to
galaxy correlation functions predicted from
Bahcall's (1986)
model (Equation 17) is plotted as a
function of the fraction f of galaxies associated with the
clusters. The different curves represent different values of the
"field" (noncluster) correlation strength,
|
The model suggests (Bahcall 1986) that the fraction of galaxies associated with rich clusters is considerably larger than previously believed; most of these galaxies would be distributed in the outer tails of the clusters, which may extend to at least ~ 30h-1 Mpc. Most clusters are therefore predicted to be embedded within much larger structures. Possible physical models that can create such extended structures, with clusters forming in preferentially high-density regions and galaxies forming at lower density regions, are briefly discussed in Section 9.
The model makes testable predictions that can be studied with complete redshift surveys. Recent redshift surveys of galaxies (Section 7) indeed suggest that clusters are generally embedded in large elongated structures that contain a considerable fraction of galaxies. This picture is qualitatively consistent with the phenomenological model described above.
The long-tail model may also explain the negligible correlations
observed among L clouds in
quasi-stellar object (QSO) spectra
(Sargent et al. 1980).
If the clouds can only exist in the field
(noncluster environment) because clusters have too large an ambient
pressure, then they would not be expected to have significant
correlations.
clouds in
quasi-stellar object (QSO) spectra
(Sargent et al. 1980).
If the clouds can only exist in the field
(noncluster environment) because clusters have too large an ambient
pressure, then they would not be expected to have significant
correlations.
Galaxies may be distributed on surfaces of shells (or cells), with rich clusters located at shell intersections. This picture is suggested by redshift surveys of galaxies (Gregory et al. 1981, Giovanelli et al. 1986, de Lapparent et al. 1986). In order to test this "shell" model and its agreement with the observed galaxy and cluster correlations, Bahcall et al. (1988a) made simulations in which they placed galaxies on surfaces of randomly distributed shells and formed clusters at the shell intersections (see also Bahcall 1988a). They found that the model cluster correlations are consistent with the observed cluster correlations, including the large increase in correlation strength from galaxies to clusters. The results are not very sensitive to the exact parameters used. The model galaxy correlations appear to be consistent with observations on small scales, but they exhibit a tail of weak positive correlations at larger separations that are not seen in the data.
An example of results from a typical model is shown in Figure 14; more details are given in Bahcall et al. (1988a). The results suggest that the observed cluster correlations may be simply due to the geometry of clusters positioned on randomly placed shells or similar structures; the typical structure size is best fit with a radius of approximately 20h-1 Mpc. Similar simulations based on the explosion model for the formation of shells were recently performed by Weinberg et al. (1988). They too find a strong increase in correlation strength from the galaxy to the cluster correlation function.

|
Figure 14. Shell-model correlation functions
(Bahcall et al. 1988a)
for clusters (dots) and galaxies (crosses), and their comparisons with
observations
( |