The contribution from foreground sources to the flux of the night sky is at least two orders of magnitude brighter than the expected extragalactic signal. That is, the combined flux from foreground sources is roughly 100×10-9 ergs s-1 cm-2 sr-1 Å-1 (or 23.2 AB mag arcsec-2) (see Figure 1). A detection of the EBL therefore requires the measurement of both the total background and the individual foreground sources with an accuracy of roughly 1% of the total sky surface brightness, or ~ 1 × 10⁻⁹ ergs s-1 cm-2 sr-1 Å-1 at 5500Å (28.2 AB mag arcsec-2). Each of the foreground sources, and our approach to minimizing and measuring them, are described briefly in the following sections.
2.1. Terrestrial Airglow and Extinction
Atmospheric emission is the brightest component of the night sky as seen from the Earth's surface. The mean flux and line strengths of the molecular, atomic, and continuum emission which produce "airglow" can vary by several percent on time-scales of minutes due to changes in atmospheric column densities throughout the night, stimulation by small meteorites, and photo-chemical excitation and de-excitation within several hours of twilight (see Chamberlain 1966 for background, Dube et al. 1979, and Paper II). The mean airglow flux can be predicted based on the line-of-sight path-length through the atmosphere, but the accuracy of this method is limited to a few percent. Airglow subtraction has dominated the errors in several previous attempts to measure the EBL (see Dube et al. 1979 and the discussion in Mattila 1990). However, the only significant airglow emission seen in the upper atmosphere from HST occurs at wavelengths shorter than 2000Å and only on the daytime side of the orbit (see Lyons et al. 1993 and reference therein). We have therefore entirely avoided optical airglow by using HST as the primary instrument in measuring the EBL.
Zodiacal light is sunlight scattered off of dust grains in the solar system, and it can be as bright as 1500 × 10-9ergs s-1 cm-2 sr-1 Å-1 in the ecliptic plane. The ZL is faintest at viewing angles (heliocentric longitude) 130-170 degrees away from the Sun, where scattering angles are large, and at ecliptic latitudes greater than 30 degrees, where the interplanetary dust (IPD) column densities are lowest. To within 10%, the mean flux of the ZL is predictable as a function of scattering geometry and ecliptic latitude; however, this is not accurate enough for our purposes. Instead, we have measured the ZL flux directly using detailed a priori knowledge of its intrinsic spectrum. Observations of the ZL (Leinert et al. 1981, Murthy et al. 1990, Matsuura et al. 1995) show that it has a nearly solar spectrum from the UV to the near-IR (1500Å-10 µm): scattering strength is only weakly dependent on wavelength, so that the absorption lines and narrow-band features of the Sun are very accurately reproduced in the ZL. The broad-band color of the ZL is usually described as the ratio of the zodiacal to the solar spectrum as a function of wavelength,
| (1) |
in which the reference wavelength,
 0, is
typically around 5500Å. Observations of the ZL to date find
C(,
0)
changing by only 5% per 1000Å at the ecliptic orientation and
scattering angles of interest to us.
0, is
typically around 5500Å. Observations of the ZL to date find
C(,
0)
changing by only 5% per 1000Å at the ecliptic orientation and
scattering angles of interest to us.
The solar-type spectrum of the ZL is readily explained by Mie scattering theory, which describes the scattering of light off solid particles larger than the wavelength of the incident light. It predicts the mild wavelength dependence for scattering by particles with the composition and size distribution of the interplanetary dust (IPD) cloud (see Röser & Staude 1978, Berriman et al. 1994, and Leinert et al. 1998 for a recent summary). Because the equivalent widths of the solar Fraunhofer lines are known with high accuracy, we can uniquely determine the continuum level (mean flux) of the ZL at a given wavelength using the apparent equivalent width of the Fraunhofer lines in the ZL spectrum. However, high signal-to-noise spectra at ~ 1Å resolution are required to measure Fraunhofer lines in the spectrum of the ZL. At the time of these observations, such data could only be obtained from the ground. We therefore measured the absolute flux of the ZL using spectrophotometry between 3900-5100Å obtained at Las Campanas observatory simultaneously with the November 1995 HST observations. To identify the ZL flux over the full wavelength range of the HST observations, we combine these observations with an estimate of the ZL color obtained from the HST and LCO data together, as described in Section 9. The measurement of the ZL is presented in full in Paper II. In Section 11, we discuss the use of those results in the EBL detection we present here.
2.3. Discrete Stars and Diffuse Galactic Light (DGL)
The Galactic contribution to the diffuse night sky comes from discrete
stars, starlight scattered off interstellar dust, and line emission
from the warm interstellar medium. Light from resolved stars near the
optical axis of the telescope can also scatter into the field of view.
In some previous attempts to measure the optical EBL, even light from
discrete, resolved stars was difficult to subtract due to poor
detector resolution (e.g.
Dube et al. 1979,
Toller et al. 1983).
In HST/WFPC2 images, however, Galactic stars in the field can be easily
identified and subtracted, with negligible residual contribution to
the errors in our final results.
Guhathakurta & Tyson
(1989,
hereafter GT89),
Murthy et al. (1990),
and others have demonstrated that thermal IR emission from Galactic dust
and the scattered optical flux are well correlated, as both are a
function of the column density of dust and the strength of the
interstellar radiation field which both heats the dust and is
scattered by it. We therefore used the IRAS 100 µm maps to
select
a field with low 100 µm emission to ensure that the diffuse
galactic light (DGL) contribution would be minimal. The approximate
100 µm flux in the surrounding 1.5° × 1.5°
region
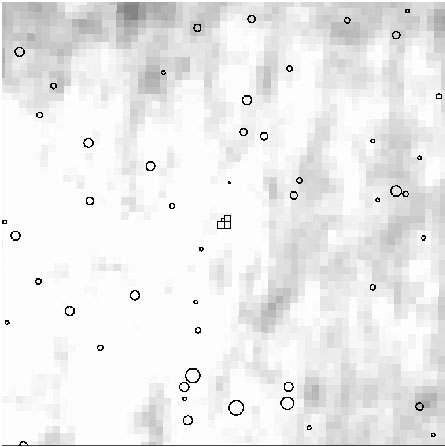
of our observations is shown in Figure 3, in
which the position of our target field is shown by the HST WFPC2 and
FOS footprints overlayed the IRAS 100 µm map. We have estimated
the low-level DGL (which contributes even along the most favorable
lines of sight) by using a simple scattering model which accurately
reproduces the observed scaling relations between 100 µm thermal
emission and the optical scattered light (see Equation 4). The model
combines an estimate of the dust
column density based on 100 µm emission with empirical
values for
the interstellar radiation field and dust scattering parameters.
Unlike the ZL, the flux from DGL is only roughly equal to the EBL in
surface brightness, so that uncertainty in this modeling does not
prohibit a detection of the EBL.
Figure 3. IRAS 100 µm map
(Beichmann et
al. 1986)
covering 1.5° × 1.5°centered on the WFPC2 EBL field. The
grey-scale is linear: white indicates 0.6 MJy sr-1at 100
µm,
corresponding to N(H i) ~ 0.6 × 10²⁰ and E(B -
V) ~ 0.01
mag; black indicate 1.6 MJy sr-1, corresponding to N(H i) ~
1.6 × 10²⁰, E(B - V) ~ 0.03 mag (see
Berriman et al.
1994).
HST/WFPC2 and FOS footprints are overlaid. Stars with
7 < V < 12 mag are marked with circles whose radii are
linearly proportional the magnitude of the stars.