


The detected EBL in each of the three WFPC2 bands is the difference
between the total sky flux in the WFPC2 images,
ITotal, and
the foreground flux from ZL and DGL. As described in
Section 8.1, the DGL contribution has no
spectral features, is relatively flat in
I ,
and is easily
subtracted. The spectrum of the zodiacal light is uniquely defined by
our measurement of the mean flux of the ZL at 4650Å, the solar
spectrum, and the color of the ZL as follows:
,
and is easily
subtracted. The spectrum of the zodiacal light is uniquely defined by
our measurement of the mean flux of the ZL at 4650Å, the solar
spectrum, and the color of the ZL as follows:

| (6) |
(See the Appendix A for a discussion of the
solar reference spectrum,
I , used
and the convolution of
IZL()
with the WFPC2 bandpasses to obtain the ZL flux through each filter.)
, used
and the convolution of
IZL()
with the WFPC2 bandpasses to obtain the ZL flux through each filter.)
Both the mean flux and color of the zodiacal light in the range 3900-5100Å are uniquely determined by our LCO data. However, the color over the wavelength range of the WFPC2 data is less certain. From our LCO data, we find C(5100, 3900) = 1.05± 0.01 from absolute surface spectrophotometry of the ZL. As discussed in Section 7, we find C(7000, 4000) = 1.044± 0.01 from our FOS spectra. Although this is in excellent agreement with the LCO results, extragalactic contributions are included in the FOS spectrum. We have therefore devised a method to further constrain the ZL color using the WFPC2 results.
Between 2000Å and 1 µm, the color of the zodiacal light relative to the solar spectrum as a function of wavelength is empirically known to be roughly linear with wavelength; the mean flux with respect to the Sun becomes redder by roughly 5%/1000Å over the range from 2500Å-1.4 µm. No deviations from a linear color are apparent in our FOS spectra, which are the first observations to have the required broad-band calibration sensitivity to address this question. To constrain the ZL and EBL surface brightness in all three bands, we therefore begin by assuming that the color of the ZL is a linear function of the solar spectrum with wavelength and that any small deviations from linearity average out over the 1000Å bandwidths of the WFPC2 filters.
Only if the EBL is flat in
I
would the color of the EBL plus
ZL be the appropriate color to adopt for the ZL. If, for example, the
EBL is blue in
I,
then the ZL is slightly redder. At 3000,
5500, and 8000Å, we have already identified minima for the EBL. If
we adopt these minima for the EBL at 3000 and 8000Å, we can
obviously infer that the maximum possible flux for the ZL is what
remains when we subtract the DGL and the minimum EBL from the total
surface brightness detected in each band. By considering the maximum
possible IZL at 3000 and 8000Å, and comparing
those maxima
to the absolute flux which we have measured at 4650Å, we constrain
the color of the ZL to be 3.0%/1000Å <
C(,
0)
<5.0%/1000Å. This estimate is in excellent agreement with the
color we find for the total background as measured by FOS, which was
4.4%/1000Å redder than solar. Using these extrema for the color
of the ZL, we can constrain the EBL at all three WFPC2 wavelengths
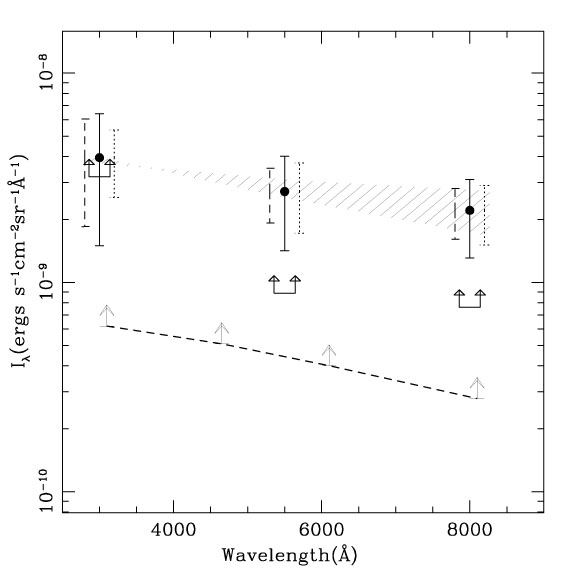
(see Figure 21). We adopt this range as the
3 uncertainty in the ZL
color.
uncertainty in the ZL
color.
|
Figure 21. Filled circles show the EBL23
obtained using
the HST/WFPC2 EBL images, the ZL flux measured at (4650Å), and the
nominal ZL color as described in
Section 11. The solid error bars (centered on
the filled circles) show the combined
1 |
We calculate final statistical and systematic uncertainties from the WFPC2 and LCO measurements assuming a Gaussian probability distribution for each source of random error listed in Tables 3 and 4 and in Table 1 of Paper II. The final systematic uncertainties are calculated assuming a flat probability distribution for the systematic uncertainties listed in the same tables. Cumulative random and systematic errors are quoted and plotted separately to give a sense of the measurement limitations. In general, random errors reflect limitations in instrument sensitivity and stability, while systematic errors are dominated by stability of the flux calibration of each instrument and the accuracy of the flux calibration for the instruments relative to each other. Uncertainty in the DGL subtraction is not explicitly included in these combined errors, as the total DGL flux is relatively small and the error would not contribute significantly to the total error. The DGL estimate was intended to be conservatively large, so that the EBL is, if anything, underestimated due to errors in the DGL.
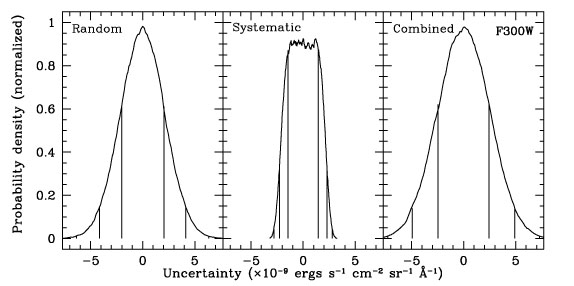
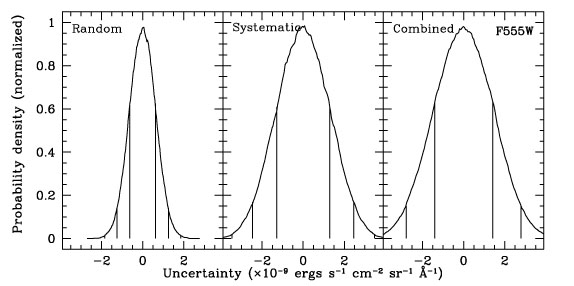
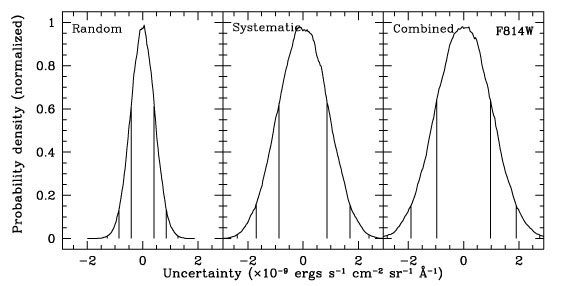
We have also calculated combined errors (systematic and statistical)
to obtain a final confidence interval. For this we have again assuming
a Gaussian probability distribution for all of the random sources of
error and a flat probability distribution for the systematic
uncertainties. The combined error probability distributions are shown
in
Figure 22. In general, non-Gaussian systematic
errors and Gaussian random errors cannot meaningfully be combined in
quadrature. Nonetheless, given the large number (16) of individual
sources of uncertainty contributing to our final errors, the combined
uncertainty has a nearly Gaussian distribution, as expected.
We therefore equate the 1
combined
errors for each bandpass with the 68% confidence intervals for the
mean EBL23 detections and the lower limits, minEBL23. The final
errors are summarized in see Table 10.
|
|
|
Figure 22. Combined probability
distributions of the
errors (systematic, random, and combined) for the EBL flux detected in
the F300W (panel a), F555W (panel b), and F814W (panel c) WFPC2 bandpasses.
A flat (Gaussian) probability distribution was assumed for each
contributing systematic (random) error. The vertical lines show
68.3%, 95.4%, and 99.7% confidence intervals, which we use to
define 1, 2 and 3 |
 28 A B mag as determined by ensemble photometry as
described in
28 A B mag as determined by ensemble photometry as
described in