


Zodiacal light (ZL) is sunlight scattered off of dust grains in the
solar system. Dust column densities are largest toward the ecliptic
plane, causing the highest ZL intensities there. The scattering
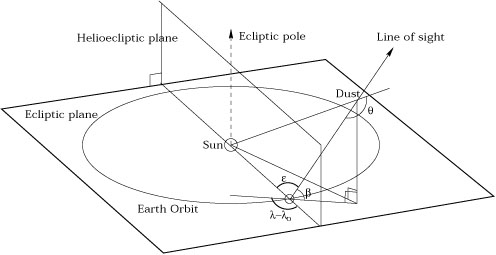
geometry is illustrated in Figure 1 for a high
latitude field viewed near the anti-solar direction. The figure shows
the scattering angle and line of sight as defined by geocentric
ecliptic longitude ( -
-  , in which
is
ecliptic longitude) and ecliptic latitude
(
, in which
is
ecliptic longitude) and ecliptic latitude
( ). At ecliptic
latitudes greater than 30 degrees and large scattering angles, the
zodiacal light can be as faint as ~ 23 mag arcsec-2 at
5000Å (~ 1 × 10⁻⁷ ergs s-1
cm-2 sr-1 Å-1) with a solar-type
spectrum. In the
ecliptic plane and near the Sun, the ZL can be as much as 20 times
brighter than at high ecliptic latitudes and significantly reddened
relative to the incident solar spectrum. The positional dependence of
the ZL flux and color is a function of the density and composition of
the scattering particles and of scattering geometry such that the
zodiacal light is redder and brighter at smaller elongation angles
(see Leinert et al.
1998).
In general, the solar spectrum is preserved
in the spectrum of the ZL with less than 30% deviation in the
broad-band spectral shape from the UV to the near-IR (0.2 -
2µm).
). At ecliptic
latitudes greater than 30 degrees and large scattering angles, the
zodiacal light can be as faint as ~ 23 mag arcsec-2 at
5000Å (~ 1 × 10⁻⁷ ergs s-1
cm-2 sr-1 Å-1) with a solar-type
spectrum. In the
ecliptic plane and near the Sun, the ZL can be as much as 20 times
brighter than at high ecliptic latitudes and significantly reddened
relative to the incident solar spectrum. The positional dependence of
the ZL flux and color is a function of the density and composition of
the scattering particles and of scattering geometry such that the
zodiacal light is redder and brighter at smaller elongation angles
(see Leinert et al.
1998).
In general, the solar spectrum is preserved
in the spectrum of the ZL with less than 30% deviation in the
broad-band spectral shape from the UV to the near-IR (0.2 -
2µm).
|
Figure 1. The geometry of zodiacal light
scattering (adapted from
Matsuura, Matsumoto, &
Matsuhara 1995).
The viewing line of sight is defined by ecliptic latitude
( |
Such weakly wavelength-dependent scattering can be characterized by simple Mie scattering theory, which generally describes the interaction of photons with solid particles larger than the wavelength of the incident light (Röser & Staude 1978). The interplanetary dust (IPD) cloud at the orientations of interest to us is known to be composed predominantly of particles larger than 10µm with moderate surface roughness and layered composition. These conclusions are based on IR observations of the thermal properties of the IPD, dynamical arguments, and laboratory work on dust captured in the upper atmosphere and on the moon (see Reach et al. 1996; Berriman et al. 1994, Dermott et al. 1996; Brownlee 1978; Fechtig et al. 1974; Leinert et al. 1998 and references therein). In the absence of free electrons, the cross-sections for non-linear scattering, such as Raman scattering or two-photon processes, are too low to be a significant effect for dust particles with large dielectric constants.
Indeed, Mie scattering models for rough particles with the size and composition of the IPD successfully describe the weakly wavelength-dependent scattering characteristic of the ZL: the incident spectrum is slightly reddened over very broad band-passes, while narrow-band spectral features are preserved to high precision (Weiss-Wrana 1983, Schiffer 1985). Both these narrow- and broad-band characteristics have been empirically demonstrated, as the ZL spectrum is seen to be roughly 5-10% redder per 1000Å over the range from 3000-8000Å than the Sun (see Leinert et al. 1998 and references therein), and Beggs et al. (1964) have shown that the Fraunhofer lines in the ZL show no measurable deviation from their solar equivalent widths to the accuracy of their calibration (2%). The broad-band reddening is characterized as the color of the ZL relative to the solar spectrum as a function of wavelength,
| (1) |
While Mie scattering explains the spectrum and intensity of the ZL in general, the exact flux of the ZL cannot be modeled to the accuracy we require here, simply due to uncertainties in the exact composition and column density of the IPD. Empirically, the surface brightness of the ZL is known to roughly 10% accuracy as a function of scattering geometry and ecliptic latitude alone. However, uncertainty in flux calibrations of those surface brightness measurements and spatial variability in the IPD cloud (such as cometary trails) preclude more accurate predictions (Levasseur-Regourd & Dumont 1980; Richter et al. 1982; Leinert et al. 1998 and references therein). In addition, most published measurements of the ZL flux include the background EBL in the reported surface brightness of the ZL. In order to detect the EBL, we must explicitly measure the zodiacal contribution to the sky surface brightness along a specific line of sight at a particular wavelength.
In order to uniquely define the ZL spectrum, both the mean flux in a narrow-bandpass and the broad-band color over the wavelength range of interest must be measured for the line of sight in question. We can do so by making use of the fact that the equivalent widths of solar Fraunhofer lines, reproduced in the ZL spectrum, are known to very high accuracy: we can then determine the continuum level (mean flux) of the ZL at a given wavelength by measuring the apparent equivalent width of the Fraunhofer in spectrum of the night sky. For example, if the equivalent width of the Fraunhofer lines in the night sky around 4500Å are only one half the strength of the same absorption features in the solar spectrum, then the ZL contributes only 50% of the night sky flux at that wavelength. A practical complication of this approach is, of course, identifying the continuum level for accurate measurement of the equivalent widths. Because the ZL and atmospheric emission (airglow) contribute almost equally to the night sky flux in the visible wavelength range at the ecliptic orientation of our observations, this becomes prohibitively difficult where airglow lines become strong (above 5500Å). The problem is further complicated by the fact that the airglow spectrum is continually changing, both in the strength of particular lines and in its mean, wide-band flux. In order to accomplish this measurement, we have therefore developed a new technique for deconvolving one known signal from a variable, multicomponent spectrum. The details of this technique are discussed in Section 5.
 ,
which is defined as
cos
,
which is defined as
cos .
.