


3.6.1. Point Source Calibration
We observed Hamuy et al. (1992, hereafter H92) tertiary spectrophotometric standards roughly 15 times each night. For each standard observation, we first centered the star in a narrow slit (~ 2 arcsec), and opened the slit to 10.8 arcsec after guiding was established. Nine different standards were observed throughout the run, with colors 0.0 < (B - V) < 0.6 mag. This range represents as broad a distribution as is available from the H92 standards and does bracket the color of the night sky. All standards were observed with the slit aligned along the parallactic angle (Filippenko 1982).
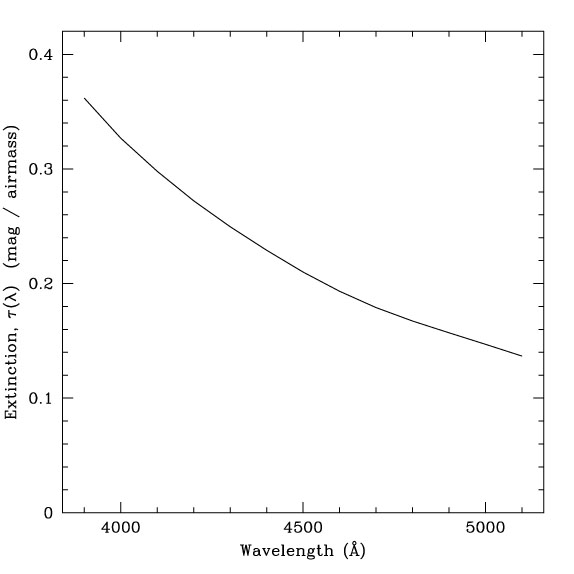
One-dimensional spectra were extracted from the two-dimensional images and wavelength calibrated in the usual way using the APSUM and DISPCOR tasks in IRAF. Extinction corrections were calculated from standard star observations themselves in 50Å bins for each night individually. Typical residuals in the extinction solution in each 50Å bin were 0.009 mag (rms) in the data taken on 1995 November 27 and 29. As no difference was found between the two nights, the final extinction solution was constructed from the data taken on both nights together using a sixth-order Legendre polynomial fit to the extinction as function of wavelength (see Figure 4), with an uncertainty of 0.2% as a function of wavelength. The resulting extinction curve is in excellent agreement with the r- and g-band extinction terms which we obtained from images taken simultaneously with the 1m Swope telescope at the same site.
|
Figure 4. The extinction function derived
from observations of standard stars
taken on 1995 November 27 and 29. Extinction solutions for the
two nights individually were found to be identical to within the
one-sigma statistical errors (
|
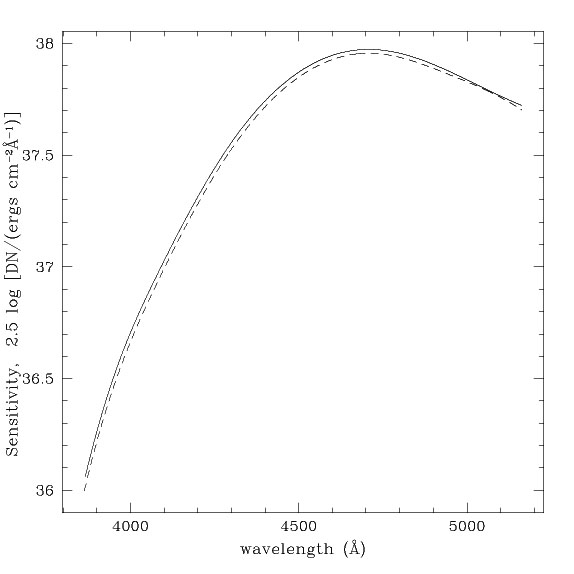
After the extinction corrections were applied to the standard star spectra, the sensitivity curve for each night was determined using the task SENSFUNC in the IRAF SPECRED package. The agreement between the sensitivity curves for the two nights is excellent: the variations between the sensitivity curves found for 1995 November 27 and 29 are 3% at 4100Å, and 2% red-ward of 4500Å (see Figure 5). Variations in the quantum efficiency of the CCD on this level are expected to result from temperature changes of a few degrees (M. Blouk, personal communication), so we do allow the sensitivity function solutions to be slightly different from night to night. The standard deviation in the SENSFUNC solution for both nights is 0.011mag, which translates into a 0.3% error in the mean sensitivity as a function of wavelength from 15 standard star observations. To be conservative, we adopt a systematic uncertainty in the point source calibration of 0.6%. Systematic errors in the tertiary standard star system of Hamuy et al. are discussed in Section 3.7. They are not included in the accuracy of the zodiacal light measurement discussed here. Those uncertainties are, however, relevant to the EBL detection for which we have used this zodiacal light measurement. That error is explicitly included in final accuracy of the EBL detections discussed in Paper I.
|
Figure 5. Two sensitivity functions obtained from observations of tertiary standards on different nights. The solutions differ by 1-2%, well within the fluctuations expected to arise from small temperature variations of the CCD. |
 0.01 mag). The function
shown is a
sixth-order Legendre polynomial fit to extinction coefficients
obtained in 50Å wide bins.
0.01 mag). The function
shown is a
sixth-order Legendre polynomial fit to extinction coefficients
obtained in 50Å wide bins.