


3.6.2. Aperture Correction
The aperture correction compensates for flux which is lost from the point source observations in two distinct ways. First, light is lost in the focal plane of the telescope if the radius of 100% encircled energy is larger than the half-width of the slit. Second, when a one dimensional spectrum is extracted from the two dimensional, dispersed image, some light will lie outside the extraction aperture in the spatial direction.
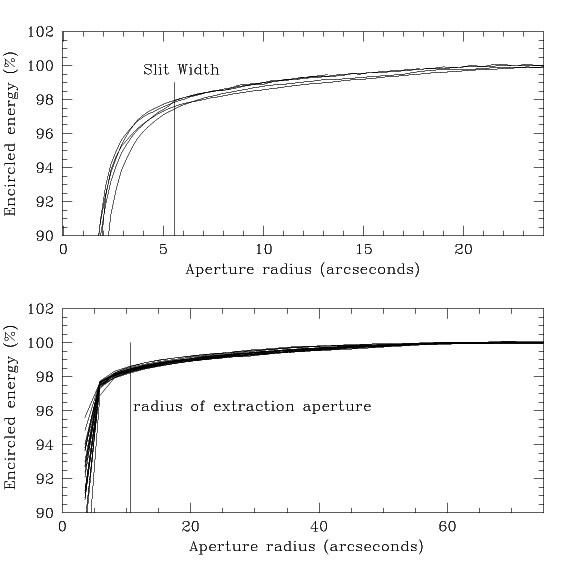
To measure flux lost in the aperture plane, we measured the PSF from images taken on the last night of the run (1995 November 30). We plot the encircled flux with radius (growth curve) for five stars in Figure 6. To be certain that focus does not affect the PSF at a 5arcsec radius, the stars used for this plot were taken with widely varying focus. As 5 arcsec in the focal plane of the duPont 2.5m Telescope corresponds to 0.45 mm (almost 19 pixels) it is difficult to have the telescope out of focus enough to affect the enclosed flux at a radius of 5arcsec. This is clear from the lack of variation in the shape of the growth curves shown in the figure. The fractional flux enclosed by the half-width of the slit used for standard star observations is 0.979 (± 0.002).
|
Figure 6. The upper plot shows encircled energy curves for stars imaged directly in the focal plane of the du Pont 2.5m telescope. The half-width of the slit (5.8 arcsec) used for standard star observations is indicated by the solid vertical line. The percentage flux from a point source which passes through this aperture is 97.9 (± 0.2)%. The lower plot shows the encircled energy curve along the spatial extent of a spectroscopic image, showing that 98.4 (± 0.1)% of the light entering the spectrograph from a point sources is recovered when a ± 10 arcsec extraction aperture is used. |
To determine the percentage flux lost once through the slit, we have mapped the growth curves along the spatial extent of the two dimensional spectra for all 45 standards taken during the run. The sky level for this test was taken from pixels further than 80arcsec from the peak of the star. We averaged 400 rows near the peak sensitivity of the spectrograph to increase the signal-to-noise. To confirm that the PSF has negligible wavelength dependence, we calculated the aperture correction at both the blue and red ends of the spectral range and found no variation in the growth curve. The growth curve along the slit for the 18 highest signal-to-noise spectra are shown in Figure 6. The differences in the encircled energy at the inner-most radii plotted are a result of differences in sub-pixel centering for spectra observed with 4 × 1 binning. This does not affect our results for spectra extracted to an aperture of ± 4 (binned) pixels (± 10.6 arcsec). As this plot shows, the extraction aperture is well within the region of good signal-to-noise in the star, and includes 98.4 (± 0.1)% of the flux from a point source which passed through the spectrograph slit. Sky background was measured outside an annulus of 25 pixels (60 arcsec) from the peak of the star. This aperture is small enough to ensure adequate signal-to-noise in the extracted stellar spectrum, and also ensures minimal error due to sky subtraction, as the stellar signal is much brighter than the sky background in the inner 10.6arcsec.
The total aperture correction for a uniform surface brightness, aperture-filling source is then the fractional flux recovered for a point source, or T = 0.963( ± 0.002).