


Whether the light originates from stellar nucleosynthesis, accretion onto compact objects, or gravitationally collapsing stellar systems, the total optical flux escaping from detected galaxies is quantified by number counts and luminosity functions. To the detection limits, number counts and luminosity functions contain exactly the same information regarding the integrated background light: the integrated flux from resolved sources is the same whether or not you know the redshift of the sources. However, in the context of predicting the EBL flux, luminosity functions contain information about the intrinsic flux distribution of the sources and thus allow us to estimate the flux from sources beyond the detection limits with better defined assumptions. In the following sections, we compare our EBL detections with the integrated flux obtained by both methods. Dust obscuration in the emitting sources will clearly reduce the UV and optical flux which escapes, but the EBL, number counts, and luminosity functions are all measurements of the escaping flux; the relative comparisons discussed in this section are therefore independent of dust extinction.
Using "ensemble aperture photometry" to measure the total flux from
galaxies as a function of magnitude in our V555 and
I814
images of the EBL field, we find that the standard photometry
methods used to produce the HDF catalog systematically underestimate
the flux from each source, as summarized in
Section 3 (see
Section 10 and Appendix B of Paper I for a thorough discussion). We use
these results to derive flux corrections as a function of
 µ =
µiso - µ0 (isophotal minus
central surface brightness),
which are essentially aperture corrections. These aperture
corrections are similar to those found by other authors (c.f.
Smail et al. 1995)
and are a natural consequence of integrating an extended
light profile to an insufficient radius. This effect can be
quantified for exponential or de Vaucouleurs profiles, as in
Dalcanton (1998).
However, the corrections we show here are empirical
measurements and assume nothing about the light profiles of the sources.
µ =
µiso - µ0 (isophotal minus
central surface brightness),
which are essentially aperture corrections. These aperture
corrections are similar to those found by other authors (c.f.
Smail et al. 1995)
and are a natural consequence of integrating an extended
light profile to an insufficient radius. This effect can be
quantified for exponential or de Vaucouleurs profiles, as in
Dalcanton (1998).
However, the corrections we show here are empirical
measurements and assume nothing about the light profiles of the sources.
The corrections we derive for the two bandpasses (see
Figure 2) are very similar functions of
µ, which
indicates that the profiles of detected galaxies are not a strong
function of wavelength over the baseline of observed V to I.
However, we note that a particular value of
µ occurs
at a brighter AB magnitude in I814 than in
V606 because the
limiting isophotal level (sky noise) in I814 is 0.6 AB mag
brighter than in V606. The corrections are therefore
larger in I814 than they are at the same AB magnitude
at V606. The
corrections in both bands include a correction which compensates for
overestimates in the sky flux from foreground sources (the pedestal
sky level described in Section 3). This
correction, which
accounts for errors in the local sky estimate, ranges from 0.1-0.3
mag, monatonically increasing towards fainter magnitudes. As in
V606 and I814, aperture corrections
for U300 band will
depend on the profiles of galaxies at U300 and the surface
brightness limits of the data. However, the very low signal-to-noise
ratio of our F300W images prevents us from determining aperture
corrections in that bandpass. The U300 photometry is
discussed further below.
We have applied the aperture corrections we derive to the individual objects in the HDF V606 and I814 catalogs (Williams et al. 1996), which fractionally increases the flux of each galaxy. For example, while galaxies in the HDF catalog with V606 ~ 30 A B mag have well-detected cores, less than 30% of their total flux is recovered: the total flux of a galaxy measured to have V606 ~ 30 A B mag by standard photometry methods is actually closer to V606 ~ 28 A B mag. The corrected and uncorrected (raw) galaxy counts and corresponding integrated flux with magnitude are compared in Figure 3 and 4. The integrated flux of the corrected galaxy counts roughly corresponds to the minimum value of EBL23, as the aperture corrections were derived from the calculation of the minimum EBL23 in our data. Statistical variations in galaxy counts between fields are to be expected.

|
Figure 3. The upper panel shows the galaxy
counts as published in the HDF catalog (filled circles) with
|
|
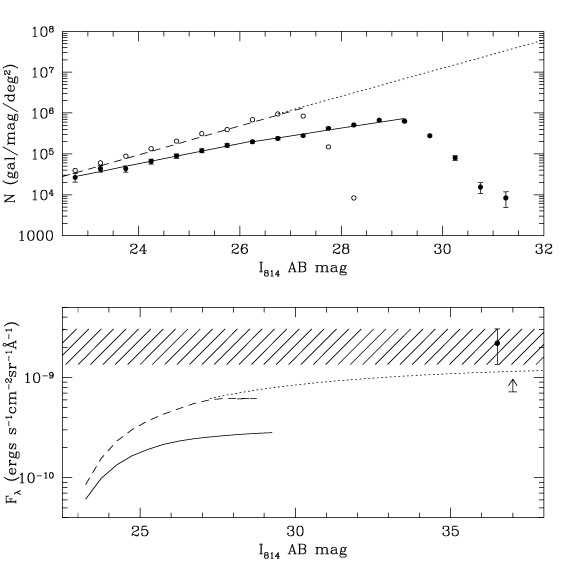
Figure 4. The same as Figure 3, but for the I814-band. As for the V606-band, the raw I814 counts show a slight change in slope around 24-26 AB mag, while the corrected counts do not. All slopes are given in the text. The integrated flux of the raw and corrected counts are compared to our EBL23 I814 detections in the lower panel, as in Figure 3. |
The aperture corrections we apply clearly have a significant impact on
the slope of faint number counts. To quantify this, we fit both the
raw and corrected number counts with the usual relationship between
apparent magnitude and surface number density,
N  10
10 m, where
N is the number of galaxies per magnitude per square
degree. For the raw V606 counts, we find that the data
exhibit a change in slope around 24-26 AB mag. A single fit
over the range 22 < V606 < 29.5 AB mag gives
= 0.24 ± 0.01
with a
m, where
N is the number of galaxies per magnitude per square
degree. For the raw V606 counts, we find that the data
exhibit a change in slope around 24-26 AB mag. A single fit
over the range 22 < V606 < 29.5 AB mag gives
= 0.24 ± 0.01
with a  2 per
degree of freedom
(2 / dof)
of 1.5. Fitting the counts brighter and fainter than 26 AB mag,
respectively, we find
b =
0.28 ± 0.02 with
2 / dof =
0.9 and f =
0.21 ± 0.01 with
2 / dof = 1.2
(solid lines in the upper panel of Figure 3). We
ascribe this change in slope to the onset of significant photometry
errors.
2 per
degree of freedom
(2 / dof)
of 1.5. Fitting the counts brighter and fainter than 26 AB mag,
respectively, we find
b =
0.28 ± 0.02 with
2 / dof =
0.9 and f =
0.21 ± 0.01 with
2 / dof = 1.2
(solid lines in the upper panel of Figure 3). We
ascribe this change in slope to the onset of significant photometry
errors.
For the corrected V606, counts we find that the full
22 < V606 < 27.5 AB mag range is well fit by a
slope of
= 0.33 ± 0.01 with
2 / dof =
0.60 (dashed line in the upper
panel of Figure 3). This result suggests that
photometry errors are responsible for the change in slope at the
faint end of the HDF counts,
and that N(m) does not, in fact, significantly decline
before the
detection limit of the HDF at V606. In addition, while the
integrated flux in the raw galaxy counts has converged by the apparent
detection limit of the HDF, the flux from the corrected galaxy counts
has not (see the lower panel of Figure 3).
We find similar results for the I814 counts (see
Figure 4). As for V606, the
raw I814 counts
display a slight change in slope around 24-26 AB mag. We find a slope
of b =
0.25 ± 0.01 with
2 / dof =
0.6, and f =
0.19 ± 0.02 with
2 / dof = 2.0,
brighter and fainter than 26 AB mag, respectively.
For the full range 22 < I814 < 29.5 AB mag, we find
= 0.22 ± 0.01 with
2 / dof = 2.1.
For the corrected I814 counts, we find
= 0.34 ± 0.01 with
2 / dof =
0.8 at 22 < I814 < 27 AB mag.
In Figure 5, we show the raw and corrected HDF counts relative to V- and R-band counts available in the literature for V > 15 AB mag. We have converted all of the published counts to V-band AB mag by applying constant offsets consistent with those in Fukugita, Shimasaku, & Ichikawa (1995). These incorporate mean K-corrections based on the mean redshift corresponding to the apparent magnitude of the sample. Differences between filters will have some affect on the slope of counts in surveys which cover a large range of redshift (apparent magnitude) due to changing galaxy colors and K-corrections with increasing redshift, but these effects will average out between the multiple surveys shown. This plot shows that the aperture corrections we have applied to the HDF sources produce number counts which have a slope consistent with the slope found at brighter magnitudes.

|
Figure 5. The raw and corrected number
counts from Figure 3
compared to number counts from the literature, labeled by first
author. The lines indicate fits to the data using the relation
N |
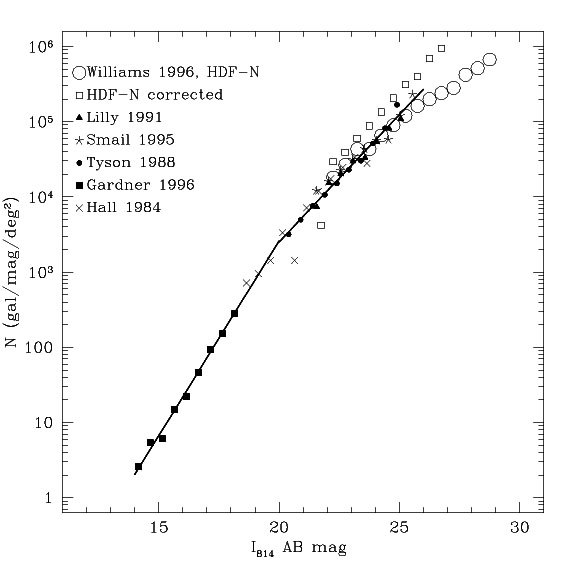
In Figure 6, we show the same plot for the I-band. Again, the corrected I814 counts display a slope which is similar to that found at magnitudes brighter than 23 AB mag. Note also that slope of the counts at < 25 AB mag in V and I are the same to within the statistical errors. The aperture corrections we apply to the HDF counts at V606 and I814 extend this agreement to the current detection limits. The corrected counts imply that the faintest galaxies detected do not exhibit a significantly steeper slope in V606 than in I814, in contrast with the raw galaxy counts. This is an important constraint on galaxy evolution models.
|
Figure 6. Same as
Figure 5 but for the I -band
counts. The lines indicate fits to the data using the relation
N |
Although the signal to noise in the U300 data is too
low to allow
us to obtain accurate aperture corrections at that wavelength, the
minimum EBL23 at U300 implies consistent colors for
faint and
bright galaxies at U - V, as in V - I (see
Figure 1
and Table 2). We note, also, that the
color of the
integrated flux from galaxies is consistent with the color of the
total background light within
2 . In other words, no exotic
population of sources is required to produce the detected background.
. In other words, no exotic
population of sources is required to produce the detected background.
The lack of turnover in the corrected counts strongly suggests that
sources do exist at apparent magnitudes beyond the present detection
limit. If we impose no limit on the apparent magnitude of sources and
simply extrapolate the galaxy counts beyond using
= 0.33 (dotted line in
Figure 3), we
obtain a prediction for the total integrated EBL23 of 1.3
cgs, which is 1 below
the measured value in the EBL field.
In this case, the predicted EBL23 converges around
V606 ~ 50 AB
mag, which is significantly fainter than a dwarf galaxy at z ~
6. However, very little flux is obtained from the faintest bins. If
we impose the limit
V606 ~ 38 AB mag as the faintest apparent
magnitude for a realistic source (e.g., a dwarf galaxy with
MV ~ - 10 AB mag at z ~ 4), we obtain a flux of
1.2 × 10⁻⁹ cgs. The flux from sources with
I814 > 23 AB mag is 1.3 × 10⁻⁹ cgs if
we adopt
= 0.34, with the flux
converging around
I814 ~ 60 AB mag. Adopting a more realistic faint
cut-off of ~ 38 AB mag, as discussed for V606, we
obtain a total flux of 1.2 × 10⁻⁹ cgs,
1 below the mean
detected value of
EBL23 at I814 (see Figure 4).
In order to obtain a cumulative flux equal to the mean detected EBL
(or the upper limit) from sources brighter than ~ 38 mag, the
slope of the galaxy counts in the range 28-38 AB mag would clearly
need to increase at some point beyond the current detection
limit. For example, the total flux from sources
23 < V606 < 38 AB mag will
produce the mean detected EBL if the sources with
23 < V606 < 28 AB mag obey a slope of
= 0.33 and sources with
28 < V606 < 38 AB mag obey
= 0.42. We stress,
however, that the total flux
obtained from sources with such a steep faint-end slope is critically
dependent on the cut of magnitude: the total flux reaches
5.1 × 10⁻⁹ cgs if we integrate the counts to 50 AB mag,
and to 9.0 × 10⁻⁹ cgs if we integrate to 60 AB mag.
Recall that our 2 upper
limit on EBL23 at V606 is
5.0 × 10⁻⁹ cgs. For
= 0.35 at V >
28 AB mag, the integrated flux reaches 1.37, 1.51, and 1.57 ×
10-9 cgs (converged) for faint
cut-off magnitudes of 40, 60, and 80 AB mag respectively. Although
it is obviously impossible to place firm constraints on the number
counts beyond the detection limit, as they may change slope at any
magnitude, we conclude that it is very unlikely that the slope beyond
V606 ~ 28 AB mag is steeper than
= 0.42. If the slope
continues at 0.33 <
< 0.35, the EBL23 reaches a roughly 1.3-1.5 × 10⁻⁹
cgs by V606 ~ 40 AB mag, <
1 below our detected value.
Similarly, for the I-band the integrated flux from sources matches
the mean detected EBL23 if the sources with
23 < I814 < 27 AB mag obey a slope of
= 0.34 and sources with
27 < I814 < 39 AB mag obey
= 0.42. For those
slopes, the total flux reaches the
2 upper
limit of the EBL23 at I814 by 50 AB mag. For
= 0.36, slightly above
the slope we find for the corrected
counts, the integrated flux reaches 1.31, 1.58, and 1.62 ×
10-9 cgs
(converged) for faint cut-off magnitudes of 40, 60, and 80 AB mag,
respectively. As for the V-band, we conclude that it is unlikely
that the I-band faint-end slope is steeper than 0.42 at any
magnitude. For a slope of
0.34 < < 0.36 for
I > 27 AB mag, the EBL reaches 1.2-1.3 × 10⁻⁹
by I814 ~ 40 AB mag,
1 below our detected value.
In summary, we conclude from the corrected number counts shown in
Figure 3 -
6 that sources are
likely to exist beyond the detection limit of the HDF. Furthermore,
if the number counts continue with the slope we measure at the
faintest levels, then the predicted EBL23 is within
1 of the
detected EBL23 at both V606 and
I814. If we extrapolate
beyond the detection limits assuming the slope found from the
corrected number counts, we find that less than 50% of EBL23 comes
from sources beyond the current detection limit at V606 or
I814 - the majority of the light contributing to EBL23
comes from sources which can be individually detected.
Finally, we note that our ensemble photometry method yields a statistical correction for the light lost from the wings of galaxies beyond the detection isophote. This light cannot, by definition, be recovered by standard single-object photometry. In contrast, the ensemble photometry method effectively adds together the light beyond the detection isophote from many galaxies to enable a significant measurement of that light.
 N error
bars and the corrected number counts (open circles), as described in
N error
bars and the corrected number counts (open circles), as described in