


5.2. Results
In Figures 16 through
18, we plot the distribution of the total
flux from the modeled galaxy populations as a function of redshift,
wavelength, and origin (detectable or undetectable galaxies).
Detection limits applied at each bandpass are the
5 detection
limits of the HDF catalog
(Williams et al.
1996),
with appropriate
conversions to the ground-based filter bandpasses, summarized in
Table 3. The conversions given in this Table
include differences in the evolutionary corrections and K-corrections
between WFPC2 and UBVRI filters (see
Figures 12 -
14), which are generally less than
0.3 mag and change by less than 0.1 mag at
z
detection
limits of the HDF catalog
(Williams et al.
1996),
with appropriate
conversions to the ground-based filter bandpasses, summarized in
Table 3. The conversions given in this Table
include differences in the evolutionary corrections and K-corrections
between WFPC2 and UBVRI filters (see
Figures 12 -
14), which are generally less than
0.3 mag and change by less than 0.1 mag at
z  0.5. We
only consider
sources with V > 23 mag here, and we assume perfect photometry for
sources which meet the detection criteria.
0.5. We
only consider
sources with V > 23 mag here, and we assume perfect photometry for
sources which meet the detection criteria.
|
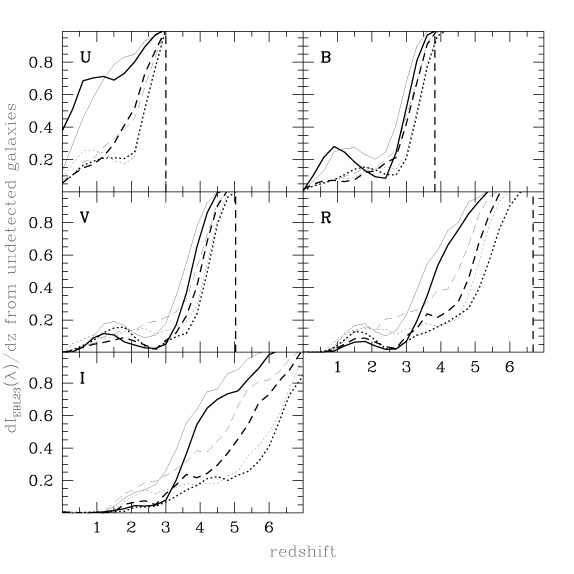
Figure 16. For the Johnson/Cousins
bandpasses indicated in each panel, we plot
the EBL from galaxies which are not individually detected
in each redshift bin,
normalized by the total EBL in each redshift bin. Models A, B and
PE are marked with solid, dashed, and dotted lines, respectively.
Thick lines correspond to simulations run with h = 0.7,
|
In Figure 16, we show the fraction of the total flux which comes from undetected sources as a function of redshift. For all models, this plot demonstrates that if galaxy populations at higher redshifts are the passively evolving counterparts of those in the local universe, the flux from undetected sources becomes significant by redshifts of 1 < z < 3. The undetected fraction is the highest in the U band, due to the high sky noise and low sensitivity of the F300W HDF images relative to the other bandpasses which define our detection criteria. The detection fractions are similar in B and V, where detection limits and galaxy colors are similar. The fraction of light from undetected sources in I is small at z < 2 due to the generally red color of galaxies, but increases beyond that redshift due to cosmological effects. Model A, with the largest fraction of low µ0 galaxies, has the sharpest increase in the undetected EBL with redshift, as expected. A balance between evolutionary- and K-corrections at 1 < z < 3 slow this trend and cause the dip in the fraction of undetected light in B, V, and R. The Lyman limit for each band obviously represents the highest redshift from which one could expect to detect flux.
In Figure 17, we plot the distribution of light
with redshift in these models. All three models have roughly the same
distribution of
IEBL( ,
z) simply because all models
employ a uniform comoving number density with redshift and the same
passive luminosity evolution. Although we do not intend to
realistically predict the redshift distribution of the EBL, we show
this plot for comparison with Figure 16 to
indicate the redshifts at which the majority of undetected galaxies
lie in these models. Looking at Figures 16 and
17 together, it is clear that while 40 - 100%
of the B-band flux from z > 3 is in undetectable
sources for all
of the models considered, only a small fraction of the total B-band
EBL comes from those redshifts. Thus, the majority of the light from
unresolved sources comes from 1 < z < 3 at B for
local-type galaxy populations in this scenario.
,
z) simply because all models
employ a uniform comoving number density with redshift and the same
passive luminosity evolution. Although we do not intend to
realistically predict the redshift distribution of the EBL, we show
this plot for comparison with Figure 16 to
indicate the redshifts at which the majority of undetected galaxies
lie in these models. Looking at Figures 16 and
17 together, it is clear that while 40 - 100%
of the B-band flux from z > 3 is in undetectable
sources for all
of the models considered, only a small fraction of the total B-band
EBL comes from those redshifts. Thus, the majority of the light from
unresolved sources comes from 1 < z < 3 at B for
local-type galaxy populations in this scenario.

|
Figure 17. For the Johnson/Cousins
bandpasses indicated in each panel and the
models discussed in the text, we plot the redshift distribution of the
EBL - the differential EBL from all galaxies as a function of
redshift, normalized by the total EBL in each band. Line types
correspond to the models as described in the caption of
Figure 16. In this plot, cosmological models
are virtually indistinguishable because the fractional volume per
redshift bin changes very little with
|
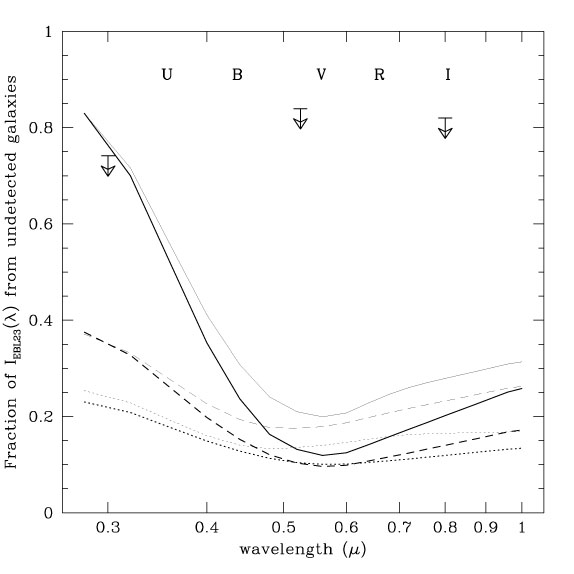
Figure 18 shows the fraction of EBL23 coming
from undetected sources as a function of wavelength. These models
indicate that 10-35% of the light from the high redshift
counterparts of local galaxy populations would come from
(individually) undetected sources in bandpasses between V and
I
with sensitivity limits similar to the HDF, 15-40% would come from
undetected sources at B, and 20-70% would come from undetected
sources at U. This trend with wavelength (smallest fraction of
undetected sources around 5000Å) follows the trend in the detection
limits of the HDF bandpasses, as discussed in
Section 4.1. Note
that the color of the EBL23 is similar to the color of detected
galaxies (see Figure 1) in V and
I, as is the
2 lower limit of
minEBL23 (see also Table 2).
|
Figure 18. The lines show the fraction of the EBL that comes from undetected galaxies as predicted by our models. Line types are as in Figure 16. Arrows show the upper limits on the fraction of the EBL which might come from undetected galaxies based on the EBL detections summarized in Section 3 and Table 2. These arrows show the ratio of flux recovered by ensemble photometry (from resolved galaxies) and the two sigma upper limits of our EBL detection. See Section 5.2 for discussion. |
We stress again that cosmological surface brightness dimming and the fraction of LSBs in each model are the dominant effects which govern how much light comes from undetected sources and these effects are independent of wavelength. The passive luminosity evolution corrections, K-corrections, and the HDF-specific detection limits we adopt will determine how the fraction of undetected sources varies with wavelength. Finally, we note that although the surface brightness distribution of galaxies as a function of redshift is presently unconstrained, and may or may not show significant variation with redshift, it is unlikely that the surface brightness distribution at any redshift is significantly more extreme than the distribution bracketed by our models. Bearing these uncertainties in mind, we can use the results of these models to estimate the value of EBL23 based on the minEBL23 (the flux in individually detected galaxies from ensemble aperture photometry) and the undetected fractions summarized above. If the universe is populated by galaxies with surface brightness distributions like those in the local universe, then these models suggest the following values for EBL23: 2.6-7.0 × 10⁻⁹ cgs, 1.0-1.3 × 10⁻⁹ cgs, and 0.9-1.2 × 10⁻⁹ cgs at U300, V555 and I814, respectively. These ranges are in good agreement with our detected values for EBL23 (see Table 2), and with the estimates of the EBL23 based on the corrected number counts we presented in Section 4.1.
 0 = 1.0,
while thin lines correspond to h = 0.7,
0 = 1.0,
while thin lines correspond to h = 0.7,