


The exponential nature of the light distribution in galactic disks was extended to a three-dimensional model using the self-gravitating isothermal sheet description for the vertical distribution (van der Kruit & Searle, 1981) (1)
| (1) |
The isothermal assumption was later dropped and replaced by the family of models (van der Kruit, 1988)
| (2) |
This ranges from the isothermal distribution (n = 1) to the
exponential function (n =
 ). From actual fits in
I and K'
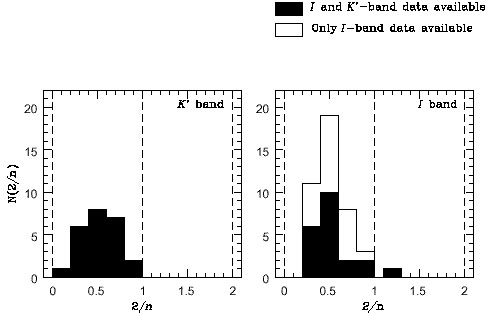
de Grijs et al.
(1997)
found (Fig. 1)
). From actual fits in
I and K'
de Grijs et al.
(1997)
found (Fig. 1)

| (3) |
I will take the whole range from the sech-function
to the exponential (that is
n = 2 - ; 2/n
= 0 - 1) into account in what follows, which is reflected in
the "uncertainties" in the coefficients in the equations below.
|
Figure 1. The distribution in K' and I of the exponent 2/n in eq. (2) for a sample of edge-on galaxies (from de Grijs et al., 1997). |
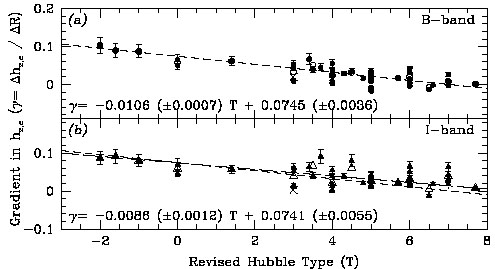
The constancy of the vertical scaleheight hz with radius has been studied in detail by de Grijs & Peletier (1997) (see Fig. 2) in the optical and near-IR and been confirmed at least for late-type galaxies. Disks in early type disks might have a small variation of hz with radius.
|
Figure 2. The radial change in the vertical scaleheight in a sample of edge-on galaxies (change in kpc in hz per kpc in R) as a function of morphological type. Except for the earliest types (S0 to Sab) the change is very small (from de Grijs & Peletier, 1997). |
With a constant mass-to-light ratio M / L, the luminosity
density L(R, z)
is proportional to the space density
 (R, z).
Then the surface density becomes
(R, z).
Then the surface density becomes
| (4) |
the vertical velocity dispersion in the plane
| (5) |
and the z-velocity dispersion integrated perpendicular to the plane
| (6) |
For the vertical velocity dispersion of the stars we expect for a constant hz

| (7) |
This is consistent with observations by van der Kruit & Freeman (1986) and in Roelof Bottema's thesis (1995, see also 1993), at least out to about 2 scalelengths (in B). Furthermore, Rob Swaters in his thesis (1999; chapter 7) found it also in the late-type dwarf UGC 4325, again out to about 2 scalelengths. On the other hand, Gerssen et al. (1997) could not confirm it in NGC 488: they suggest that the scalelength in B is not representative for the mass distribution. Also, NGC 488 is of early type and may not have a constant hz. So, the verification of eq. (7) is not complete. It is important to obtain K-band surface photometry for NGC 488 and the other galaxies in Bottema's sample.
|
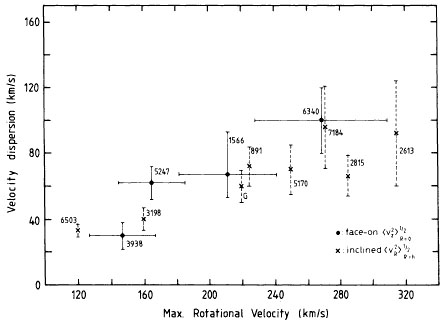
Figure 3. The relation between the stellar velocity dispersion and the maximum rotation velocity in disks of galaxies. The velocity dispersion is the vertical one at the center for face-on systems and the radial one at one scalelength in highly inclined systems (from Bottema, 1993). |
Bottema also found from a sample of 12 galaxies that the (extrapolated) vertical dispersion at the center and the radial one at one scalelength

| (8) |
where Vmax is the rotation velocity in the
flat part of the rotation curve (Fig. 3).
Even the late-type dwarf UGC 4325 was found to follow this relation
(Swaters, 1999;
 R, hR
~ 20 km/s, Vmax ~ 90 km/s).
It probably arises as follows:
R, hR
~ 20 km/s, Vmax ~ 90 km/s).
It probably arises as follows:
Take the equation for the Toomre (1964) parameter Q for local stability

| (9) |
Use a Tully-Fisher relation
L  Vmaxn with n = 4
and note that for a flat rotation curve the epicyclic frequency
Vmaxn with n = 4
and note that for a flat rotation curve the epicyclic frequency
 = sqrt[2]
Vmax/R. Then (9) can be rewritten as
= sqrt[2]
Vmax/R. Then (9) can be rewritten as
| (10) |
Here µo is the central face-on surface
brightness in L pc-2; µo and
M/L refer to the old disk population.
So the Bottema relation implies that
pc-2; µo and
M/L refer to the old disk population.
So the Bottema relation implies that
| (11) |
even for low surface brightness dwarfs. Observations of course allow a substantial scatter in this quotient (or the individual terms) among galaxies.
For "normal" disks obeying "Freeman's law" µo translates into 21.7 B-mag arcsec-2 and this then implies

| (12) |
If we ignore for the moment the (dynamical) influence of the gas, it can be shown (van der Kruit & de Grijs, 1999) that at R = 1hR
| (13) |
Here again the "uncertainty" in the coefficient relates to the range of vertical density distributions above. With the Bottema relation (8) this reduces to
| (14) |
In the solar neighborhood the axis ratio of the velocity ellipsoid
z /
R ~ 0.5
(Dehnen & Binney, 1998).
If this also holds at R = 1hR and using
hz ~ 0.35 kpc and
hR ~ 4 kpc, it follows that

| (15) |
The HI-layer thickness can be used to estimate the disk surface density.
HI observations of face-on galaxies (e.g.
van der Kruit & Shostak,
1984)
indicate an HI velocity dispersion
HI = 8 - 10 km
s-1. We can write
(van der Kruit, 1981)
| (16) |
Another estimate of the disk mass MD follows from the global stability criterion of Efstathiou et al. (1982)
| (17) |
For a pure exponential disk the maximum in the rotation curve (Freeman, 1970) occurs at R ~ 2.2hR with an amplitude
| (18) |
Hydrostatic equilibrium at the center gives
| (19) |
Eliminating
 (0) between (18) and (19)
and using the Bottema relation (8) gives
(0) between (18) and (19)
and using the Bottema relation (8) gives
| (20) |
So, the flattening of the disk can be used to test the "maximum disk hypothesis", for which fits to rotation curves usually give about 0.8 to 0.9 for this ratio.
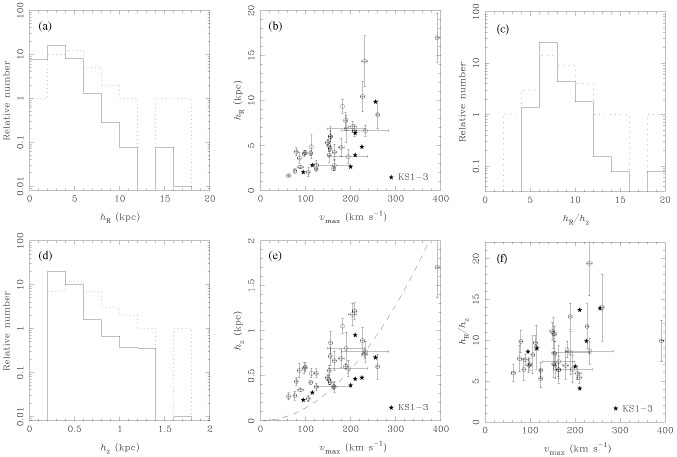
|
Figure 4. The radial scalelength hR and vertical scaleheight hz for a sample of 34 edge-on galaxies. Panels (a) and (b) show the distribution (solid line is corrected for sample selection) of hR and the correlation with the rotation velocity. Panels (d) and (e) show the same for hz and (c) and (f) for the ratio hR / hz (after Kregel et al., 2001). |
1 As explained in that paper, the idea to use the isothermal sheet was inspired by a remark made by Ken Freeman during IAU Symposium 77 in 1978. Back.