


Deep multicolor imaging is our most powerful tool
for understanding galaxy evolution.
Broadband filter measurements can go very deep; the
resulting spectral energy distributions
provide estimates of the photometric redshifts
of distant galaxies.
The Hubble Space Telescope, with its superb spatial resolution,
provides deep detections, along with detailed measurements of galaxy
morphologies, in small fields.
Large CCD cameras on ground-based telescopes provide
complementary coverage of much larger areas
(e.g. in [31], and
the Sloan Digital Sky Survey.) The next step, intensive spectroscopic
follow-up
(e.g., [39])
has been rewarded with
the detection of many hundreds of galaxies at redshifts of around 1 and 3.
Most galaxies at z  3
have been discovered using the powerful
Lyman break/U-band drop out selection method (e.g.,
[40]).
This method, which is currently confined to z
~ 3 - 4, does not of itself provide an accurate confirmed
redshift. Follow-up optical spectroscopy is still needed.
The Lyman break method falters at z < 2.7 because
at that redshift the Lyman limit has not yet cut out much of the
continuum in the U-filter. Lyman break galaxy (LBG) surveys are
not possible in the redshift 2 range.
3
have been discovered using the powerful
Lyman break/U-band drop out selection method (e.g.,
[40]).
This method, which is currently confined to z
~ 3 - 4, does not of itself provide an accurate confirmed
redshift. Follow-up optical spectroscopy is still needed.
The Lyman break method falters at z < 2.7 because
at that redshift the Lyman limit has not yet cut out much of the
continuum in the U-filter. Lyman break galaxy (LBG) surveys are
not possible in the redshift 2 range.
The intermediate redshift range around z ~ 2 appears to be
the epoch during which the familiar components of modern galaxies assembled.
A significant percentage of the universe's
evolution ( 3 Gyr),
or 25% of its total age, occurred from z = 1 to 3,
as opposed to the more distant and better-studied z = 3-4 range,
which covers
0.5 Gyr, or only 5% of
cosmic time.
This intermediate epoch can be dubbed the "Bright Ages", since it
appears to be the time when most stars
in the Universe formed (and most heavy elements were produced).
3 Gyr),
or 25% of its total age, occurred from z = 1 to 3,
as opposed to the more distant and better-studied z = 3-4 range,
which covers
0.5 Gyr, or only 5% of
cosmic time.
This intermediate epoch can be dubbed the "Bright Ages", since it
appears to be the time when most stars
in the Universe formed (and most heavy elements were produced).
However, our observational knowledge of galaxies in the crucial range of
z = 1.5 - 2.5 is surprisingly sketchy.
Due to severe limitations of optical search and confirmation methods, we
are in the odd
position of knowing more about the most distant galaxies than those closer.
Continuum observations at
 4000Å are needed to
assess the build-up of evolved stars. Similarly, the most useful
emission lines for measuring gas photoionized by
recently formed stars are in the rest-frame optical.
Thus the most reliable measures of total stellar mass as well
as current star formation rates (the first derivative of the former)
are obtained in the near-infrared for redshifts in the Bright Ages.
4000Å are needed to
assess the build-up of evolved stars. Similarly, the most useful
emission lines for measuring gas photoionized by
recently formed stars are in the rest-frame optical.
Thus the most reliable measures of total stellar mass as well
as current star formation rates (the first derivative of the former)
are obtained in the near-infrared for redshifts in the Bright Ages.
2.1. Near-Infrared Searches for Galaxies in the Bright Ages
Some of the early successes in identifying non-active, non-lensed galaxies at high redshifts came from searches for strong emission lines with narrow-band filters. This method provides accurate redshifts, but selects from a limited range of redshifts and has yielded only a modest number of detections (e.g., [27], [28], [9]).
Optical multicolor photometry alone works well at measuring
the Balmer break up to z ~ 1.
Infrared photometry makes it possible for us to identify
Balmer break galaxies at 1.5  z 2.5.
New large-format detectors are able to make
sensitive surveys in the near-IR wavebands, especially
with the key 2.2 µm (K) band.
This allows us to measure the
second strongest spectral feature in galaxies-the Balmer break,
from around 4000Å to 3650Å.
This blue-side drop is nearly always strong in populations of
young or old stars (although its wavelength shifts slightly
redward in older galaxies).
z 2.5.
New large-format detectors are able to make
sensitive surveys in the near-IR wavebands, especially
with the key 2.2 µm (K) band.
This allows us to measure the
second strongest spectral feature in galaxies-the Balmer break,
from around 4000Å to 3650Å.
This blue-side drop is nearly always strong in populations of
young or old stars (although its wavelength shifts slightly
redward in older galaxies).
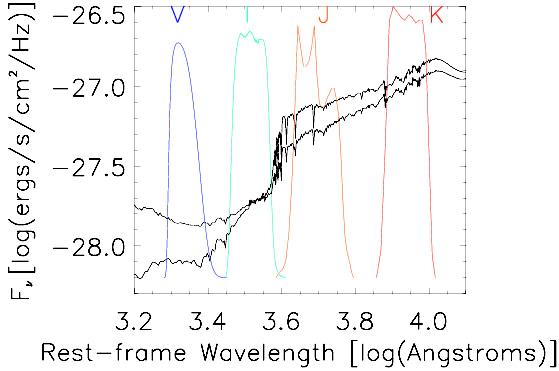
Figure 1 shows the V, I, J and K bandpasses
superposed on the model spectrum of a galaxy at z = 1.5.
To reach z = 2.5 requires good photometry in the
K filter, so that at least one point in the spectral energy distribution
is cleanly on the red side of the Balmer break.
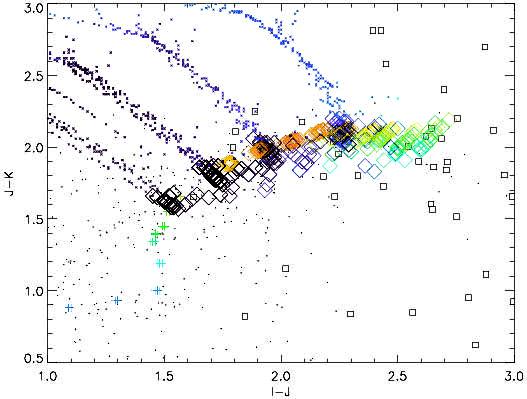
Two-color plots are useful for identifying galaxies likely to lie in the
Bright Ages epoch.
An example is shown in Figure 2.
Models with a variety of star-formation histories are shown for
galaxies with 0 z
1 by the crosses; models with
1 z
2 by the diamonds, and
2 z
3 with the small dots.
In the astro-ph version I color-coded these model predictions based on
their V-I colors. The open squares show galaxy photometry from one of our
deep fields imaged on the Lick 3-m telescope.
|
Figure 1. The VIJK filter set superposed on typical galaxy spectra at z = 1.5. The representative Spectral Energy Distribution for the galaxy is from the GISSEL spectral synthesis models. The Balmer break produces a very red I-J color. As the redshift increases above 1.5, the shift in the Balmer break makes J-K redder than 2. |
|
Figure 2. The the I-J,J-K plane for model galaxies at redshifts from 0 to 5. In the astro-ph version, additional V-I information is encoded in color (with the bluest values shown as the bluest points). The colored points outline tracks for Bruzual and Charlot stellar evolution models of galaxies with initial formation epochs at high redshift which then have superposed more recent starbursts of varying strengths. The limited grid of starburst epochs (z = 2.6, 2.8. 3.0, 3.5, 5) produces the several different locations of the "peeling back" in the two-color diagram. Note that the rest-frame UV light (shifted into the B+V bands) is extremely sensitive to the temporary presence of young stars, while the rest-frame optical (in the J and K bands) is insensitive to them. The open squares show our measurements of galaxies in one of the deep fields we observed with the Gemini 2-channel infrared camera on the Lick 3-m telescope. |
The 3600/4000Å break is less strong than the Lyman break. Nonetheless, by fitting the full galaxy multiwavelength spectral energy distribution to redshifted galaxy templates we can estimate its photometric redshift to an accuracy of one or two tenths in z (e.g., [17], [8], [3], [13]). Infrared flux points greatly improve the accuracy of the method [7]. To demonstrate the power of this method, we present a six band (B through K) picture of an very red object [6]. Figure 4 shows the photometric redshift fit to its BVIJHK spectral energy distribution, using Hyperz ([2]). The infrared bands were crucial not only in identifying this as an interesting object, but allowing a fit to data beyond the 4000Å break. The fit estimates its redshift, z =1.23 ± 0.25, and also that it is a 0.5 Gyr old burst of star formation with AV = 1.2 mag of dust extinction. The infrared photometry provides a fairly good estimate of the total stellar mass.
A lot of what we think we know about high-redshift galaxies
rests on the limited statistics of photometric redshifts in the
Hubble Deep Fields, mostly HDF-N.
The HDF-N has 150 galaxies with photometric redshifts
in the Bright Ages (1.8 z
2.6).
However, only 8
of these are spectroscopically confirmed after extensive efforts,
and no Bright Ages galaxy candidates in HDF-S
have confirming spectra yet.
Major conclusions have been drawn from analysis of one
2.6' × 2.6' image of the Universe.
This is particularly dangerous since LBG surveys have found large
field-to-field variations-up to a factor of four in surface
density-due to large-scale structures, which also appear as
spikes in redshift histograms. Since our view of galaxies
depends strongly on which sight-line we observe,
it is imperative to investigate galaxy evolution in several regions
with similarly deep data.
Many efforts, both ground- and space-based, are currently
underway to do this, for example at Subaru
([22]),
VLT (VIRMOS/DEEP) and NOAO (Deep Wide-Field Survey).

|
Figure 3. Mosaic of reduced multicolor images of a 4 × 4 " box around a galaxy in the 53W002 field with photometric redshift z = 1.12. Wavelength increases from B at the left to K on the right; the object can qualify as an "Extremely Red Object" (ERO), with V - K > 6. The smooth round bulge becomes progressively more dominant at longer wavelengths, while at the shorter wavelengths the galaxy appears patchy with irregular arms. |
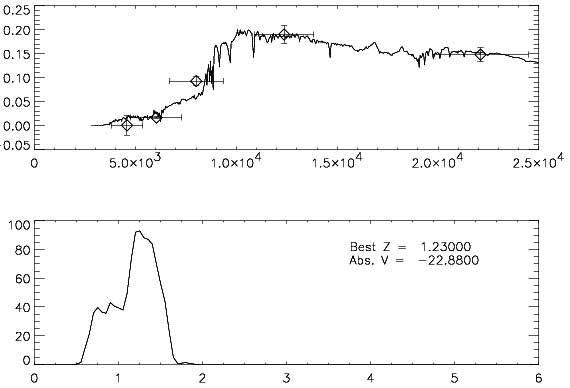
|
Figure 4. BVIJK photometry we measured for an "extremely red" galaxy in the MTM0953+549 field. Note the sudden jump at the Balmer break, which makes a very large V-J color, even though the J-K is not unusually red. The best-fitting spectral template, at z = 1.23 is overplotted in the top panel. The lower panel shows the probability distribution of acceptable redshifts fitted by the photometric redshift engine. The best fit implies the galaxy has MV = - 22.9. |