


A region's "current" star formation rate (SFR) is approximately proportional to its population of upper main sequence stars, because of their cosmically brief lifetimes. The presence of massive stars is manifested in several observables which are not strongly produced by old stellar populations: a) direct photospheric radiation, predominantly in the UV. At lower frequencies it extends into the optical, where it produces blue colors in a stellar population. The high-frequency tail extends above 1 Ryd, and includes a substantial fraction of ionizing photons, in the hottest stars. Much of this radiation is absorbed by gas and re-emitted as b) nebular emission lines, mostly in the optical and infrared. The most massive stars hardly live long enough to completely leave the dusty environments in which they were born. Thus, much of their remaining continuum emission may be absorbed by interstellar dust grains, which are warmed to c) re-emit the power thermally in the infrared. Finally, massive stars are the most violent sources of mechanical energy in the ISM, driving winds and supernovae. A fraction of this power accelerates electrons which then emit d) synchrotron radiation.
After a great deal of work on the alternatives, it is
H emission which remains
the "gold standard" of SFR measurements. It is equivalent
to counting the ionizing continuum photons from the hottest
(youngest) main-sequence stars at a wavelength that is relatively
insensitive to absorption.
The observable line luminosity is supposed to
equal a constant times the aggregate SFR:
L(H) = 1.1
× 1041 erg/sec per
M
emission which remains
the "gold standard" of SFR measurements. It is equivalent
to counting the ionizing continuum photons from the hottest
(youngest) main-sequence stars at a wavelength that is relatively
insensitive to absorption.
The observable line luminosity is supposed to
equal a constant times the aggregate SFR:
L(H) = 1.1
× 1041 erg/sec per
M / year
[16].
/ year
[16].
By contrast, the other leading SFR indicator at high redshift-the ultraviolet continuum-is far more sensitive to dust reddening. The integrated star-forming luminosity of those LBGs detected needs to be corrected upward for extinction by a factor of 2 - 7 ([32], [33], [1], [14], and [38]). Furthermore, these LBGs were selected to be the least dusty ones.
We can obtain a better idea of why the line and continuum SFR estimates
disagree (methods a and b above) by looking
closely (with HST) at nearby star-forming galaxies.
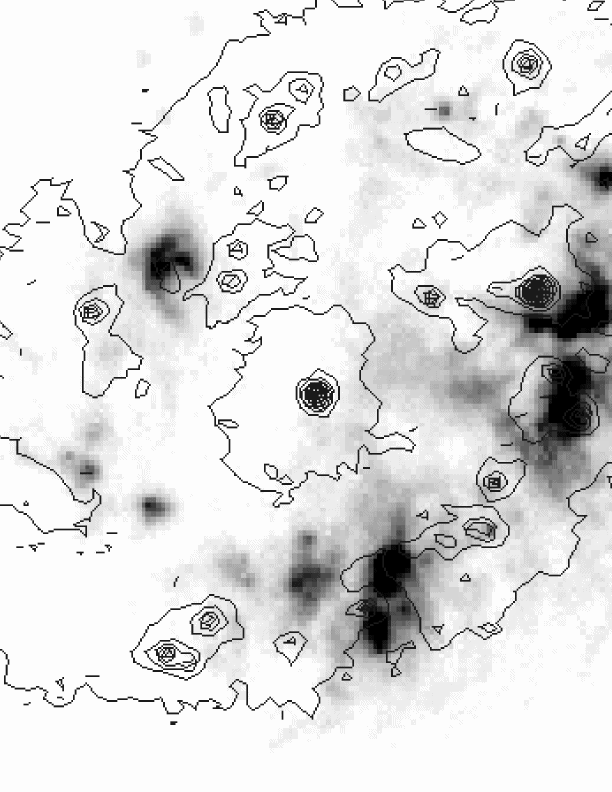
The contours in Figure 5
show our HST imaging of the (continuum-subtracted)
H in the
small star-forming galaxy NGC 2328. The greyscale shows the optical
continuum, which has a considerably different spatial distribution.
Note the numerous contour peaks with little or no associated optical light.
These HII region complexes with significant reddening account for the
majority of the current star formation in this galaxy.
Another even more dramatic example of a dust-enshrouded starburst is
seen in the nearby galaxy NGC 5253
[11].
|
Figure 5. Our WFPC-2 continuum-subtracted
H |
Although H gives a more
complete census of recent star formation, it cannot be measured with
CCD spectrographs for z  0.5. Even the weaker and less reliable
H
0.5. Even the weaker and less reliable
H line is shifted out of the
optical range at z 1.
Fortunately, they are still measurable in the near-infrared.
Two methods-one ground-based and one space-based-have been
successful.
line is shifted out of the
optical range at z 1.
Fortunately, they are still measurable in the near-infrared.
Two methods-one ground-based and one space-based-have been
successful.
3.1. Narrow-Band Infrared Imaging of Emission-Line Galaxies
Large-format multislit spectrographs are not yet available in
the near-IR. This will change when
instruments such as the NIRMOS (Near-infrared
Multi-Object Spectrograph) begin working on the VLT,
and Flamingos (in multi-slit mode) on Gemini.
For now, ground-based searches are restricted to either narrow
spatial or spectral windows. The latter case is obtained
with narrow-band interference filter imaging.
To speed up the detections, there is often a
pre-selection of special fields. These are supposed
to have excess galaxies at the targeted redshift, because
some object in the field is already known to have that z.
Several dozen galaxies at redshifts above 2 have been
discovered by detecting their H
line emission
([27],
[28],
[4],
[15],
[29]).
More discoveries will be coming soon with the availability
of 1K × 1K near-infrared array detectors.
Slitless spectroscopy receives the full sky background from the entire spectral window at each point on the detector. It is therefore impractical with ground-based infrared telescopes. However, it has been demonstrated to work very well in space, where the backgrounds are much lower. In particular, the NICMOS Camera 3 on HST has an objective grism that disperses the spectra of all objects within its 50" field-of-view. Since it was able to operate simultaneously with other HST instruments, it obtained a substantial number of deep parallel pointings on random fields. The largest set of these were reduced and analyzed by McCarthy et al. [30]. The exposures of a few orbits had a 1 in 3 chance of detecting a line-emitting object in the field; in the longer parallel observations, these odds increase to nearly 100%. In addition, a single very deep NICMOS grism field was observed during a 3-day pointing in the Continuous Viewing Zone ([23]).
The standard assumption in deep near-IR grism surveys of random
fields is that any single emission line detected is
redshifted H. In only one of
the dozen cases tested so
far has this assumption been shown to be incorrect; it is
likely true better than 90% of the time.
This allowed Yan et al.
42]
to estimate the global luminosity
function of recent star formation in the
0.8  z
1.7 universe.
z
1.7 universe.
In some cases, the difficult confirmation with optical spectroscopy
is not even necessary because a second emission line is also
detectable simultaneously in the NICMOS grism image.
Figures 6 and 7 show
deep grism spectra (observed wavelengths) in which emission lines
other than H detected.
In Figure 6 the additional lines on the blue
side are
H , and the [OIII]5007
/ 4959 doublet, at ze = 1.49.
In Figure 7 the only emission-line spectrum
which does not show H
is shown.
This foreground (ze = 0.35) galaxy shows
the strong emission lines of He I 1.083 /
P 1.093 µm,
[FeII]1.257 and P 1.281
µm
[23].
1.093 µm,
[FeII]1.257 and P 1.281
µm
[23].

|
Figure 6. Extracted spectrum of a
star-forming galaxy discovered in a deep NICMOS-grism parallel observation
(Malkan et al.
[23]).
At a redshift of 1.49, this low-resolution spectrum shows both
H |

|
Figure 7. Another star-forming galaxy in
the same NICMOS parallel field
[23].
This is the only grism spectrum
in which none of the detected emission lines is
H |
In its first incarnation, this camera was defocused by
the distortion of the NICMOS dewar.
This degraded the spatial resolution to about 0.4".
The resulting spectral resolution was only R ~ 50.
Hopkins et al. [14]
used NICMOS Camera 3 for pointed observations
of suspected high-redshift galaxies during a campaign when
it was in focus. Both their observations and the parallel ones
indicated that SFR rates estimated from
H emission in galaxies at
0.8 z
1.7 are several times
higher than those estimated from their UV continuum.
These large numbers of strong
H-emitting
galaxies already indicate that search methods using shorter
wavlengths are incomplete. Similar incompleteness in
surveys of star formation rates has
also been found in the local universe by Sakai et al.
[35].
If short-wavelength surveys really do miss a substantial
amount of obscured star formation activity, we should
examine galaxies that are found in the near-IR, to see if they are
indeed dustier than those discovered by optical surveys.
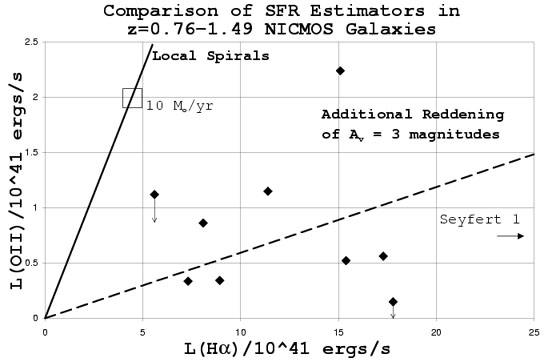
In Figure 8 we compare the two emission-line
indicators of current
star formation rates-H
and [OII]3727 luminosities.
The nine data points represent the NICMOS-selected
galaxies, with followup Keck optical spectra from Hicks et al.
[12].
The solid line shows the observed average ratio in local spirals,
which does not fit the NICMOS galaxies.
In these IR-selected galaxies the [OII] line systematically
underestimates the SFR.
This discrepancy between the two indicators cannot
be predicted from the broadband colors, which are not often
extremely red. Many of these galaxies
must contain additional internal reddening around their
star-forming regions. The dashed line shows an
indicative amount, of AV = 3 mag.
If the ten galaxies we measured are representative of
H selection
in general, it produces samples of galaxies which a) would mostly
be missed by optical search methods; and b) still need a significant
upward correction for dust extinction. We need
H and short-wavelength SFR
measurements for more
of the same galaxies to see how much overlap there is
between those selected with optical and IR searches.
|
Figure 8. Comparison of star formation
rates estimated from
[OII]3727 and H |
3.3. Nebular Diagnostic Line Emission at Higher Redshift
H is redshifted beyond the
prime sensitivity of
infrared detectors at z
2.6. By unlucky coincidence, the rising
thermal background makes it impossible to compare star formation
rates from H with those
estimated from the ultraviolet continuum in the LBGs.
Thus the only way to make a direct comparison of SFR indicators
(i.e., on the same galaxies) is by replacing
H with another
emission line that is bluer in the optical rest-frame, and less reliable.
The advantage of using H as
this "silver standard" SFR estimator
is that its intrinsic strength relative to
H is known accurately from
recombination theory
[33].
The [OIII] 5007 and
4959Å doublet, however, is usually two or three times stronger, and
is not so affected by underlying stellar absorption.
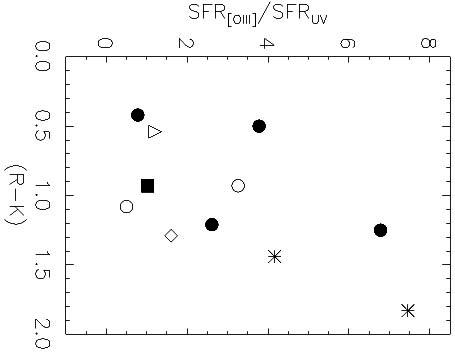
In Figure 9 we compare the star formation rates
predicted by
[OIII] and UV continuum emission in eleven LBG's at z ~ 3.
A few galaxies lie near the bottom of the graph, consistent with 1-to-1
agreement. However in most of them, the [OIII] line emission predicts
a higher SFR by a factor of 3 to 7 times. This is again consistent with
the amounts of internal dust reddening that have been inferred from
other observations.
|
Figure 9. The ratio of star formation rates estimated by [OIII]5007 and UV continuum emission from 10 Lyman break galaxies [38]. [OIII] for the open circles and asterisks was measured from narrow-band imaging; for the remaining points it comes from slit spectroscopy. The [OIII] line reveals several (up to seven) times more current star formation than does the UV continuum, especially in the redder galaxies. This is probably largely attributable to internal dust reddening. |