


The thermal dust emission, (method "c" above) can estimate the high-redshift SFR with hardly any sensitivity to extinction. Instead of measuring the primary signatures of hot young stars- their UV continuum and resulting ionized gas-we can measure this emission after it is reprocessed by dust, since that is where much (probably most) of the energy ends up before escaping the galaxy. This secondary thermal continuum is emitted mostly at 25-60 µm. Since this continuum emission can dominate the entire bolometric luminosity of a dusty star-forming galaxy, it is now detectable out to high redshifts.
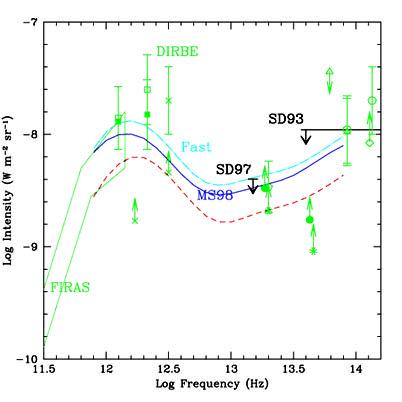
First, it can be detected globally, by wide-area measurements of the Diffuse Infrared Background (DIRB) radiation. New observations continue to define the DIRB more and more accurately, over a wide wavelength range (from 2-500 µm). It is surprisingly bright, and requires strong cosmic evolution in the population of dusty galaxies at z ~ 1 (e.g., [25]). "Backwards evolution" models, which are based on our empirical knowledge of infrared emission from local galaxies, have also improved. Figure 10 illustrates a recent comparison between these models and DIRB observations, from Malkan and Stecker [26]. Two plausible evolutionary scenarios are shown - a baseline model with pure luminosity evolution going as (1 + z)3, and a "Fast" evolution scenario that reaches the same maximum luminosities at an earlier z, 1.4 rather than 2.0. As shown in Figure 11, this latter scenario is somewhat more consistent with independent estimates of the cosmic SFR evolution, compiled by Rowan-Robinson [34].
|
Figure 10. Model predictions of the Diffuse Infrared Background Emission from galaxies, compared with observations, from Malkan and Stecker [26]. The "best guess" baseline evolutionary model shown by the middle line, assumes that infrared luminosities of galaxies increase as (1 + z)3 from z = 0 back to z = 2. The most rapid evolution model, shown by the upper ("Fast") line, assumes luminosity evolution as (1 + z)4 back to z = 1.4, and is also marginally consistent with all the observations. The lower limits are set by deep number counts obtained with the Infrared Space Observatory. The two lines with upper limits are set by the absence of high-energy absorption in the gamma-ray spectra of distant blazars, from Stecker and DeJong. Most of these strong observational constraints became available after the MS models were first published. |
|
Figure 11. Comparison of the luminosity evolution model from Malkan and Stecker (1998 and 2001, [25], [26]) with estimates of the global evolution of star formation rates. The baseline evolution, and rapid evolution models of MS are shown by the light and dark solid lines, respectively. Both assume no evolution from z of 2 up to 5. Error bars are estimates from Rowan-Robinson [34] based on a variety of observational methods, with substantial corrections for dust extinction applied. |
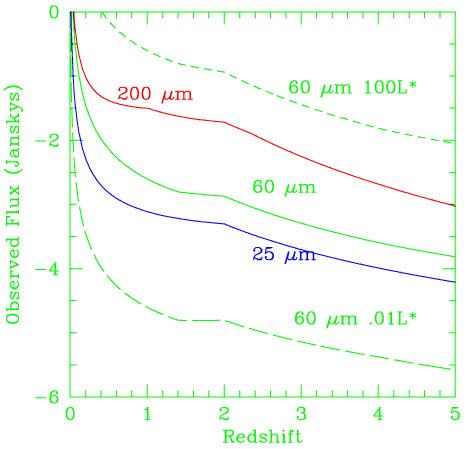
Upcoming deep IR surveys from space will soon resolve this background. The key is surveying enough area with sufficient sensitivity to detect "typical" galaxies at the desired redshifts. "Typical" can be defined by the characteristic knee in the galaxy luminosity function, which is well defined at z = 0, and appears to be more luminous at high redshifts [40]. Although such "L*" galaxies are not very numerous in a standard Schechter luminosity function, galaxies of L* or brighter do produce more than 16% of the total integrated galactic luminosity. And in flux-limited samples, where the number of galaxies detected gets weighted like L3/2, half of the total luminosity will come from galaxies of 0.7 L* and brighter. Figure 12 shows the Malkan and Stecker predictions for the observed fluxes of L* galaxies back to redshift 5, for 3 different wavelengths. Note that they do not fade much from z = 0.5 to 2 because of their strong luminosity evolution.
|
Figure 12. Predicted brightness at infrared wavelengths of an L* galaxy, from Malkan and Stecker [26], at 25, 60 and 200 µm. The dotted lines show the predicted brightnesses for galaxies 100 times above and below the characteristic L* knee of the luminosity function. There is a kink at z = 2, beyond which the galaxy luminosity evolution is assumed to level off. |
SIRTF, in its "First Look Survey", and Astro-E (IRIS), in a wider sky
survey, will have the sensitivity needed to detect
the typical L* galaxies at z
 1 which are expected to
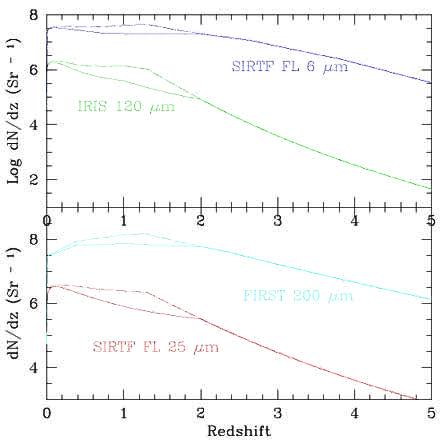
dominate the DIRB. As shown in Figure 13,
the longest cosmological reach is provided by observations
at 6 µm (with SIRTF) and 200 µm (with FIRST),
since these wavelengths are redward of
the two peaks in the spectra of galaxies. This results
in "negative K-corrections", the reverse of the usual situation
in which higher redshifts shift a relatively fainter part of
the galactic spectrum into our fixed observing bandpass.
1 which are expected to
dominate the DIRB. As shown in Figure 13,
the longest cosmological reach is provided by observations
at 6 µm (with SIRTF) and 200 µm (with FIRST),
since these wavelengths are redward of
the two peaks in the spectra of galaxies. This results
in "negative K-corrections", the reverse of the usual situation
in which higher redshifts shift a relatively fainter part of
the galactic spectrum into our fixed observing bandpass.
|
Figure 13. Predicted logarithmic number counts per unit redshift for galaxy luminosity evolution models in Malkan and Stecker [26]. The higher line, shown by dashes, illustrates the "Fast evolution" model. |