


4.5. Uncertainties in Cross-Correlation Lags
Although cross-correlation techniques have been applied to AGN time series for about 15 years, there is still no obvious or even universally agreed-upon way to assess the uncertainties in the lag measurements obtained. At present, the most effective technique seems to be a model-independent Monte-Carlo method known as FR/RSS (for "flux redistribution/random subset selection") 70 .
FR/RSS is based on a computationally intensive statistical method known as a "bootstrap". The bootstrap works as follows: suppose that you have a set of N data pairs (xi, yi) and that linear regression yields a correlation coefficient r. How accurate is r? In particular, how sensitive is it to the influence of individual points? One can assess this by a Monte Carlo process where one selects at random N points from the original sample, without regard to whether or not any point has been selected previously. For the new sample of N points (some of which are redundant selections from the original sample, while some points in the original sample are missing), the linear correlation coefficient is recalculated. When this is done many times, a distribution in r is constructed, and from this, one can assign a meaningful statistical uncertainty to the original experimental value of r.
This process can also be assigned to time series, except that the time tags of the points have to be preserved. In effect, then, this means that redundant selections are overlooked; the probability that in N selections of N points a point will be selected zero times is 1 / e, so the new time series, selected at random, has typically fewer points by a factor of 1 / e (hence the name "random subset selection"). Welsh 92 suggests that this should be modified in the sense that the weighting of each selected point should be proportional to sqrt[ni], where ni is the number of times the data point (xi, yi) is selected in a single realization. This is closer in philosophy to the original bootstrap, but it has not been rigorously tested yet.
The other part of the process, "flux redistribution," consists of changing the actual observed fluxes in a way that is consistent with the measured uncertainties. Each flux is modified by a random Gaussian deviate based on the quoted error for that datum (i.e., after a large number of similar modifications, the distribution of flux values would be a Gaussian with mean equal to the data value and standard deviation equal to the quoted error).
|
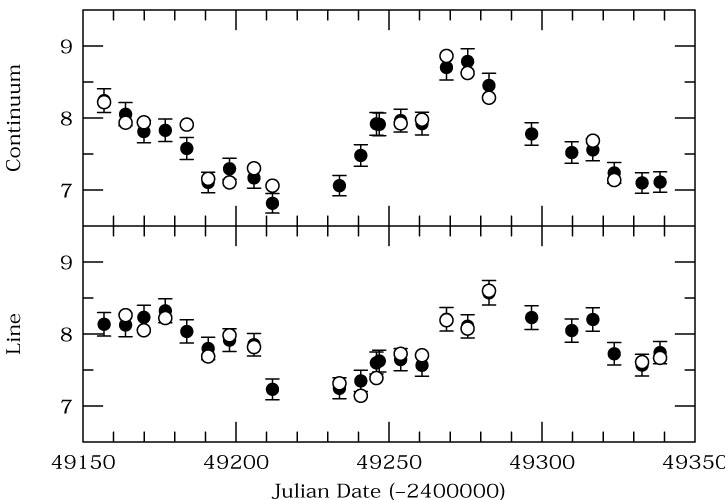
Figure 29. The filled circles show the
Mrk 335 light curve
from Fig. 23, but now
with error bars shown. The open circles show a
single FR/RSS Monte Carlo realization; the points are
selected from the total subset at random, and the
fluxes are adjusted as Gaussian deviates. Note that some
of the original data points are not seen because the
selected flux-adjusted points cover them.
The realization shown here gives
|
A single sample FR/RSS realization is shown schematically
in Fig. 29. For each such realization,
a cross-correlation is performed and the
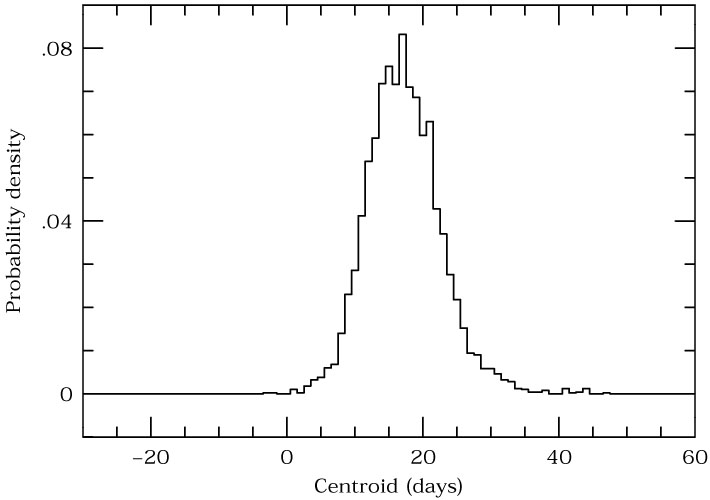
centroid is measured. A large number of similar realizations
will produce a "cross-correlation peak distribution"
(CCPD) 49 ,
as shown in Fig. 30. The CCPD
can be integrated to assign formal uncertainties (usually ±
1 ) to the value of
 cent
measured from the entire data set.
cent
measured from the entire data set.
|
Figure 30. Multiple Monte-Carlo
realizations such as
those in Fig. 29 are used to build up
a cross-correlation peak distribution (CCPD).
Relative to the measured CCF centroid
for the whole data set ( |