


With the background provided in the previous sections, we can discuss some of the more important observational results. We will begin with emission-line variability, since the results obtained thus far have been relatively less ambiguous than the results on interband continuum variations.
5.1. Size of the Broad-Line Region
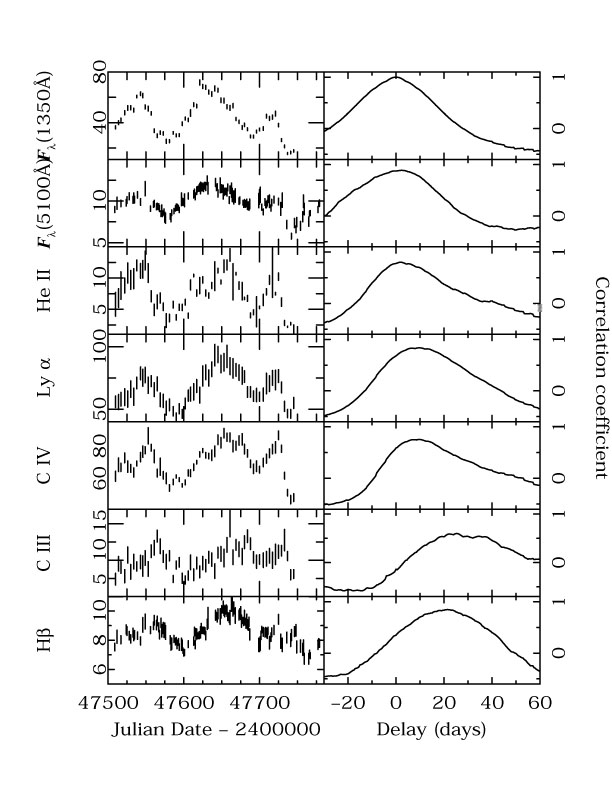
By the late 1980s, the potential power of reverberation mapping was widely understood, but the high-intensity monitoring programs required to extract this information had not been carried out, mainly on account of sociological barriers: the sampling requirements, in terms of time criticality and number of observations, were far in excess of anything that had been done in the past on oversubscribed shared facilities. In late 1987, a large informal consortium known as the International AGN Watch (a) was formed in an attempt to obtain sufficient observing time with IUE and various ground-based observatories to measure emission-line lags for the Seyfert 1 galaxy NGC 5548, even at that time one of the best-studied variable AGNs. This turned out to be an enormously successful project 14, 66, 67 that provided impetus for additional similar projects by the AGN Watch and other groups (see Peterson 62 for a review of the field in the wake of the first monitoring project on NGC 5548). Some of the light curves and CCFs from the original NGC 5548 project are shown in Fig. 31.
|
Figure 31. Light curves (left-hand column) and
CCFs (right-hand column) for NGC 5548, from the first International
AGN Watch monitoring project in 1988-89.
From the top, the light curves are
the UV continuum at 1350 Å,
the optical continuum at 5100 Å,
He II |
Since this initial successful campaign, a handful of AGNs have been well-monitored in the UV and optical (NGC 3783, NGC 4151, NGC 7469, 3C 390.3, Fairall 9, in addition to NGC 5548) and nearly three dozen Seyfert galaxies and low-luminosity quasars have been closely monitored in the optical 88, 36 . The most important general conclusions reached from these monitoring programs are:
Cross-correlation results
show that the size of the
H -emitting region scales
with average continuum luminosity as
36
-emitting region scales
with average continuum luminosity as
36
| (38) |
and that, in general, sizes derived from other lines usually scale as
r(He II, N V)  0.2
r(H) and
r(Ly
0.2
r(H) and
r(Ly , C IV})
0.5
r(H).
A slightly different version of the
BLR radius-luminosity relationship is shown in
Fig. 32, in which r
, C IV})
0.5
r(H).
A slightly different version of the
BLR radius-luminosity relationship is shown in
Fig. 32, in which r
 L0.6 ±
0.1.
This is close to the slope of the relationship predicted by
the most naive sort of scaling: since to lowest order AGN spectra
all look alike, the ionization parameters (Eq. (13))
and particle densities must be the same in all of them.
Thus, inverting Eq. (13), we predict that
L0.6 ±
0.1.
This is close to the slope of the relationship predicted by
the most naive sort of scaling: since to lowest order AGN spectra
all look alike, the ionization parameters (Eq. (13))
and particle densities must be the same in all of them.
Thus, inverting Eq. (13), we predict that
| (39) |
where in the last step we have also assumed that the shape of the ionizing continuum is not a function of luminosity. Despite these gross assumptions, the agreement with the data is not bad, although the large scatter alone tells us that this is not the whole story.

|
Figure 32. The BLR radius, as measured by
the H |
a More information about the International AGN Watch and all papers and data obtained are available on the AGN Watch website at http://www.astronomy.ohio-state.edu/~agnwatch/. Back.
 1640,
Ly
1640,
Ly