


5.2. AGN Black-Hole Masses
Reverberation mapping is one method of measuring AGN central masses via the virial relationship

| (40) |
where f is a dimensionless factor of order unity that
depends on the geometry and kinematics of the BLR,
 is the emission-line
velocity dispersion,
and r is the size of the emitting region.
Measurement of the emission-line time lags
provides the ingredient that has been missing since
the first attempts to understand the basic physics of
AGNs 95.
Relative to other dynamical
estimators, advantage of using the BLR to
provide an estimate of the mass of the central source
is that it is located very close to the central
source (within ~ 103 Rgrav), leaving little
doubt that the central mass is in fact a black hole. On
the other hand, the kinematics of the BLR are not yet
understood (see below), and non-gravitational forces
might have a strong effect on gas motions.
For the virial method to be applicable,
the BLR kinematics must be dominated by gravity.
Even without understanding the detailed geometry
and kinematics of the BLR, we can test the virial
hypothesis by comparing lags and line widths
measured in a single AGN:
all lines must give the same virial mass, even though
not all the line-emitting material needs to have
common kinematics. The three AGNs for which this
can be easily tested are shown in Fig. 33.
is the emission-line
velocity dispersion,
and r is the size of the emitting region.
Measurement of the emission-line time lags
provides the ingredient that has been missing since
the first attempts to understand the basic physics of
AGNs 95.
Relative to other dynamical
estimators, advantage of using the BLR to
provide an estimate of the mass of the central source
is that it is located very close to the central
source (within ~ 103 Rgrav), leaving little
doubt that the central mass is in fact a black hole. On
the other hand, the kinematics of the BLR are not yet
understood (see below), and non-gravitational forces
might have a strong effect on gas motions.
For the virial method to be applicable,
the BLR kinematics must be dominated by gravity.
Even without understanding the detailed geometry
and kinematics of the BLR, we can test the virial
hypothesis by comparing lags and line widths
measured in a single AGN:
all lines must give the same virial mass, even though
not all the line-emitting material needs to have
common kinematics. The three AGNs for which this
can be easily tested are shown in Fig. 33.
|
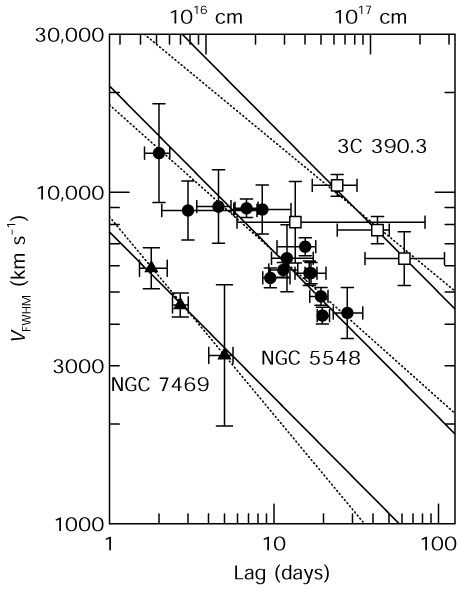
Figure 33. Line width in the
rms spectrum plotted as a function of the distance from the central source
(upper horizontal axis) as measured by the emission-line lag
(lower horizontal axis) for various broad emission lines in
NGC 7469, NGC 5548, and 3C 390.3. The dashed lines are
best fits of each set of data to the relationship
log VFWHM = a + b log
c |
Even if this were not true for all lines, it may be
true for some lines, and
a given line must always yield the same mass. Only
in the case of NGC 5548 is there sufficient information
on the long-term behavior of a single line
(H )
for this test to be applied, and the data seem to
be consistent with the virial relationship
72.
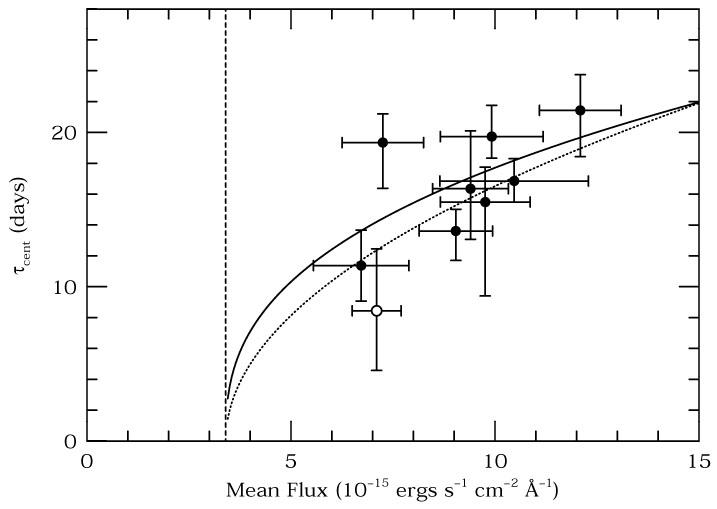
We expect, then, that
as the continuum brightens, the emission-line
lag increases (see Fig. 34),
and the emission-line becomes narrower.
This does seem to be the case.
)
for this test to be applied, and the data seem to
be consistent with the virial relationship
72.
We expect, then, that
as the continuum brightens, the emission-line
lag increases (see Fig. 34),
and the emission-line becomes narrower.
This does seem to be the case.
|
Figure 34. The
H |
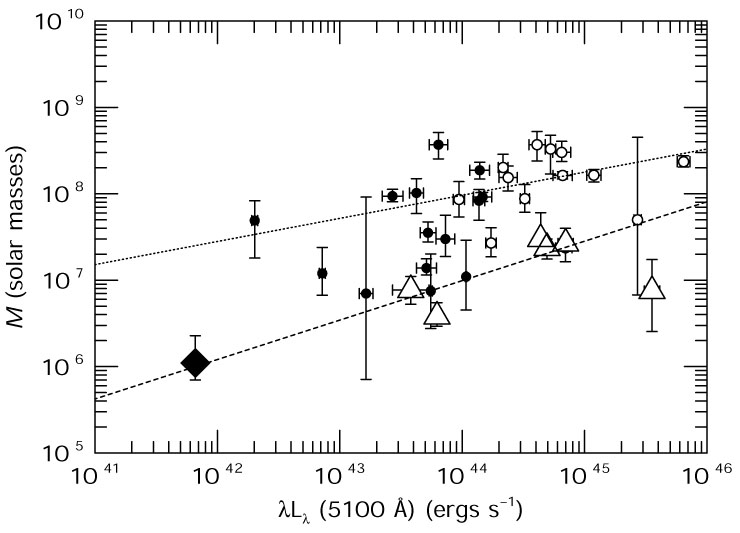
Virial masses based on H line
reverberation
as a function of optical luminosity are shown
in Fig. 35. There is considerable
scatter in the relationship, but it is nevertheless
clear that higher-mass black holes are found in
higher-luminosity AGNs. Some of the scatter in
this relationship may be attributable to differences
in accretion rate or radiative efficiency: the
lower end of the envelope, for example, seems to
be dominated by narrow-line Seyfert 1 galaxies,
which are thought to have relatively high accretion
rates (and thus luminosities) for their mass.
Additional factors, such as inclination of the system,
may also contribute to the scatter. But we are,
finally, beginning to see the first indications
of a mass-luminosity relationship for AGNs.
|
Figure 35. The central mass of AGNs, as
measured from H |
 .
The solid line shows the best fit to each set of data for fixed
b = -1/2, yielding virial masses of
8.4 × 10⁶
M
.
The solid line shows the best fit to each set of data for fixed
b = -1/2, yielding virial masses of
8.4 × 10⁶
M ,
5.9 × 10⁷
M
,
5.9 × 10⁷
M F0.4 ±
0.2, and
the dotted line shows the best fit to the naive theoretical
prediction
F0.4 ±
0.2, and
the dotted line shows the best fit to the naive theoretical
prediction