


6.1. Exploring the phase diagram
We have at our disposal three possible paths to explore the areas of phase transition: the path of the Big-Bang, the path of collapsing stars and the path of nuclear reactions in laboratory.
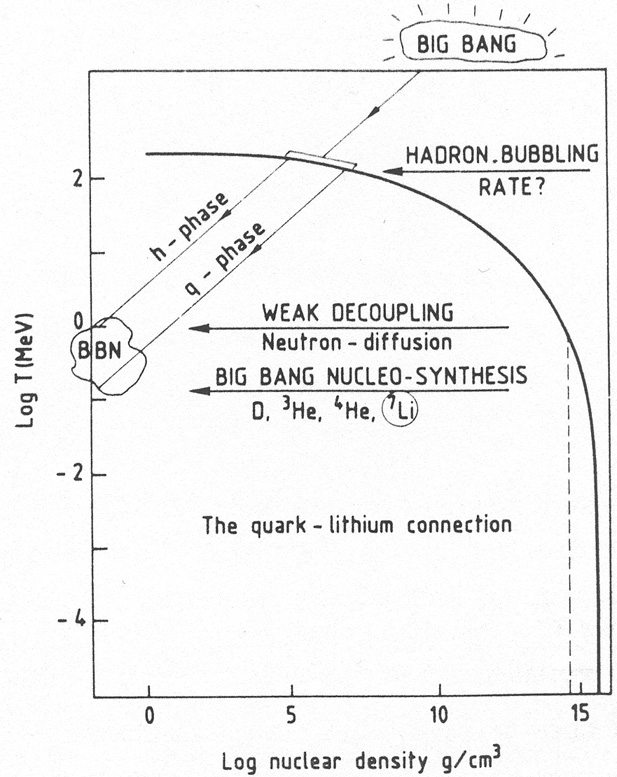
The first one was run some fifteen billion years ago. It started way up in the right-hand corner of the diagram and went down toward the left (fig 6). It crossed the border at a nucleonic density of approximately 106 g/cm3, temperature around 250 MeV, when the universe was a few microseconds old. It then entered an area which is called the mesonic area on the left part of the diagram (since it contains much more mesons than nucleons).
|
Figure 6. The path of the cooling cosmic matter across the diagram of the quark-hadron states. |
Recent studies have shown that this crossing may have left its imprint on the abundances of the light elements observed on the surfaces of very old stars.
Indeed it appears that the transition may have separated the cosmic fluid into regions of low densities mixed with regions of higher densities. We do not know exactly the dimensions of these regions. The upper limit is given by the horizon size at the moment of the transition: about 10 Km in radius, corresponding to a mass of 1025 g (the mass of the moon). The primordial nucleosynthesis yields, occuring a few minutes later, could have been influenced by the existence of such a density distribution.
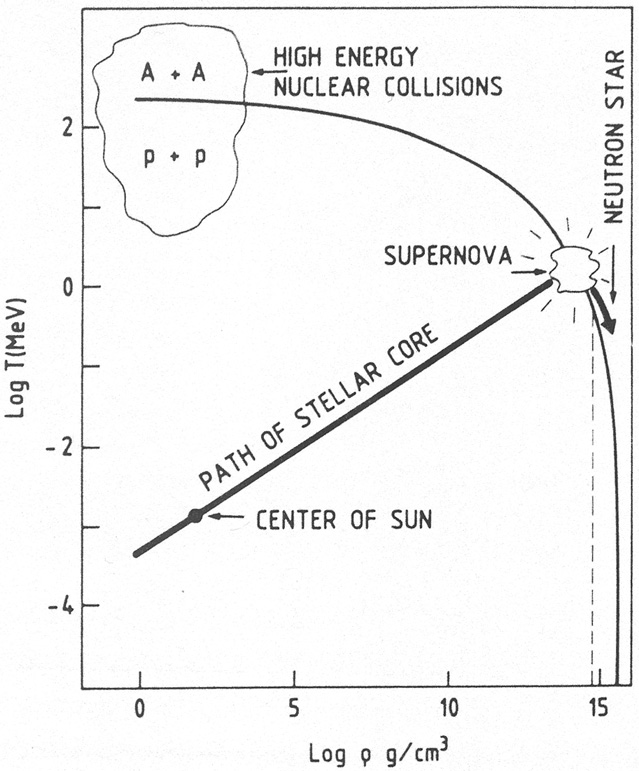
The second path through the border is followed at the end of the life of massive stars. For stars with masses larger than the Chandrasekhar mass (1.4 solar mass), the degenerate electron pressure is unable to prevent the collapse following the exhaustion of the nuclear sources of energy. The central core climbs up toward the right of the diagram (nucleonic area). It crosses the transition line at roughly nuclear densities and temperature around 10 MeV (fig 7). This scenario has been beautifully confirmed by the february 1987 supernova in the Large Magellanic Cloud. The neutrino flash received at that moment can be considered as strong evidence for the crossing of the border. More information is expected from the cooling rate of the neutron star through observation of its isothermal X ray component.
|
Figure 7. The path of a collapsing stellar core across the Q-H Phase transition. Also shown the regions reached in GeV proton-proton and nuclei-nuclei collisions. |
Head-on nuclear colliding beams are the third way across the border. The colliding nucleons create a hot mesonic spot. To reach the border, one must deposit energy densities larger than a few GeV per fermi cube. Proton-proton collisions fall short of this objective. Because of the relativistic space contraction effect, incoming nuclei are contracted along the direction of motion, an effect which boosts the collision energy density above the border. Several GeV per fm3 are generated. Since the incoming nucleons rapidly escape the hot spot, the residual matter is a low density glue. Experiments are being done at CERN and at Brookhaven. They should allow an exploration of the corresponding part of the diagram (recent experiments have given indications that the glue has been formed during nuclear collisions).