Copyright © 1988 by Annual Reviews. All rights reserved
| Annu. Rev. Astron. Astrophys. 1988. 26:
245-294 Copyright © 1988 by Annual Reviews. All rights reserved |


2.1. Results From Galaxy Reashift Surveys
Previous reviews of this topic include those by Chincarini (38, 39), Doroshkevich et al. (62), Geller et al. (79a), Oemler (126b), Schwarzschild (175), Shandarin & Zel'dovich (176), and Ze1'dovich et al. (216). The review by Geller et al. (79a) contains information in addition to that below.
2.1.1. IDENTIFICATION AND STRUCTURE OF VOIDS
The early Coma / A1367 redshift survey
(81)
covers 260 sq deg. The sample of galaxies is nearly complete to
mp  15
corresponding to an effective Doppler velocity limit
Vlim ~ 8000 km
s-1. The early Hercules/A2199 redshift survey
(49)
covers a 332 sq deg region. The sample of
galaxies was drawn randomly in location and apparent magnitude from a
population complete to
mp
15.5 (Vlim ~ 11,000 km s-1). Both surveys
revealed a prominent void with a characteristic length > 40 Mpc. These
voids were detectable because they are small compared with the effective
depth of each survey (~ 160-220 Mpc).
15
corresponding to an effective Doppler velocity limit
Vlim ~ 8000 km
s-1. The early Hercules/A2199 redshift survey
(49)
covers a 332 sq deg region. The sample of
galaxies was drawn randomly in location and apparent magnitude from a
population complete to
mp
15.5 (Vlim ~ 11,000 km s-1). Both surveys
revealed a prominent void with a characteristic length > 40 Mpc. These
voids were detectable because they are small compared with the effective
depth of each survey (~ 160-220 Mpc).
Although redshifts have been measured for the galaxies in the all-sky
Shapley-Ames survey
(59b,
167a)
complete to mp
13 (i.e.
Vlim ~ 3000 km
s-1), the effective depth (~ 60 Mpc) and the location of our
Local Group
of galaxies within the Local Supercluster precluded the discovery from
these data of any obvious void with characteristic length > 40 Mpc.
Because of these same survey properties, however, the data on
Shapley-Ames galaxies have contributed greatly toward increasing our
knowledge of the structure of the Local Supercluster, and Tully
(202,
203)
[papers reviewed by Oort
(128),
pp. 380-384] finds that the great
majority of galaxies in the supercluster are located in nine "clouds,"
with most of the space between empty.
Although the redshift surveys covering small solid angles of the sky
led to pioneering discoveries of individual voids (e.g. Coma/A1367,
Hercules/A2199), redshift surveys covering large solid angles of the
sky are necessary to obtain statistical information on the locational
and physical properties of voids in general, as well as to obtain more
complete structural information about individual voids and their
contiguous shells. The data from the CfA redshift survey of the 2400
galaxies complete to mp = 14.5 with b >
40°,
 > 0° and
b < - 30°,
> - 2.°5 [where
b
is Galactic latitude and
is declination (epoch 1950)] have been published
(93a),
and initial results
(59c)
have been reviewed by Oort
(128,
pp. 385-94). Significant progress has been made toward the
completion of a corresponding redshift survey of the > 12,000 galaxies
in the same solid angle of the sky with
mp
> 0° and
b < - 30°,
> - 2.°5 [where
b
is Galactic latitude and
is declination (epoch 1950)] have been published
(93a),
and initial results
(59c)
have been reviewed by Oort
(128,
pp. 385-94). Significant progress has been made toward the
completion of a corresponding redshift survey of the > 12,000 galaxies
in the same solid angle of the sky with
mp  15.5
(J. Huchra, preprint,
1987); for example, initial results from part of this survey (discussed
below) are beautifully illustrated by de Lapparent et al.
(56) as
reproduced in Figure 4. Da Costa et al.
(51b)
have carried out a
complementary redshift survey of 1963 galaxies that is 84% complete
(redshift measurements obtained for 1657 galaxies) to an angular
diameter limit of 1 arcmin (very roughly
mp ~ 15) in 1.75 ster of the southern sky
(
- 17.°5,
b - 30°).
15.5
(J. Huchra, preprint,
1987); for example, initial results from part of this survey (discussed
below) are beautifully illustrated by de Lapparent et al.
(56) as
reproduced in Figure 4. Da Costa et al.
(51b)
have carried out a
complementary redshift survey of 1963 galaxies that is 84% complete
(redshift measurements obtained for 1657 galaxies) to an angular
diameter limit of 1 arcmin (very roughly
mp ~ 15) in 1.75 ster of the southern sky
(
- 17.°5,
b - 30°).
The early studies described in Section 1.3
established that the void
in the foreground of the Coma/A1367 supercluster spans at least from
the Coma cluster (A1656)
( =
12h57m ,
= 28°15', V
= 6955 km s-1) to
A1367
( =
11h42m,
= 20°7', V
= 6446 km s-1)and that the void in the
fore- ground of the Hercules/A2199 supercluster spans at least from
the Hercules cluster (A2151)
( =
16h3m,
= 17°53', V
= 11, 122 km s-1) to A2199
( =
16h27m,
=
39°28', V = 9264 km s-1), where the
equatorial coordinates are for epoch 1950 and the Doppler velocity is
relative to the centroid of the Local Group. Neta Bahcall (private
communication, 1986) pointed out that these two voids are in fact
segments of the two largest voids in Figure 4a from de Lapparent et
al. (56),
which I call the Coma /A1367 void (or "Coma void," for short)
and the Hercules/A2199 void (or "Hercules void," for short).
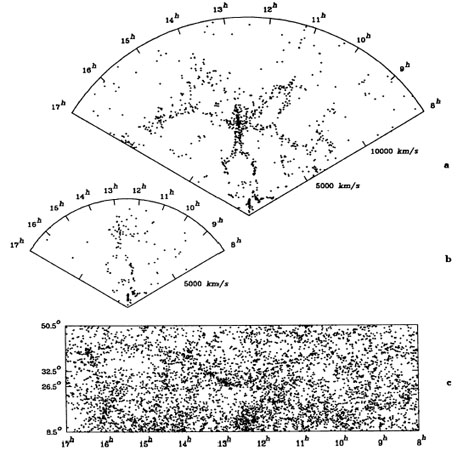
Figure 4a
is a plot of Doppler velocity vs. right ascension (over a range of 9
h) for a nearly complete sample of galaxies with
mp 15.5
in a 6°
strip of declination that contains the Coma cluster.
Figure 4b is the
same as Figure 4a but with
mp 14.5.
Figure 4(a,b,c) (which
supersedes Figures 11 and 12 (pp. 390-91) of Oort
(128)]
provides a
clear demonstration of the detailed new structural information on
voids that is obtainable from the CfA redshift survey to an apparent
magnitude limit of mp = 15.5 and demonstrates that the
Coma and
Hercules voids are much more well defined from data with a survey
limit of mp = 15.5 (Figure 4a)
than from data with a survey limit of
mp = 14.5 (Figure 4b); this
unequivocally demonstrates the physical
reality of these voids with their contiguous shells - i.e. with
improved statistics, these structures have risen significantly farther
above the noise. (The reader may wish to assess quantitatively whether
the statistical confidence level of this statement is actually
tantamount to certainty; some considerations relevant to this problem
are discussed in (57)
and Section 3.1.]. De Lapparent et al.
(56,
57)
note that the Coma and Hercules voids each have a characteristic
length ~ 50 Mpc, and their contiguous shells are sharply
structured. Part of the Local Supercluster with its effective Doppler
velocity ~ 1000 km s-1 that is evident in
Figure 2 is also
apparent in
Figure 4a as part of the contiguous shell of the
Coma void. Because
the angular extent of the Coma and Hercules voids are each > 6°, de
Lapparent et al., in order to obtain additional information on their
structure, examined a map of the surface distribution of the galaxies
with
mp 15.5 in a
strip with the same center and range of right
ascension but with a width of 400 (Figure 4c).
De Lapparent et a1. suggest that the cellular pattern evident in
Figure 4a and the
smoothness of Figure 4c are simply understood if
the galaxies are
distributed on the surfaces of shells tightly packed next to each
other. (It is remarkable that 10 yr earlier Einasto and coworkers were
able to reach very similar conclusions from examination of the
heterogeneous data available at that time (cf.
99a),
albeit with some theoretical guidance by Zel'dovich et al. (cf.
215b,
217).]
=
12h57m ,
= 28°15', V
= 6955 km s-1) to
A1367
( =
11h42m,
= 20°7', V
= 6446 km s-1)and that the void in the
fore- ground of the Hercules/A2199 supercluster spans at least from
the Hercules cluster (A2151)
( =
16h3m,
= 17°53', V
= 11, 122 km s-1) to A2199
( =
16h27m,
=
39°28', V = 9264 km s-1), where the
equatorial coordinates are for epoch 1950 and the Doppler velocity is
relative to the centroid of the Local Group. Neta Bahcall (private
communication, 1986) pointed out that these two voids are in fact
segments of the two largest voids in Figure 4a from de Lapparent et
al. (56),
which I call the Coma /A1367 void (or "Coma void," for short)
and the Hercules/A2199 void (or "Hercules void," for short).
Figure 4a
is a plot of Doppler velocity vs. right ascension (over a range of 9
h) for a nearly complete sample of galaxies with
mp 15.5
in a 6°
strip of declination that contains the Coma cluster.
Figure 4b is the
same as Figure 4a but with
mp 14.5.
Figure 4(a,b,c) (which
supersedes Figures 11 and 12 (pp. 390-91) of Oort
(128)]
provides a
clear demonstration of the detailed new structural information on
voids that is obtainable from the CfA redshift survey to an apparent
magnitude limit of mp = 15.5 and demonstrates that the
Coma and
Hercules voids are much more well defined from data with a survey
limit of mp = 15.5 (Figure 4a)
than from data with a survey limit of
mp = 14.5 (Figure 4b); this
unequivocally demonstrates the physical
reality of these voids with their contiguous shells - i.e. with
improved statistics, these structures have risen significantly farther
above the noise. (The reader may wish to assess quantitatively whether
the statistical confidence level of this statement is actually
tantamount to certainty; some considerations relevant to this problem
are discussed in (57)
and Section 3.1.]. De Lapparent et al.
(56,
57)
note that the Coma and Hercules voids each have a characteristic
length ~ 50 Mpc, and their contiguous shells are sharply
structured. Part of the Local Supercluster with its effective Doppler
velocity ~ 1000 km s-1 that is evident in
Figure 2 is also
apparent in
Figure 4a as part of the contiguous shell of the
Coma void. Because
the angular extent of the Coma and Hercules voids are each > 6°, de
Lapparent et al., in order to obtain additional information on their
structure, examined a map of the surface distribution of the galaxies
with
mp 15.5 in a
strip with the same center and range of right
ascension but with a width of 400 (Figure 4c).
De Lapparent et a1. suggest that the cellular pattern evident in
Figure 4a and the
smoothness of Figure 4c are simply understood if
the galaxies are
distributed on the surfaces of shells tightly packed next to each
other. (It is remarkable that 10 yr earlier Einasto and coworkers were
able to reach very similar conclusions from examination of the
heterogeneous data available at that time (cf.
99a),
albeit with some theoretical guidance by Zel'dovich et al. (cf.
215b,
217).]
|
Figure 4. (a) Map of the Doppler
velocity vs. right ascension in the
decl 26.°5 |
The de Lapparent et al. study (56, 57) underlines the potential value for future work of (a) the entire CfA redshift survey complete to mp = 15.5 over a large fraction of the sky and (b) the completed subset of data covering the 6° strip that was analyzed in (56, 57). [This data is being prepared for publication and will also be made available on magnetic tape for distribution by the Astronomical Data Center at the Goddard Space Flight Center (M. Geller, private communication, 1987)]. With (a), one should be able to establish with certainty whether the galaxy distribution is in fact cellular, filamentary, some combination of both, or something else. With (b), one could, e.g., subtract out the distorting effect of virial motions of galaxies, especially from the Coma cluster, to establish whether the Coma and Hercules voids are independent entities, or possibly, e.g., two parts of one void or the network of voids in the sponge-like model of Gott and coworkers (cf. 80). And one could examine the declination of each galaxy with the same Doppler velocity and right ascension as a point in the interior of the Coma or Hercules void to determine whether the galaxy is nevertheless outside or actually within the void.
In 1978, Kirshner et al.
(103)
set out on a pioneering study of the
deep-space distribution of galaxies. They obtained redshifts and
direct photometric magnitudes for most of the galaxies (164 of 184) to
a completion limit of mp
15.5
(Vlim ~ 11,000 km s-1) in eight
representative square fields
4° on a side, four
in the northern and
four in the southern Galactic hemisphere. They planned to redetermine
the galaxy luminosity function and, stimulated by the recent progress
in our understanding of the distribution of galaxies in space derived
from studies of the two-point correlation function and the early
redshift surveys [e.g.
(81)
and other work described in Section 1.3],
to redetermine this space distribution. Their data immediately
suggested that the galaxy distribution might be significantly smoother
in the south Galactic polar cap (b
- 40°) than in the north
Galactic polar cap (b  40°), and the correlation function that they derived
was inconsistent with results from previous studies of the surface
distribution of large samples of galaxies
(104).
This was sufficient to motivate Kirshner et al.
(105)
to obtain similar data for six representative fields
1.4° on a side,
three in the northern and
three in the southern Galactic hemisphere, located near six of the
fields in the previous survey but penetrating to the pioneering
apparent magnitude limit mp ~ 17.5 (corresponding to
Vlim ~ 30,000 km
s-1
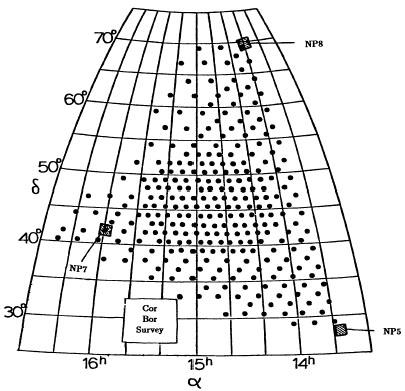
0.1c). The three northern fields are located approximately 350
equidistant apart on the sky near the periphery of the constellation
Boötes, as illustrated in Figure 5.
40°), and the correlation function that they derived
was inconsistent with results from previous studies of the surface
distribution of large samples of galaxies
(104).
This was sufficient to motivate Kirshner et al.
(105)
to obtain similar data for six representative fields
1.4° on a side,
three in the northern and
three in the southern Galactic hemisphere, located near six of the
fields in the previous survey but penetrating to the pioneering
apparent magnitude limit mp ~ 17.5 (corresponding to
Vlim ~ 30,000 km
s-1
0.1c). The three northern fields are located approximately 350
equidistant apart on the sky near the periphery of the constellation
Boötes, as illustrated in Figure 5.
|
Figure 5. Location on the sky of (a) the original Boötes survey fields of Kirshner et al. (105). (b) the 283 small square survey fields (represented by small circles) in the recent, more detailed survey of Boötes (106), and (c) the Corona Borealis survey field of Postman et al. (148a). Reproduced from (148a) by permission of M. Postman. |
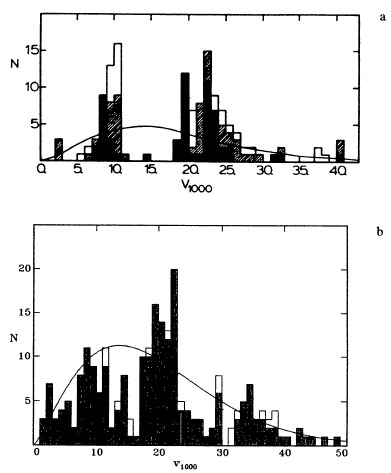
Kirshner et al. found that the histogram of observed redshifts for 133
galaxies in these three northern fields (90% complete redshift survey)
is nearly empty in the interval between 12,000 km s-1 and
18,000 km
s-1 (Figure 6a); this surprising
result led them to make the plausible
inference that the region within Boötes may contain a very large void
(characteristic length ~ 120 Mpc)
(105).
To test this inference, they
decided to survey the entire Boötes region in a representative manner
to an apparent magnitude limit
mp ~ 17.5, measuring both redshifts and
magnitudes for a large homogeneous sample of galaxies. This was
accomplished by first selecting 283 small square survey areas 15
arcmin on a side, covering 2% of the sky area of the Boötes region,
and distributed as shown in Figure 5. Then for
each of these fields
they visually identified galaxies and ranked them according to
apparent luminosity. Apparent magnitudes of the galaxies were then
estimated from these ranks (typically, for a given galaxy, the adopted
rank is a logarithmic average of four values, one measurement per
observer) calibrated by photoelectric magnitudes measured for 59 of
the galaxies. Finally, redshifts were measured for 231 galaxies in
239 of the 283 survey fields (90% complete redshift survey to
mp ~
17.5 in the subset of 239 fields). The resulting histogram is shown in
Figure 6b. The region between 12,000 km
s-1 and 18,000 km s-1, while
not empty, remains significantly deficient in galaxies relative to the
number expected if the galaxies were homogeneously distributed in
space. Moreover, the largest empty sphere that Kirshner et al. could
place in the effective volume occupied by their sample has a radius 60 Mpc and is centered at
=
14h50m,
= 46°, and Doppler
velocity V
= 15,500 km s-1. Kirshner et al. point out that, curiously,
this empty
sphere does not extend as far as the three survey fields (NP 5, NP 7,
or NP 8) on the basis of which the original discovery of the Boötes
void was made. Kirshner et al. suggest that the most plausible
explanation is that the void, although apparently sharply bounded in
front and back, is surrounded in other directions by a larger region
of low density that fields NP 5, NP 7, and NP 8 happen to penetrate at
particularly empty spots
(106).
A direct test of this hypothesis
requires an even more extensive redshift survey. [Additional review
of work on the Boötes void is provided by Oort
(128,
p. 417) and Oemler
(126b).]
|
Figure 6. (a) Histogram of Doppler
velocities in 1000 km s-1 intervals for a
sample of 133 galaxies ~ 90% complete to
mp |
The catalog by Zwicky et al.
(220),
constructed primarily by visual
techniques, provides coordinates and magnitudes for the galaxies north
of declination
- 3° complete to a
limiting apparent magnitude
mp
15.5. This information is prerequisite for the CfA redshift surveys to
(a)
mp 14.5 and
(b) mp
15.5. To construct deeper redshift surveys,
and to study in more detail the structure of the Boötes void, it seems
advisable to first create an analog of the Zwicky et al.
(220)
catalog, but to a limiting apparent magnitude of, say,
mp = 17.5 and
by vastly more automated procedures. This goal is now within practical
reach through the application of an automated plate scanner. One that
is extremely fast, accurate, and in refinement-developmental stages is
the automated plate scanner (APS) at the University of Minnesota;
astronomers there are planning to use this instrument to create useful
primary data bases of this type. The APS was initially built under the
direction of W.J. Luyten specifically to carry out a stellar proper
motion survey, but it has been refurbished with new detection
electronics and data-taking and processing equipment that make it a
practical instrument to apply to a plate copy of the Palomar
Observatory Sky Survey to construct an all-sky catalog of locations,
magnitudes, and other properties of galaxies nearly complete to
mp = 17.5
(61,
96).
The APS can automatically identify and measure all
objects with
mp 17.5
registered on a 14-inch × 14-inch plate of the
Palomar Observatory Sky Survey in a scan time of
2h45m
plus an equal
reduction time. Completely automatic discrimination between stars and
galaxies is achieved for most of the objects, and a semiautomated
procedure achieves excellent discrimination for nearly all of the
remaining objects. It appears that the APS system now provides a
state-of-the-art technique for constructing the next-generation galaxy
catalog of coordinates and apparent magnitudes, data that constitute a
crucial prerequisite for next-generation galaxy redshift surveys.
It should be recognized, however, that the advanced technology (e.g. laser-beam scanning, computer and supercomputer reduction methods) represented by APS cannot now make morphological classifications of galaxies (61), so visual inspection of galaxies on photographic plates is still needed to construct catalogs with extensive, detailed, and internally consistent morphological information on galaxies (59b, 123a, 167a, 188b).