Copyright © 1988 by Annual Reviews. All rights reserved
| Annu. Rev. Astron. Astrophys. 1988. 26:
245-294 Copyright © 1988 by Annual Reviews. All rights reserved |


1.3. A Hidden Paradigm
As noted above, early studies of the surface distribution of galaxies featured three different models: (a) superclustering of galaxies, (b) super-large rich clusters, and (c) groups and clusters drawn from a uniform general field. In order to discriminate between these models and to relate the data to predictions of physical models of the growth of structure in the Universe, Peebles and coworkers (69a, 142) extracted the amplitude and slope of the correlation function from large sets of data on the surface distribution of galaxies (cf. Section 3.1.2). They found that galaxies and systems of galaxies are correlated on all scales up to the noise limit of their analyses, between ~ 10 and 100 Mpc. The results are consistent with (a) and (b) but not with (c).
Nevertheless, model (c) remained popular. In 1975 Turner & Gott
(205)
analyzed the surface distribution of galaxies with apparent blue magnitude
mp  14 and
found that if the galaxies are separated into
two classes, A (associated) and S (single) (terminology by
(187)],
according to whether the nearest neighbor on the sky lies within or
beyond 45 arcmin, respectively, then the galaxies in set A (60% of the
total) display the correlation function found by Peebles and
coworkers, but the galaxies in set S (40% of the total) exhibit no
correlations among themselves and are identified as a homogeneous
(i.e. almost uniform) population of galaxies
(205).
However, in 1977, Soneira & Peebles
(187)
studied the problem more thoroughly and found
that (a) the galaxies in set S are in fact clustered among themselves
and with the galaxies in set A, (b) the S and A galaxies show strong
and similar correlations with fainter galaxies, (c) the large-scale
clustering of the galaxies in sets S and A are quite similar, and (d)
the observational data agree well with simulation data of a
hierarchical model of structures with no homogeneous field population;
Soneira & Peebles concluded that if a field component of galaxies does
exist, it accounts for substantially less than 18% of the galaxies in
a catalog selected by apparent magnitude. This result was confirmed in
a recent analysis by Vettolani et al.
(207b,
209) of the
three-dimensional distribution of galaxies with
mp 145
covering a
large solid angle in the sky, which failed to detect a nonclustered
homogeneous background of galaxies.
14 and
found that if the galaxies are separated into
two classes, A (associated) and S (single) (terminology by
(187)],
according to whether the nearest neighbor on the sky lies within or
beyond 45 arcmin, respectively, then the galaxies in set A (60% of the
total) display the correlation function found by Peebles and
coworkers, but the galaxies in set S (40% of the total) exhibit no
correlations among themselves and are identified as a homogeneous
(i.e. almost uniform) population of galaxies
(205).
However, in 1977, Soneira & Peebles
(187)
studied the problem more thoroughly and found
that (a) the galaxies in set S are in fact clustered among themselves
and with the galaxies in set A, (b) the S and A galaxies show strong
and similar correlations with fainter galaxies, (c) the large-scale
clustering of the galaxies in sets S and A are quite similar, and (d)
the observational data agree well with simulation data of a
hierarchical model of structures with no homogeneous field population;
Soneira & Peebles concluded that if a field component of galaxies does
exist, it accounts for substantially less than 18% of the galaxies in
a catalog selected by apparent magnitude. This result was confirmed in
a recent analysis by Vettolani et al.
(207b,
209) of the
three-dimensional distribution of galaxies with
mp 145
covering a
large solid angle in the sky, which failed to detect a nonclustered
homogeneous background of galaxies.
In September 1975, a paper by Chincarini & Rood appeared in the
journal Nature that presented results of a nearly complete
homogeneous survey of redshifts of galaxies with
mp 15.0
in a 30 sq deg region
west of the center of the Coma cluster
(45).
A graph was published
that suggested to the authors that galaxies are associated with the
Coma cluster to a radial distance of at least 32 Mpc
(Figure 2).
This extended the directly measured radial extent of the associated
galaxies by a factor of 4 beyond that evident in the tantalizing
original plot by Mayall
(116,
Figure 2) (depicted in Figure 1) and an
updated version discussed with model extrapolations
(161, Figure
1). This result suggested to the authors that the Coma cluster (radial
extent  32 Mpc) is larger
than the Local Supercluster. They also
mentioned that such a large radius implies that gravitational mixing
between the inner and outer regions is not well advanced, so that the
properties of the outer regions reflect to a significant extent the
initial conditions of the cluster formation period. J.H. Oort (private
communication. 1975) pointed out that our observed and deduced
properties of the structure more consistently indicate that it is a
supercluster containing the Coma cluster. And P.J.E. Peebles (private
communication, 1975) noted the consistency between (i) our direct
detection of large-scale correlations to radii > 30 Mpc among the
galaxies in a three-dimensional sample of small solid angle, and (ii)
similar recent results from analyses of correlation functions derived
from the surface distribution of galaxies over large solid angles of
the sky. The evidence was fast accumulating that the Universe conforms
to model (a), the superclustering of galaxies.
32 Mpc) is larger
than the Local Supercluster. They also
mentioned that such a large radius implies that gravitational mixing
between the inner and outer regions is not well advanced, so that the
properties of the outer regions reflect to a significant extent the
initial conditions of the cluster formation period. J.H. Oort (private
communication. 1975) pointed out that our observed and deduced
properties of the structure more consistently indicate that it is a
supercluster containing the Coma cluster. And P.J.E. Peebles (private
communication, 1975) noted the consistency between (i) our direct
detection of large-scale correlations to radii > 30 Mpc among the
galaxies in a three-dimensional sample of small solid angle, and (ii)
similar recent results from analyses of correlation functions derived
from the surface distribution of galaxies over large solid angles of
the sky. The evidence was fast accumulating that the Universe conforms
to model (a), the superclustering of galaxies.

|
Figure 2. Doppler velocity vs. observed radial distance from the center of the Coma cluster for the galaxies in the sample by Chincarini & Rood (45). The Coma cluster is part of a structure that extends to > 30 Mpc (100 million lt-yr). Note the large empty region in the foreground. Adapted from Figure 1 of (45). |
The stream of research that led to (45) (a) began in 1960 with Mayall's far-reaching paper on electronic photographic spectroscopy (116); (b) continued in September 1969 with a remark by T.W. Noonan (private communication, 1969) that the rich cluster A1367 may be associated with the Coma cluster because they have the same Abell richness and distance class and are only 20o apart on the sky: (c) continued in the late 1960s with the application of the Carnegie image-tube spectrograph on the 2.1-m telescope at Kitt Peak National Observatory to complete the redshift survey begun by Mayall, and with the application of the data to a comprehensive study published in 1972 on the structure of the Coma cluster (161); and (d) continued in the late 1960s and early 1970s with the determination of large numbers of redshifts of galaxies in clusters at a rate of > 10 per night of observation (a realization of Mayall's vision) (43a), and with the publication in 1912 of initial results from the redshift survey for the 30 sq deg region west of the Coma cluster [selected to simultaneously (i) extend Figure 1 to larger radial distances, (ii) make significant, albeit leisurely headway toward A1367, and (iii) decipher the nature of the survey field that Zwicky et al. (220) identified as Cluster No. 16 in Field No. 158] (44). The data and analytical techniques that provided the bases for the discussion in (45) were published more fully in November 1975 (153a) and May 1976 [(46), but with most of the new data mistakenly placed by the printers in (95)]. This work, in major respects, was superseded in 1978 with the publication by Gregory & Thompson (81) of results obtained from their redshift survey of galaxies in a region that spanned completely from the Coma cluster to A1367. It independently occurred to Gregory & Thompson (from evidence similar to that which led Noonan to a similar insight at least six years earlier) that the Coma cluster and A1367 are likely to be part of a common physical entity. Gregory & Thompson constructed their observing program to test this hypothesis, obtained the necessary new data in one observing run, and then wrote the benchmark paper that clearly presented the observational evidence demonstrating the existence of (a) the Coma / A1367 supercluster with a characteristic length > 40 Mpc and (b) a foreground region apparently devoid of galaxies with a characteristic length > 40 Mpc (81). The discussion and Figure 2 of (81) [= Figure 12 (p. 391) of Oort (128)] provided a significant catalyst for motivating extragalactic astronomers into action. Observational workers began a dedicated and systematic attack on the problem of determining the direct three-dimensional distribution of galaxies by applying efficient and accurate analytical techniques to the data of modern detector and computer technology (Section 2.1). And theoretical workers began to use results from the new data to constrain parameters in old, revised, and new models invented for the purpose of explaining the astrophysical origin and evolution of large-scale structure in the Universe.
During the early 1970s, Chincarini and I were accumulating new galaxy redshifts to study the structure of a Zwicky cluster (220) in the constellation Hercules, which contains three Abell clusters (A2147, A2151, and A2152) (4). In 1974, while examining the data accumulated up to that point. Chincarini noticed that the redshifts are segregated into a small number of groups. Because this also occurs in all of the relatively homogeneous samples of redshifts that we had obtained for other parts of the sky, he hypothesized that galaxies occur in groups (e.g. clusters and superclusters), and that the apparent field of galaxies in a surface distribution is the result of a superposition of such groups. [Chincarini & Martins (43), Focardi et al. (73)].
In 1976, efforts were intensified to complete the redshift survey
for a homogeneous sample of galaxies in the constellation Hercules and
to add a redshift survey for a homogeneous sample of galaxies in a
contiguous region that extends from Hercules to the cD cluster A2199.
Results were published in 1979-81
(37,
49,
191,
191a,
192). The
distribution of points in plots of redshift vs. declination for these
galaxies (Figures 17-19 (pp. 401-2) of Oort
(128)]
led to (a) the
definitive demonstration of the reality of a supercluster that
connects the triplet of Abell clusters in Hercules
(A2147, A2151,
A2152) to A2199 [Abell had suggested the existence of this
supercluster as early as 1961
(5)],
and (b) the discovery of a large
void in its foreground, both with a characteristic length > 50
Mpc. The stream of research that led to the discoveries of
superclusters and voids from early redshift surveys of the Coma and
Hercules regions was described in 1980 by Chincarini & Rood
(48) and
in 1982 by Gregory & Thompson
(82).
Perhaps the first use of the term
"void" in the extragalactic literature occurred in
(48) and the
Hercules papers
(191,
192)
following a suggestion in 1979 by an
individual at the University of Oklahoma, identity unknown. "Void" is
in fact a natural contraction of "region devoid of galaxies," which
had been used earlier (e.g.
81,
196).
A summary of the discoveries
from the early redshift surveys and a pioneering discussion of the
statistics and characteristics of superclusters, their formation, and
a possible relation of superclusters and voids to
L absorption lines
in quasars were presented in 1981 by Oort
(127).
absorption lines
in quasars were presented in 1981 by Oort
(127).
The superclustering of galaxies (model (a)] and the presence of voids are now accepted as fact, a paradigm among workers on large-scale structure. I have suggested that 1975 was a pivotal year in the birth of this paradigm, which to a large extent replaced Hubble's model (c); it is fascinating to identify elements of model (c) in the analyses and discussions within papers written around that time (e.g. 53, 126a, 154, 165, 166). The latter two papers, published in 1976 by Rubin et al., are especially interesting. For a homogeneous sample of Sc I, II galaxies, (a) the distances derived by assuming that the galaxies are "standard candles" (each with the same absolute blue luminosity) and (b) the distances inferred from their redshifts through the Hubble relation were found to display slightly different systematic variations across the sky consistent with a 454 ± 125 km s-1 motion of the Local Group relative to the reference frame defined by the galaxies. The literature contains discussions of the influence on derived standard candle distances of systematic errors caused by, e.g., effects of super-clustering and Malmquist bias (cf. 70, 83, 164a, 210c), but a recent study that analyzes subsets of the Rubin et al. sample by correcting for systematic biases and applying independent distances derived from, e.g., red and infrared luminosities and absolute luminosities inferred from H I 21-cm velocity widths through the Tully-Fisher relation suggests that the effect represents real motion (50a).
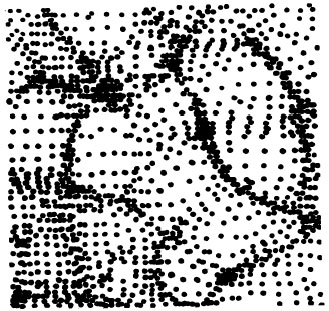
On September 12-16, 1977, IAU Symposium No. 79 was held in Tallinn, Estonia, USSR. There I learned that as early as 1970, Ya. B. Zel'dovich and coworkers were evolving theoretical models showing that interesting large-scale structure (e.g. Figure 3) was formed by nonlinear dissipative collapse of gaseous density perturbations, forming "pancakes," followed by condensation into galaxies (215, 215a, 215b, 217). In contrast, many cosmologists in the West assumed that galaxies formed initially by Jeans instabilities within random density perturbations that evolved into a hierarchy of larger structures that could be tracked by N-body computer experiments [cf. (2a, 187a, 205b) and Figure 26 (p. 424) of Oort (128)]. By analyzing the heterogeneous data in the literature, including the new homogeneous data from redshift surveys discussed above, Einasto and coworkers (e.g. 99a) found that the observed large-scale three-dimensional distribution of galaxies exhibits cellular structure with remarkable qualitative similarity to the model realizations of Zel'dovich et al., but not to results of random gravitational clustering. These suggestive general conclusions were consistent with the discoveries of superclusters and regions "devoid of galaxies" obtained from redshift surveys of homogeneous samples of galaxies in selected regions of the sky that were reported by observers from the US (191a, 196a).
|
Figure 3. A realization of large-scale structure that has evolved from initial gaseous density perturbations that undergo non-linear dissipative collapse. This figure, the result of calculations by Zeldovich & Novikov (217), was presented at IAU Symposium No. 79 held on September 12-16, 1977, in Tallinn, Estonia, USSR (215b). |
In 1981, Ikeuchi (98) and Ostriker & Cowie (133) suggested that cosmic explosions with an energy release ~ 1061 ergs originating from, e.g., quasars or young galaxy starburst events would create blast waves that might be influential in promoting, or amplifying, galaxy formation, and that might also produce large-scale structure by tending to create voids with outward-moving galaxies on their contiguous shells (130). In summary, by 1981 the astrophysical inventory of known mechanisms that tend to generate large-scale structure had grown to include (a) gravitational mechanics of galaxies, (b) dissipative gravitational collapse of gaseous density perturbations, and (c) blast waves from cosmic explosions.