


5.1. Underlying absorption corrections to the emission line fluxes
A clear signature of a population of
young and intermediate age stars is the presence of the Balmer
series in absorption in their optical spectrum.
A complication is that in star forming objects,
the Balmer emission lines from the ionized
gas appear superimposed
to the stellar absorption lines.
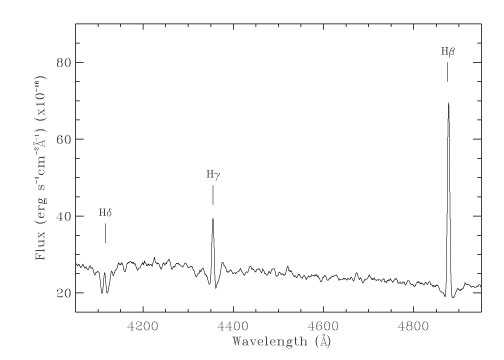
This effect, growing in importance towards the higher order Balmer lines,
is illustrated in Figure 3 where an example
(NGC 1510) is shown. It can be seen that, while
H emission is
moderately affected by the absorption, all of the
H
emission is
moderately affected by the absorption, all of the
H emission is lost into
the absorption. The equivalent width of the Balmer absorptions peaks at
H -
H
emission is lost into
the absorption. The equivalent width of the Balmer absorptions peaks at
H -
H and
there is no detection of any absorption in
H
and
there is no detection of any absorption in
H . This is due to the
facts that the
H absorption equivalent
width is much smaller than that
of H, and
that the wings of the
H absorption are
difficult to detect due to the presence of forbidden [NII] doublet
emission at
. This is due to the
facts that the
H absorption equivalent
width is much smaller than that
of H, and
that the wings of the
H absorption are
difficult to detect due to the presence of forbidden [NII] doublet
emission at  6548Å and
6584Å, right on top of both wings.
In spectra of poorer S/N or lower spectral resolution
than that of Figure 3, the wings of the Balmer
absorptions are not detected and the
result is an underestimate of the emitted fluxes and,
more important for luminosity determinations, an
overestimate of the internal extinction
(Olofsson 1995).
6548Å and
6584Å, right on top of both wings.
In spectra of poorer S/N or lower spectral resolution
than that of Figure 3, the wings of the Balmer
absorptions are not detected and the
result is an underestimate of the emitted fluxes and,
more important for luminosity determinations, an
overestimate of the internal extinction
(Olofsson 1995).
|
Figure 3. A blue spectrum of the star forming galaxy NGC 1510 is shown to illustrate the effect of stellar Balmer absorptions in the measurement of the emission line strengths. |
The observed ratio between two emission lines (e.g.
H and
H),
when the underlying absorption is included, is:
| (6) |
where F+(H) and
F+(H) are the intrinsic emission line
fluxes and F-(H) and
F-(H) are the intrinsic fluxes of
the corresponding absorption lines.
This expression is correct in the case that the emission and the
absorption lines have approximately equal widths.
Including the relation between the equivalent width, the flux of the continuum and the intensity of the line in equation 6 we obtain,
| (7) |
where,
FC(H) and
FC(H) are the continuum in
H and
H
respectively, EW+ and EW- are the
equivalent widths in emission and in absorption respectively for the
different lines,
Q = EW-(H) /
EW+(H) is the ratio between
the equivalent widths of
H in
absorption and in emission,
P = EW-(H) /
EW-(H)
is the
ratio between the equivalent widths in absorption of
H and
H and
F+(H)
/ F+(H) = 2.86 is the theoretical ratio between
H and
H in emission
for Case B recombination
[Osterbrock 1989].
The value of P can be obtained from spectral evolutionary
calculations like those of
Olofsson (1995)
For the case of solar abundance and stellar masses
varying between 0.1 and 100
M within a
Salpeter IMF, the value of P changes between 0.7 and 1 for ages
between 1 and 15 million years respectively.
This variation in the P parameter produces a
change in the estimated
F(H) /
F(H)
ratio of less than 2%, so in what follows we asssume P = 1.
within a
Salpeter IMF, the value of P changes between 0.7 and 1 for ages
between 1 and 15 million years respectively.
This variation in the P parameter produces a
change in the estimated
F(H) /
F(H)
ratio of less than 2%, so in what follows we asssume P = 1.
For an instantaneous burst, the ratio
EW+(H) /
EW+(H)
varies between 0.14 and 0.26
(Mayya 1995,
Leitherer & Heckman
1995).
The corresponding equation for
H and
H is:
and
H is:
| (8) |
where
G = EW-(H) /
EW-(H)
is the ratio between the
equivalent widths in absorption of
H and
H and we
assume for the respective emissions an intrinsic ratio
of 0.47 for Case B recombination
[Osterbrock 1989].
The evolution of the equivalent width of the Balmer absorption lines has been analyzed by González Delgado, Leitherer and Heckman (1999). In their models the parameter G is almost constant in time and independent of the adopted star formation history. We fixed the value of G to 1 as suggested by their results.
The effect of the underlying stellar absorptions is shown as a vector
Q
in Figure 4 (from equations 7 and 8).
The whole time dependence is shown by the three closely grouped vectors.
Its range is much smaller than typical observational errors.
Dust extinction is also represented by a vector
in the same plane (equation A8).
It is possible, as these two vectors are not parallel, to solve
simultaneously for underlying absorption (Q) and extinction (Av)
for every object for which
F(H),
F(H) and
F(H) are
measured.
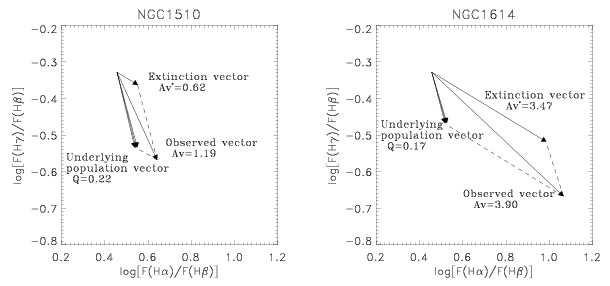
|
Figure 4. Logarithmic ratio of
F(H |
We further illustrate the presence of underlying Balmer absorption in
star forming galaxies in Figure 5 where we have
plotted the galaxies from our sample in the
log (F(H)
/ F(H)) vs.
log (F(H) /
F(H)) plane.
Also shown are the vectors depicting dust extinction and the underlying
absorption. Clearly, most observational points
occupy the region below the reddening vector and to the right of the
Balmer absorption vector. In the absence of underlying absorption
all points should be distributed along the extinction vector. The
fact that there is a clear spread below the extinction vector gives
support to the underlying absorption scenario. We also find that the
objects with smaller equivalent width of
H are
systematically further away from the pure extinction vector.
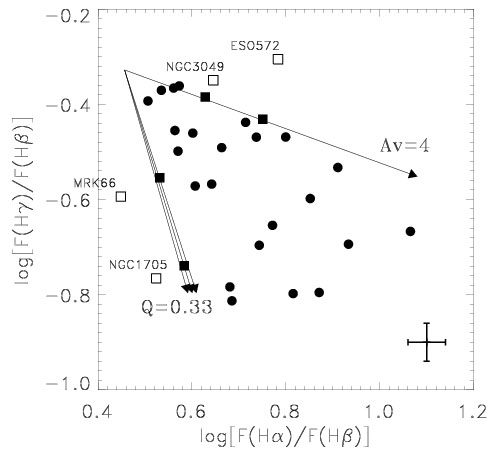
|
Figure 5. The galaxies from our sample are
plotted in the Balmer decrement plane log
(F(H |
Four galaxies (NGC 3049, ESO 572, MRK 66 and NGC 1705) fall outside the space defined by the extinction and underlying absorption vectors, although two of them are within the errors. The other two (ESO 572 and MRK 66) are faint and reported as having been observed in less than optimum conditions in the original observations paper.
We have used this method to estimate simultaneously the "real" visual extinction Av * and the underlying Balmer absorption Q §. The values of Av * were then applied to the UV continuum and the emission line fluxes; the corrected values are listed in Table 2.
| Name | Av | Av * | Q × 100 | |
(1 -
) |
EW(H) |
| NGC7673 | 1.84 | 1.11 | 27 | -1.50 | 0.11 | 4.69 |
| CAM0840 | 0.50 | 0.43 | 3 | -1.26† | 0.33 | 121* |
| CAM1543 | 0.67 | 0.67 | 0 | -0.70† | - | 224* |
| TOL1247 | 0.75 | 0.75 | 0 | -0.47† | 0.46 | 97* |
| NGC1313 | 3.06 | 2.45 | 23 | -0.60‡ | 0.02 | 0.03 |
| NGC1800 | 1.47 | 0.56 | 33 | -1.65 | 0.56 | 1.10 |
| ESO572 | 2.10 | 1.87 | 0 | -1.96† | 0.48 | 14.81 |
| NGC7793 | 2.38 | - | - | -1.34 | 0.04 | 0.06 |
| UGCA410 | 0.97 | 0.37 | 23 | -1.84 | 0.58 | 36.52 |
| UGC9560 | 0.69 | 0.34 | 14 | -2.02 | 0.51 | 36.63 |
| NGC1510 | 1.19 | 0.62 | 22 | -1.71 | 0.43 | 8.42 |
| NGC1705 | 0.43 | 0.0 | 31 | -2.42 | 0.81 | 4.20 |
| NGC4194 | 2.91 | 2.73 | 8 | -0.26 | 0.02 | 10.14 |
| IC1586 | 2.02 | 1.37 | 25 | -0.91 | 0.17 | 9.51 |
| MRK66 | 0.00 | 0.00 | 23 | -1.94 | 0.42 | 13.50 |
| Haro15 | 0.73 | 0.27 | 18 | -1.48 | 0.35 | - |
| NGC1140 | 0.93 | 0.62 | 13 | -1.78 | 0.34 | 11.19 |
| NGC5253 | 0.32 | 0.12 | 9 | -1.33 | 0.11 | 16.07 |
| MRK542 | 1.66 | - | - | -1.32 | 0.32 | 11.23 |
| NGC6217 | 2.30 | 1.46 | 31 | -0.74 | 0.05 | 1.30 |
| NGC7714 | 1.65 | 1.57 | 4 | -1.23 | 0.09 | 18.40 |
| NGC1614 | 3.90 | 3.47 | 17 | -0.76 | 0.01 | 5.82 |
| NGC6052 | 1.33 | 0.98 | 14 | -0.72 | 0.06 | 8.68 |
| NGC5860 | 3.77 | - | - | -0.91 | 0.12 | 4.02 |
| NGC6090 | 1.80 | 1.62 | 8 | -0.78‡ | 0.06 | 25.00 |
| IC214 | 2.54 | 2.08 | 18 | -0.61 | 0.05 | 3.14 |
| MRK309 | 2.36 | - | - | 2.08† | 0.03 | 3.68 |
| NGC3049 | 1.21 | 1.01 | 0 | -1.14 | 0.13 | 4.49 |
| NGC4385 | 2.20 | 2.10 | 4 | -1.02 | 0.09 | 6.60 |
| NGC5236 | 1.44 | 0.56 | 32 | -0.83 | 0.06 | 0.44 |
| NGC7552 | 2.66 | 1.85 | 30 | 0.48 | 0.01 | 2.38 |
Figure 6 shows the result of taking into account
the corrections for Balmer absorptions due to an
underlying stellar population. The medians of both
 OII and
H
are close to zero indicating that including the underlying absorption
correction brings into agreement the SFR in the optical with
those in the FIR. At the same time
UV shows
still a positive value indicating an excess with respect to the FIR
estimate. We must remember that while the ratio of emission line fluxes
to FIR flux is not very sensitive to changes in the photon escape from
object to object,
this is not the case for the ratio of UV continuum to FIR fluxes.
The reason being that while in the UV continuum we are
detecting directly the escaped photons, i.e. those that do not
heat the dust or ionize the gas, the emission lines and FIR fluxes
are reprocessed radiation, i.e. the product of the radiation that does not
escape the region.
OII and
H
are close to zero indicating that including the underlying absorption
correction brings into agreement the SFR in the optical with
those in the FIR. At the same time
UV shows
still a positive value indicating an excess with respect to the FIR
estimate. We must remember that while the ratio of emission line fluxes
to FIR flux is not very sensitive to changes in the photon escape from
object to object,
this is not the case for the ratio of UV continuum to FIR fluxes.
The reason being that while in the UV continuum we are
detecting directly the escaped photons, i.e. those that do not
heat the dust or ionize the gas, the emission lines and FIR fluxes
are reprocessed radiation, i.e. the product of the radiation that does not
escape the region.
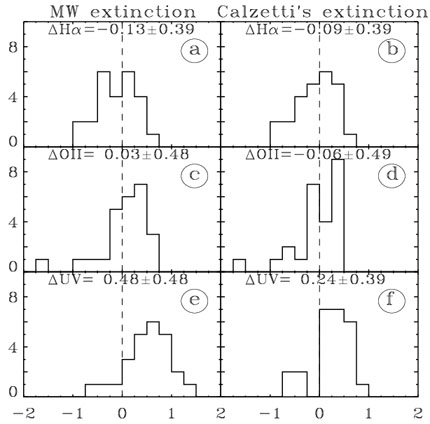
|
Figure 6. The figure shows the histograms of
the normalized SFR after the underlying stellar absorption effect is
deducted from the extinction estimates,
i.e. A*V is used instead of
AV (Section 5.1).
Panels a, c, e show the distributions after correcting
the H |
A striking aspect is the large reduction in the r.m.s. scatter in the
UV from 0.70
before corrections to 0.39 after corrections, i.e. about half the
original value. This simple fact
suggests the goodness of the corrections applied to the data.
This aspect is also illustrated in Figure 7
when compared to Figure 1.
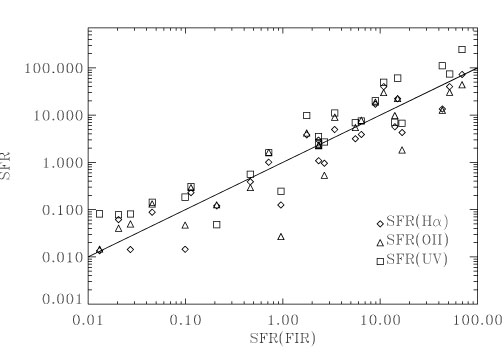
|
Figure 7. Corrected SFR estimators vs. SFR(FIR). The corrections include the underlying Balmer absorption (see Section 5.1) and photon escape (see Section 5.2. The solid line represents equal values. |
§ See Appendix A for a detailed discussion on the dust extinction corrections to the observed fluxes. Back.
 errors in the line
ratios. Most points are, within the errors, below the
reddening line and to the right of the underlying Balmer absorption line.
errors in the line
ratios. Most points are, within the errors, below the
reddening line and to the right of the underlying Balmer absorption line.